Android Studio 包含一个 APK 分析器,可让您在构建流程完成后立即了解 APK 或 Android App Bundle 文件的组成。使用 APK 分析器可以减少调试应用的 DEX 文件和资源相关问题所用的时间,并且有助于减小 APK 的大小。您也可以使用 apkanalyzer 从命令行运行 APK 分析器。
借助 APK 分析器,您可以:
- 查看应用中的文件(如 DEX 和 Android 资源文件)的绝对大小和相对大小。
- 了解 DEX 文件的组成。
- 快速查看应用中的文件(如
AndroidManifest.xml文件)的最终版本。 - 对两个 APK 或 app bundle 进行对照比较。
当某个项目处于打开状态时,您可以通过以下三种方式访问 APK 分析器:
- 将 APK 或 app bundle 拖到 Android Studio 的 Editor 窗口中。
- 在 Project 窗口中切换到 Project 视图,然后在默认的
build/output/apks/目录中双击相应 APK。 - 在菜单栏中依次选择 Build > Analyze APK,然后选择您的 APK 或 app bundle。
查看文件和大小信息
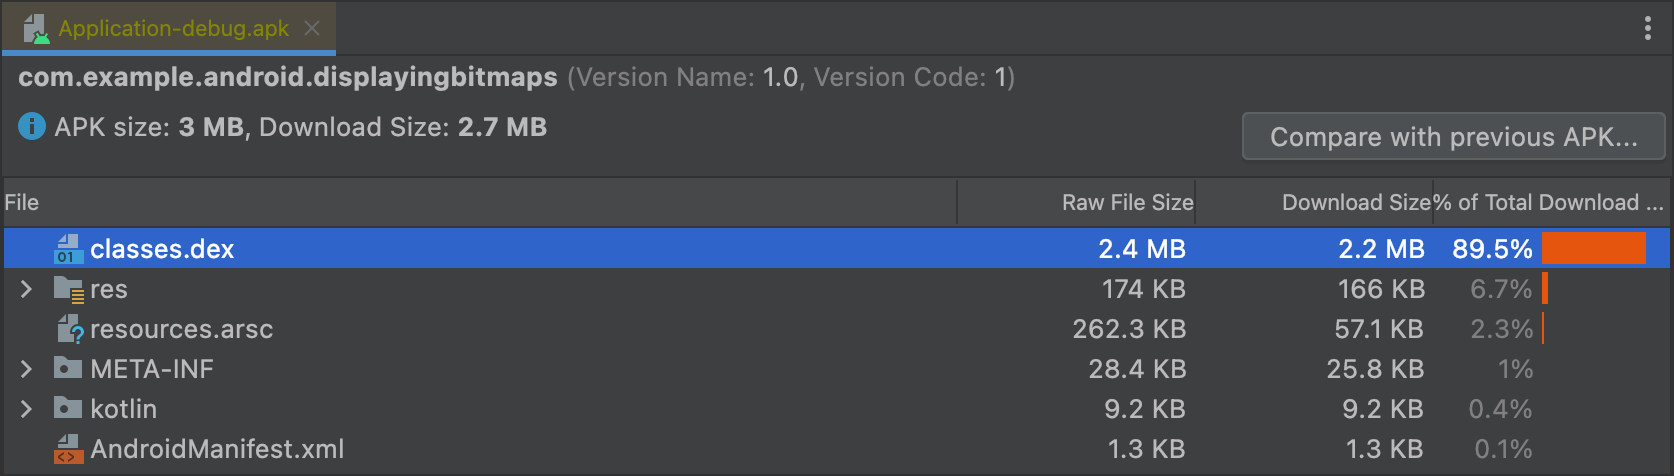
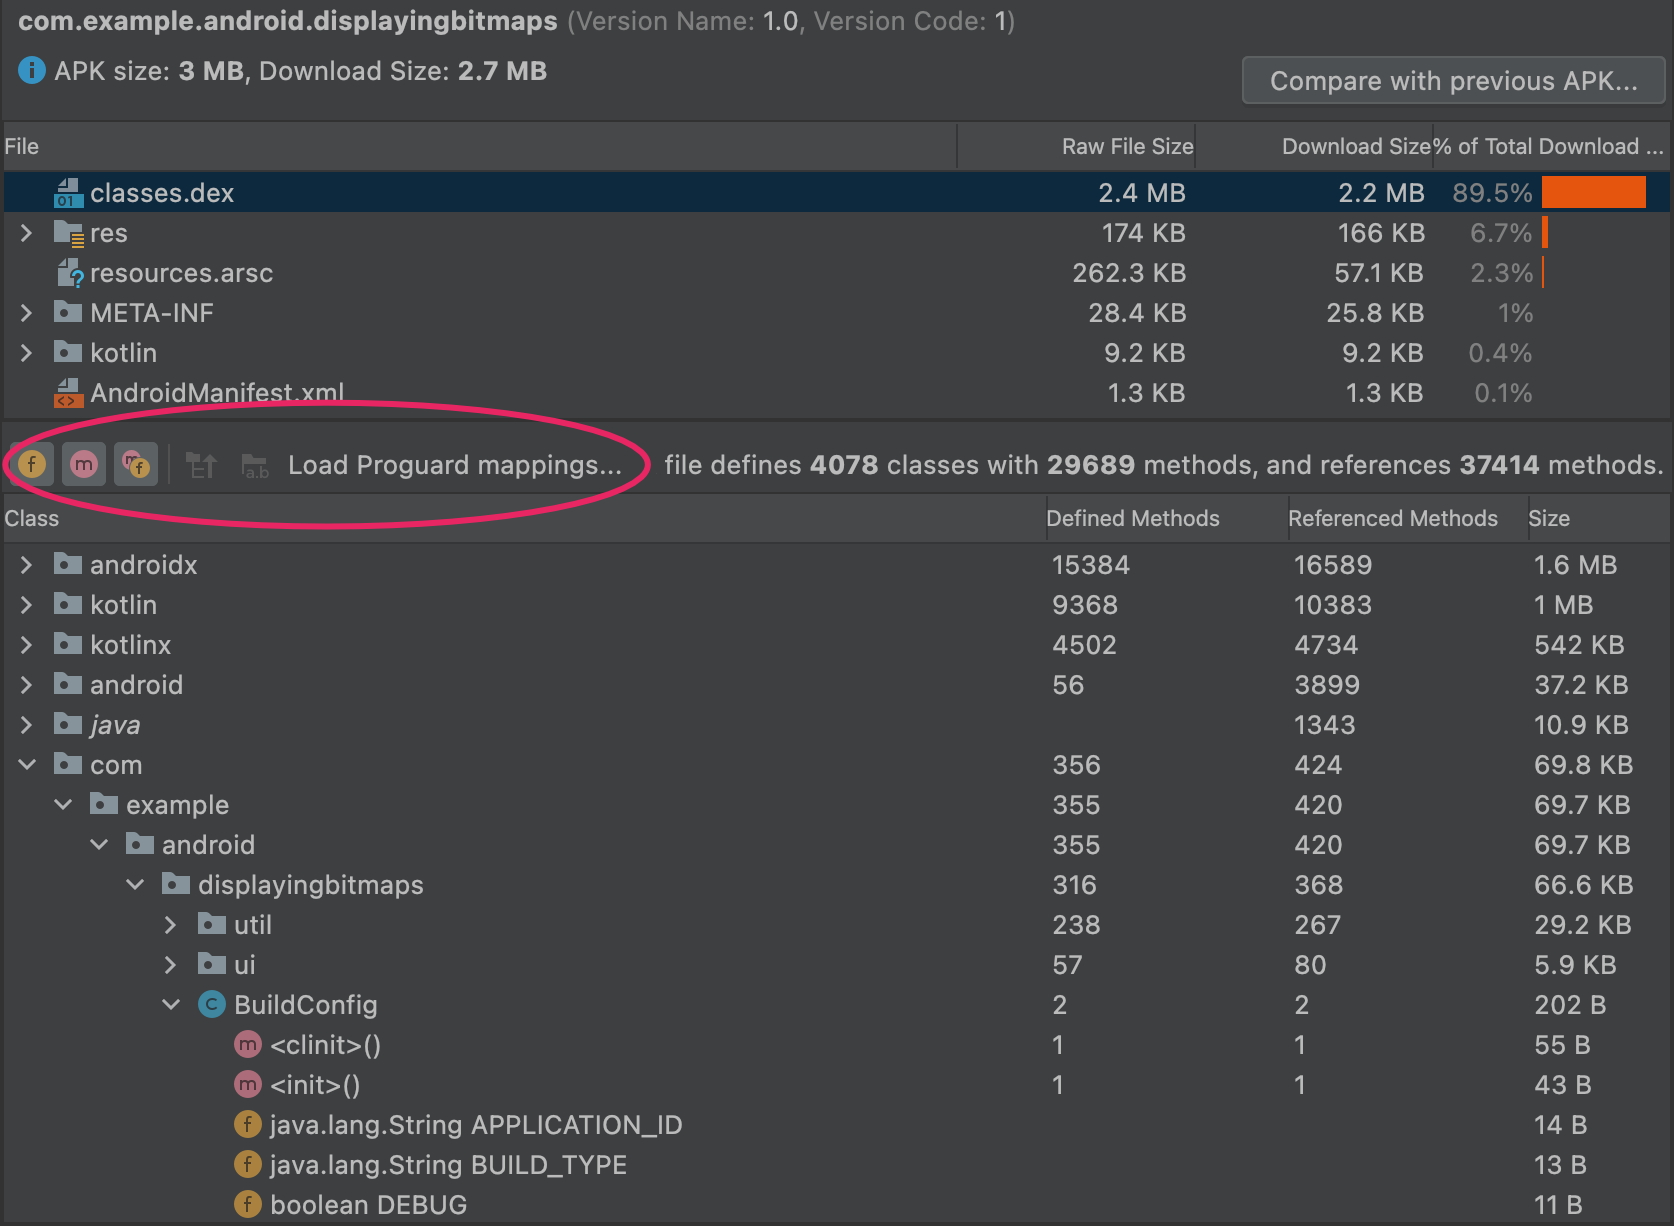
APK 是遵循 ZIP 文件格式的文件。APK 分析器将每个文件或文件夹显示为一个实体,您可展开这些实体以导航到相应文件夹。这些实体的层次结构反映了 APK 中的文件和文件夹的结构。
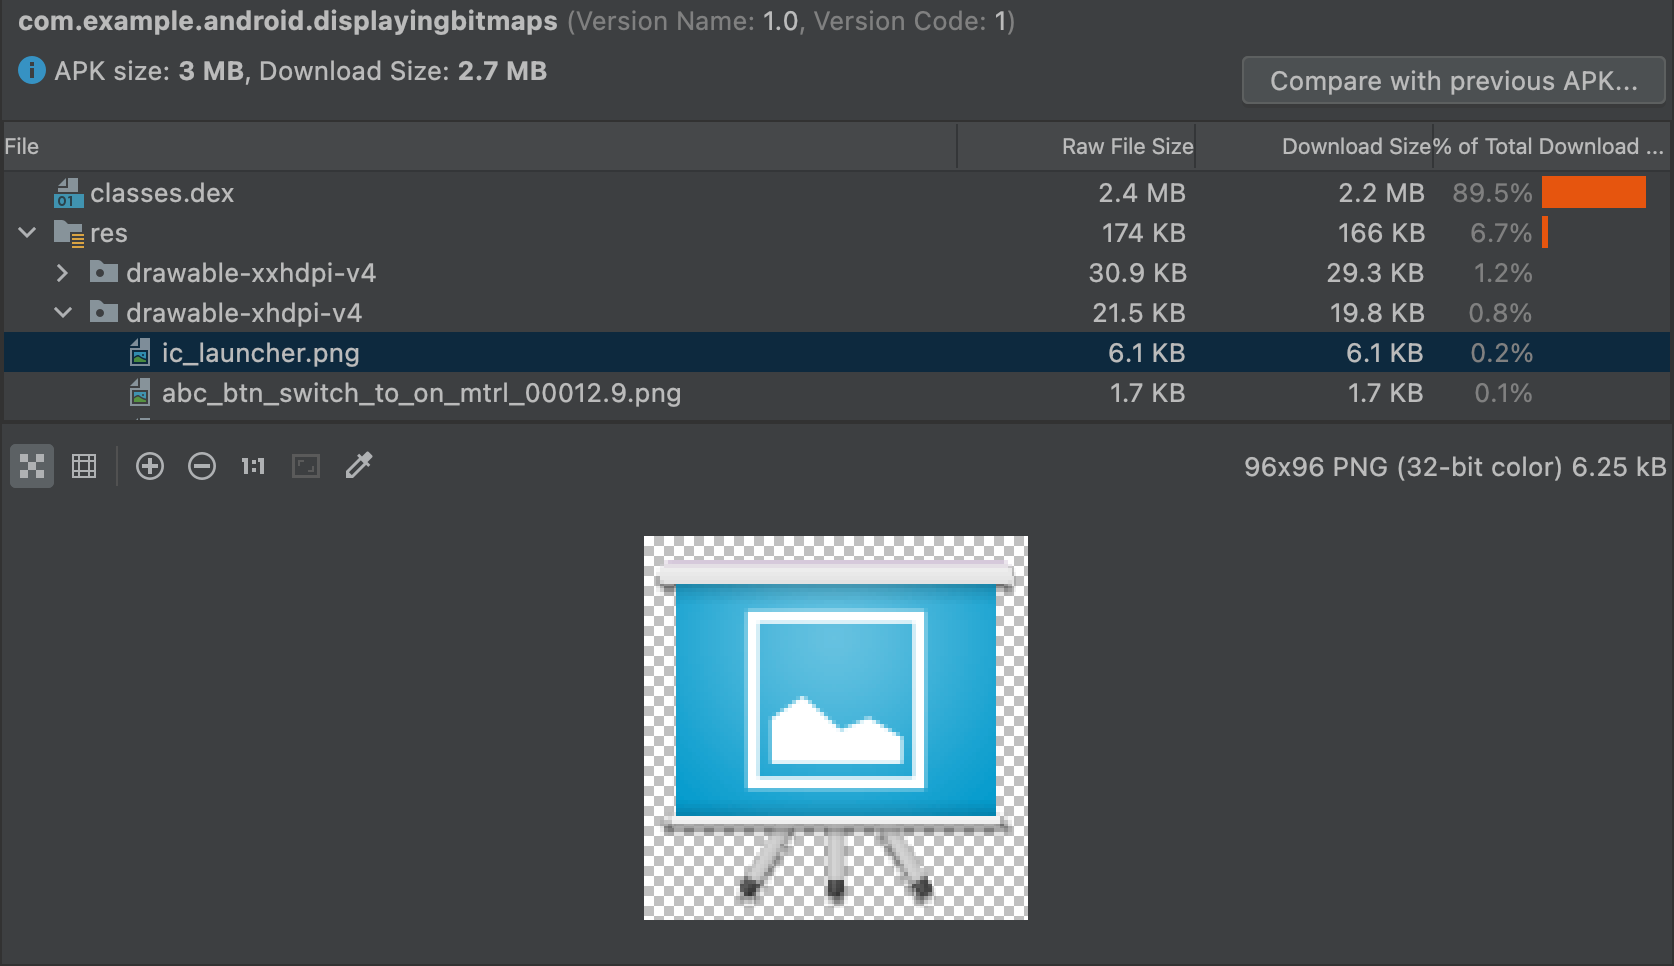
APK 分析器会显示每个实体的压缩文件大小(或“原始文件大小”)和下载文件大小值,如图 1 所示。Raw File Size 表示实体对总 APK 大小的贡献。Download Size 则表示实体由 Google Play 提交时的压缩后大小的估计值。% of Total Download Size 表示实体占 APK 总下载大小的百分比。
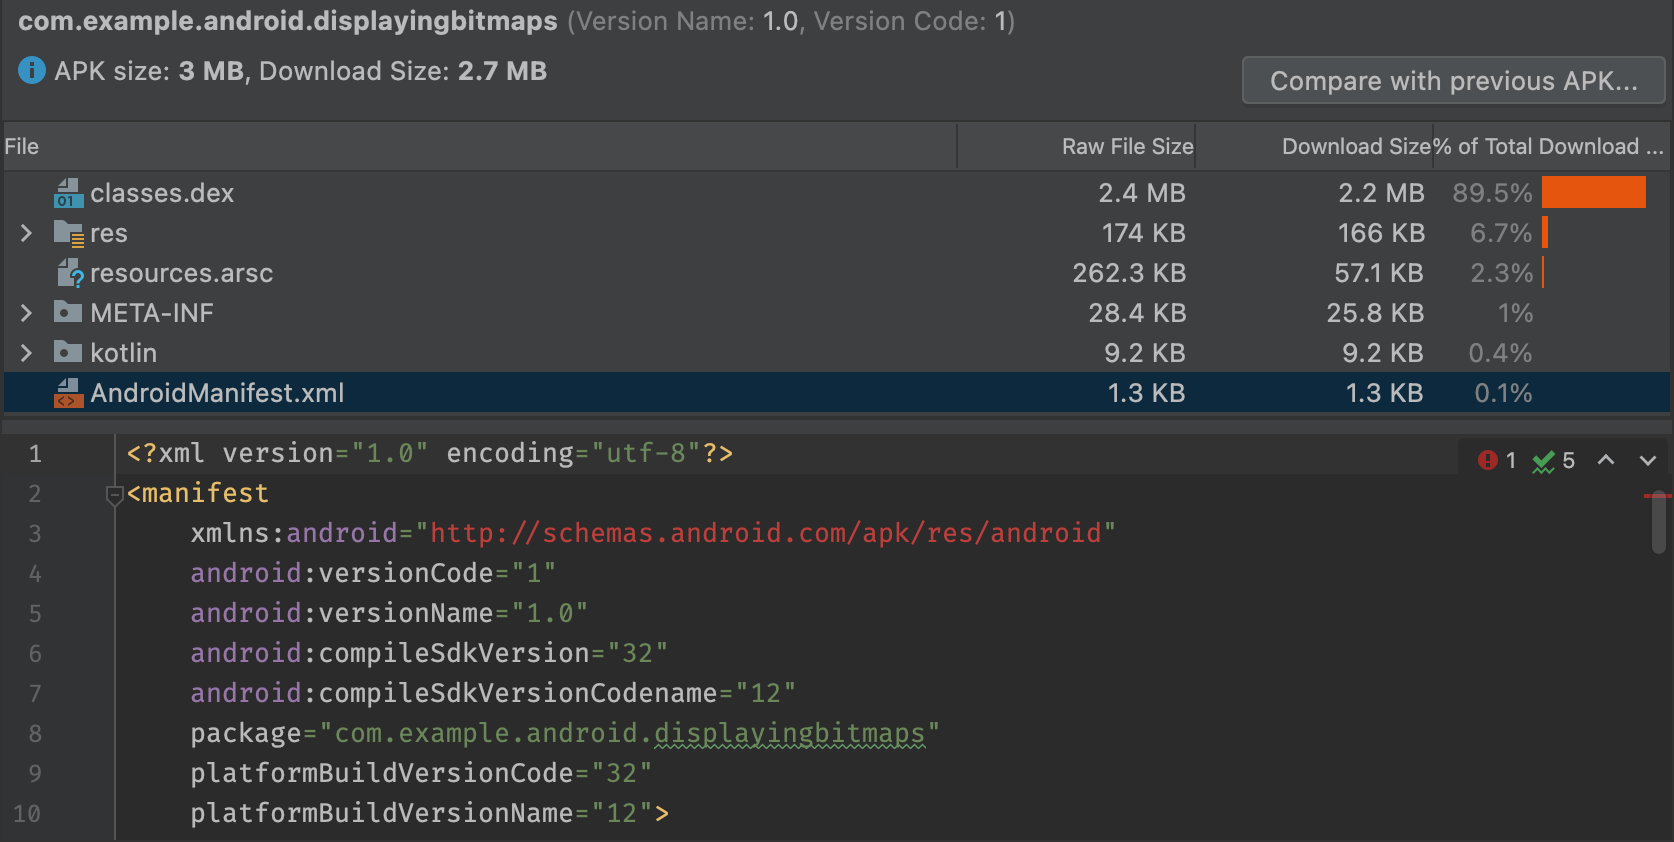
查看 AndroidManifest.xml
如果您的项目包含多个 AndroidManifest.xml 文件(如产品变种的清单文件)或者包含的库也提供清单文件,这些文件会在您的应用中合并成一个文件。此清单文件在 APK 或 app bundle 中通常是二进制文件,但在 APK 分析器中选择此文件后,系统会重构并呈现此实体的 XML 格式。
在此查看器中,您可以了解在构建期间可能对您的应用所做的任何更改。例如,您可以看到应用所依赖的某个库中的 AndroidManifest.xml 文件是如何合并到最终 AndroidManifest.xml 文件中的。
此外,此查看器还提供了一些 lint 功能,并且会在右上角显示警告或错误。图 2 显示了查看器正在报告选定清单文件中的一条错误。
查看 DEX 文件
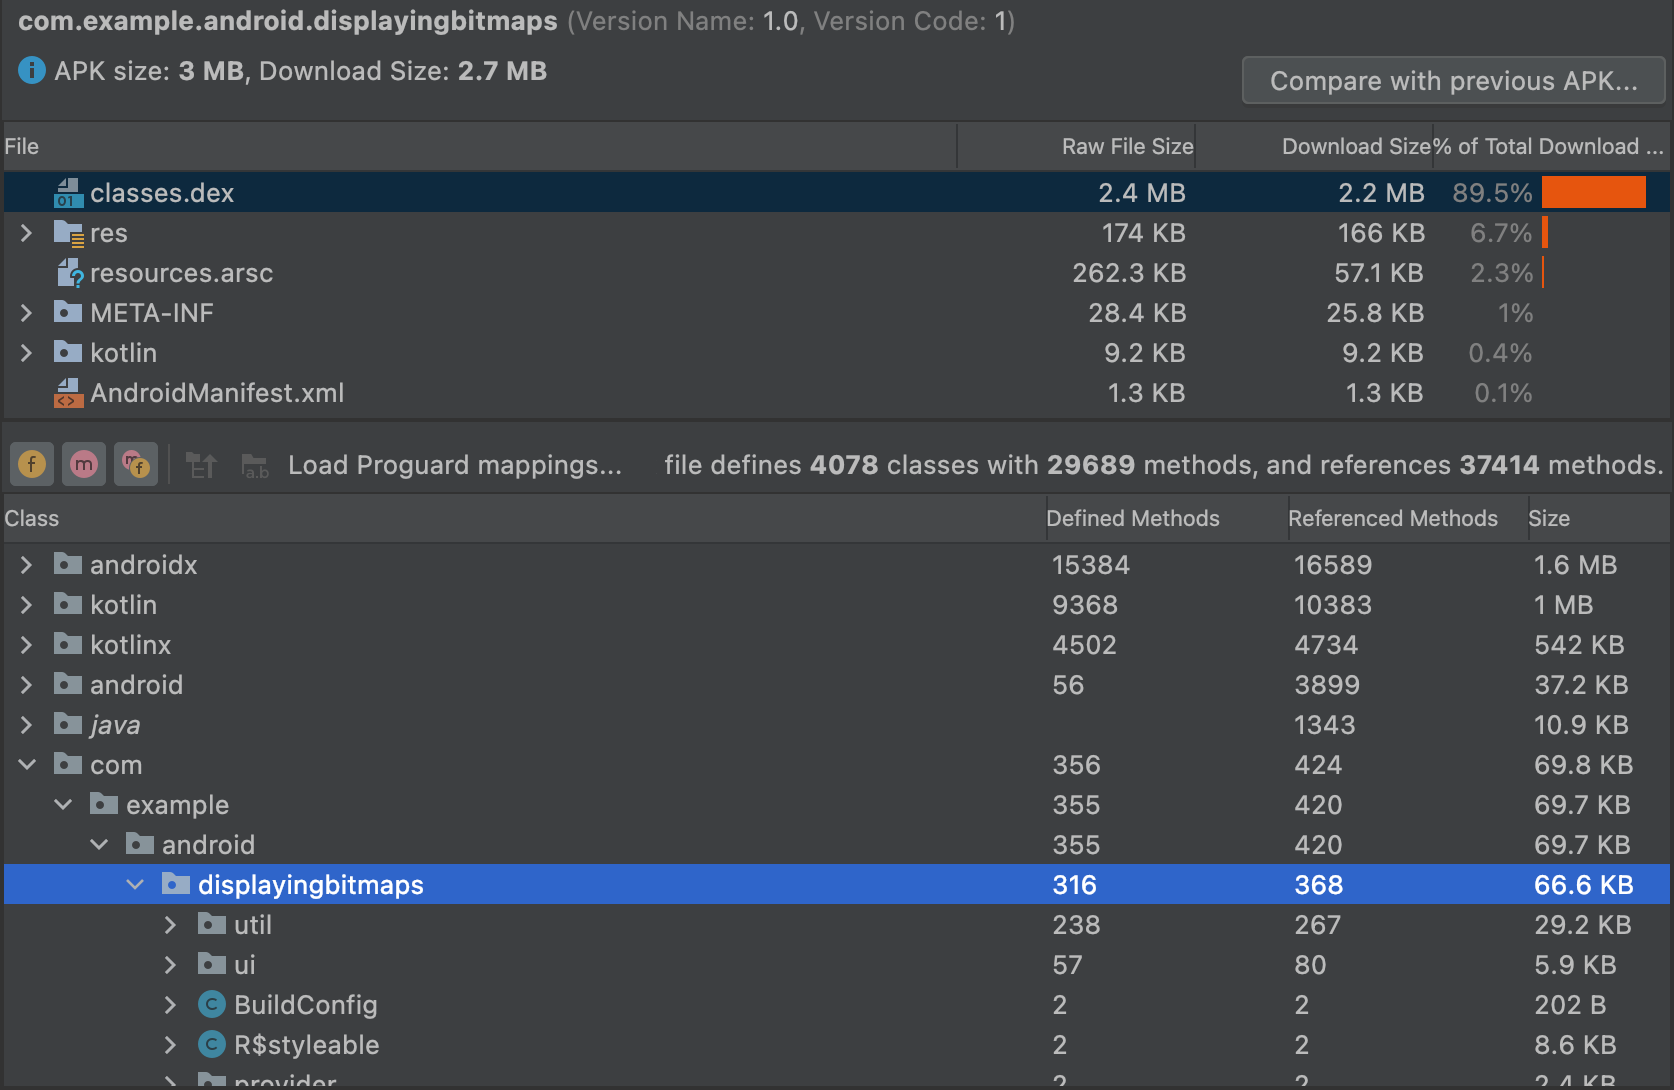
在 APK 分析器的 DEX 文件查看器中,您可以立即查看应用的 DEX 文件中的底层信息。该查看器中提供了类、软件包、总引用和声明计数,这有助于决定是否使用 MultiDex 或如何移除依赖项以避免超出 64K DEX 限制。
图 3 显示了一个低于 64k DEX 限制的中等大小的应用。Defined Methods 和 Referenced Methods 列中列出了 DEX 文件中每个软件包、类和方法的相关计数。
Referenced Methods 列会统计 DEX 文件引用的所有方法。这通常包括在您的代码和依赖项库中定义的方法,以及在代码使用的标准 Java 和 Android 软件包中定义的方法。这些方法计入每个 DEX 文件中的 64k 方法限制。
Defined Methods 列仅统计在某一个 DEX 文件中定义的方法,所以此数字是 Referenced Methods 的子集。
过滤 DEX 文件树状视图
在 Class 列表正上方,APK 分析器提供了用于查看所选 DEX 文件内容的过滤器,如图 4 中所示。
BuildConfig 的字段和方法。如需使用过滤器来显示某个类中的所有方法和字段,请执行以下操作:
- 在 File 列表中,选择
classes.dex文件。 - 在 Class 列表中,导航到一个类并选择该类。
- 展开您选择的类。
- 切换 Show fields 图标
 以显示或隐藏类字段。
 - 切换 Show methods 图标
 以显示或隐藏类方法。
 切换 Show all referenced methods or fields 图标
 以显示或隐藏引用的软件包、类、方法和字段。
在树状视图中,斜体节点是在选定 DEX 文件中没有定义的引用。DEX 文件可以引用在其他文件中定义的方法和字段。例如,
System.out.println()是对 Android 框架中的println()方法的引用。
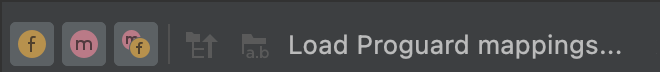
加载 ProGuard 映射
过滤器图标旁边是 ProGuard 映射图标。ProGuard 图标处于灰显状态,直到您加载一组 ProGuard 映射文件来向 DEX 查看器添加一些功能,如对名称进行去混淆处理 (mapping.txt)、显示已移除的节点 (usage.txt),以及指示无法移除的节点 (seeds.txt)。
您导入的 ProGuard 映射文件来自的 build 必须与启用了代码缩减功能后生成 DEX 文件的 build 相同。
若要加载 ProGuard 映射文件,请执行以下操作:
- 点击 Load Proguard Mappings…。
导航到包含映射文件的项目文件夹,然后加载所有文件、文件的任意组合或包含文件的文件夹。
映射文件通常位于
project/app/build/outputs/mappings/release/。如果文件选择器检测到此项目结构,会默认选择 release 文件夹。首先,文件选择器会检查与
mapping.txt、seeds.txt和usage.txt完全匹配的文件名。接下来,文件选择器会检查在任意位置包含文本mapping、usage或seeds且以.txt结尾的文件名。例如,release-seeds-1.10.15.txt就是一个匹配项。
以下列表介绍了映射文件:
seeds.txt:ProGuard 配置阻止在缩减过程中移除的节点以粗体显示。mapping.txt:启用 Deobfuscate names ,以便恢复由 R8 进行了混淆处理的节点的原始名称。例如,可以将
 a、b、c之类进行了混淆处理的节点名称恢复为MyClass、MainActivity和myMethod()。usage.txt:启用 Show removed nodes ,以便显示 R8 在缩减过程中移除的类、方法和字段。恢复的节点带删除线。
如需详细了解如何使用 R8 对代码进行混淆处理并最大限度地减小其大小,请参阅缩减、混淆处理和优化应用。
显示字节码、查找用法以及生成 Keep 规则
Class 列表视图中的节点具有一个上下文菜单,其中包含以下选项,可用于查看字节码、查找用法以及显示一个对话框(其中显示了您可以为选定节点复制并粘贴的 ProGuard 规则)。右键点击 Class 列表视图中的任意节点即可显示其上下文菜单。
Show bytecode:对选定的类、方法或字段进行反编译,并在对话框中显示 smali 字节码表示形式,如下所示:
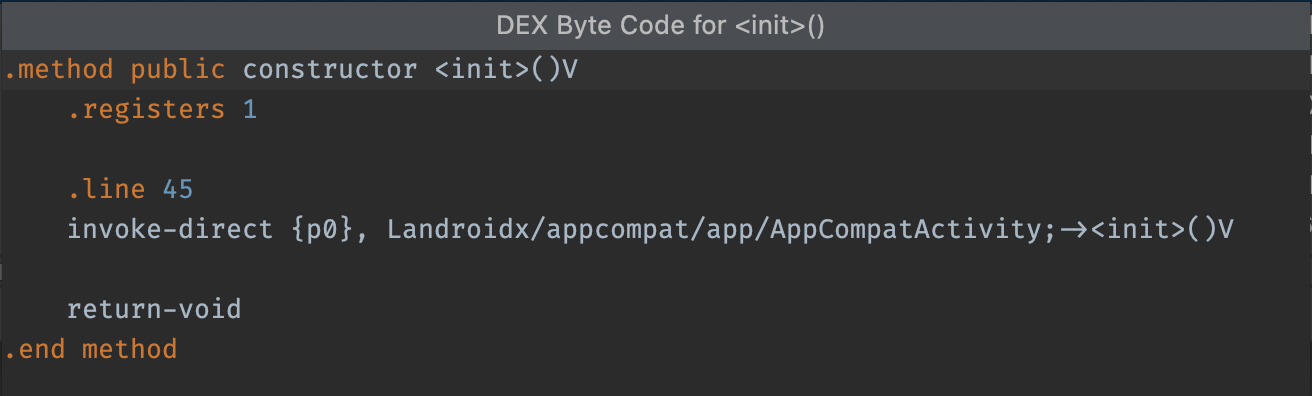
init 方法的 DEX 字节码。Find usages:显示 DEX 代码的哪些其他部分对选定的类或方法进行了引用,如图 7 中所示。如果加载了 seeds.txt,以粗体显示的节点表示 ProGuard 配置阻止在压缩过程中移除这些节点:
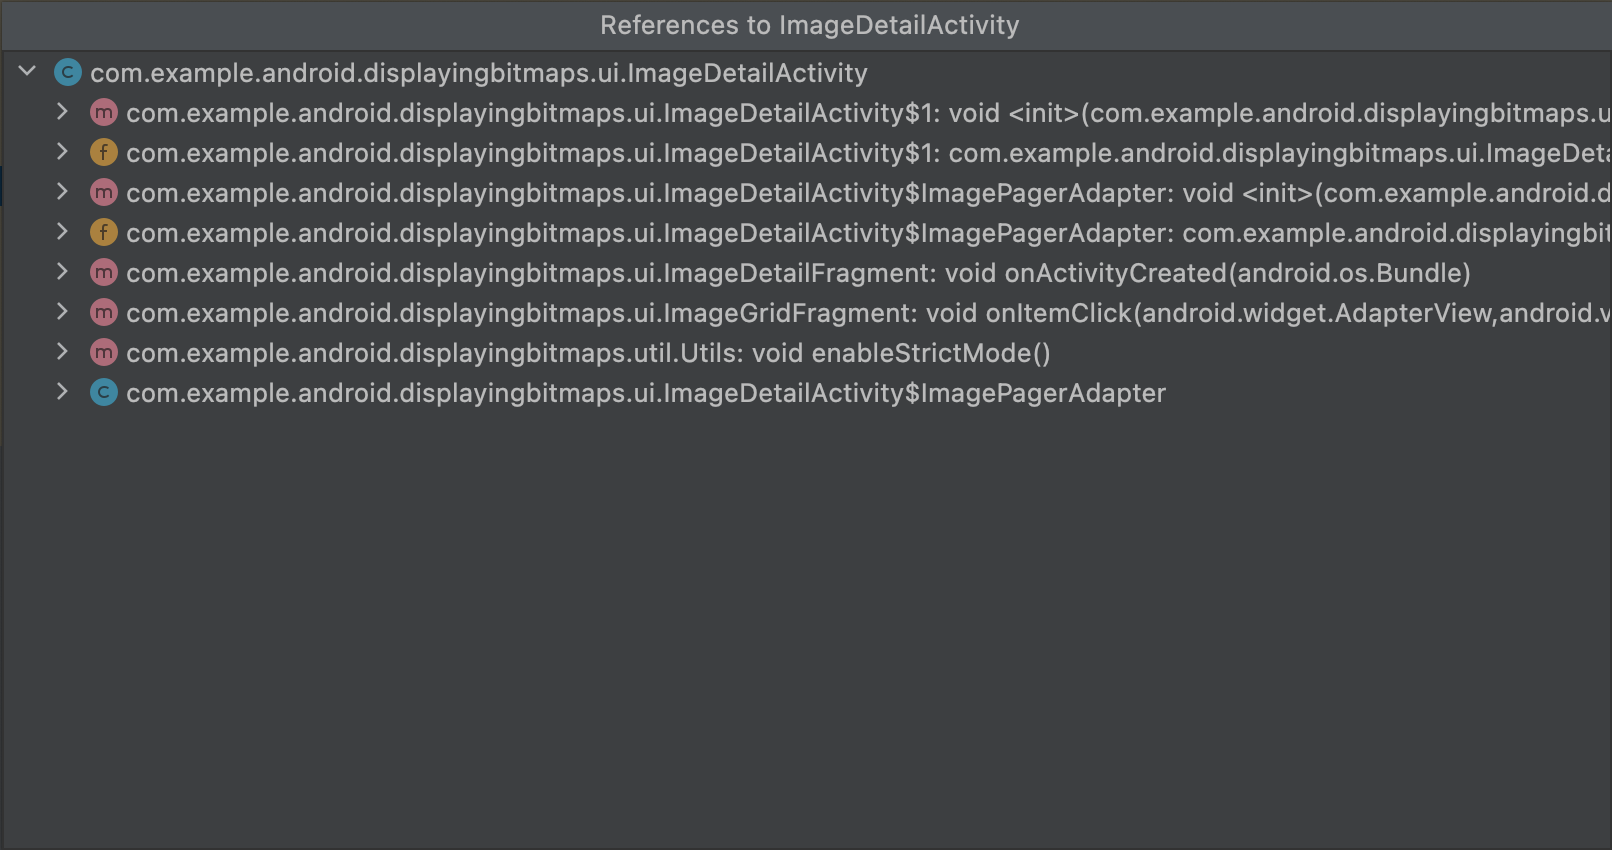
MyClass 的引用。
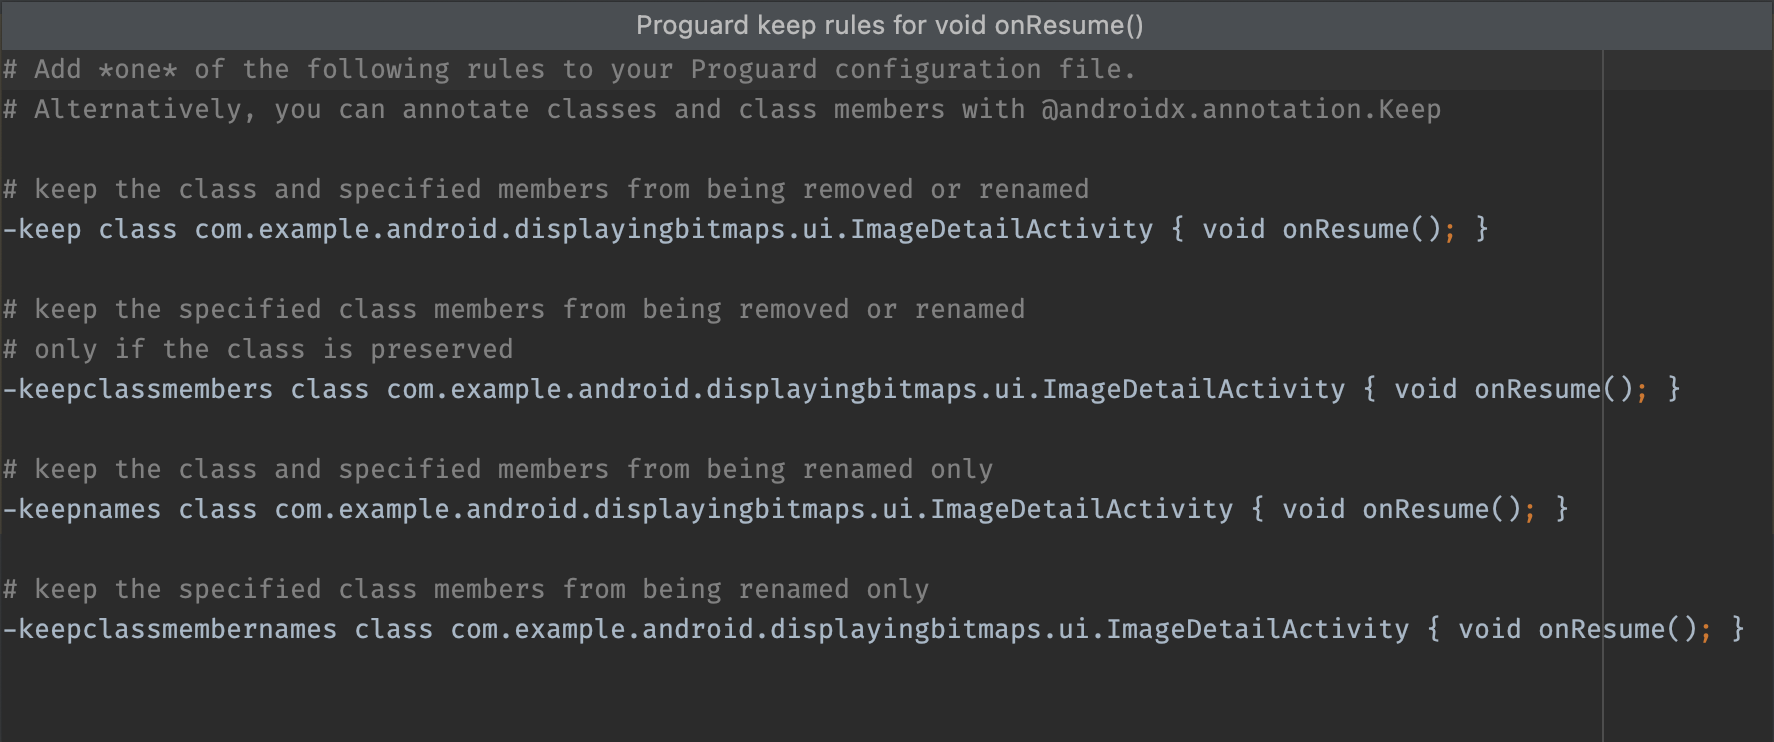
Generate Proguard Keep rule:显示您可以复制并粘贴到项目 ProGuard 配置文件中的 Proguard 规则,如图 8 中所示。这样可阻止在代码缩减阶段移除给定的软件包、类、方法或字段。如需了解详情,请参阅自定义要保留的代码。
查看代码和资源实体
各种构建任务会更改应用中的最终实体。例如,ProGuard 缩减规则可能会改变您的最终代码,而图片资源可能会被产品变种中的资源替换。
如需使用 APK 分析器查看文件的最终版本,请点击相应实体以显示文本或图片实体的预览,如图 9 中所示。
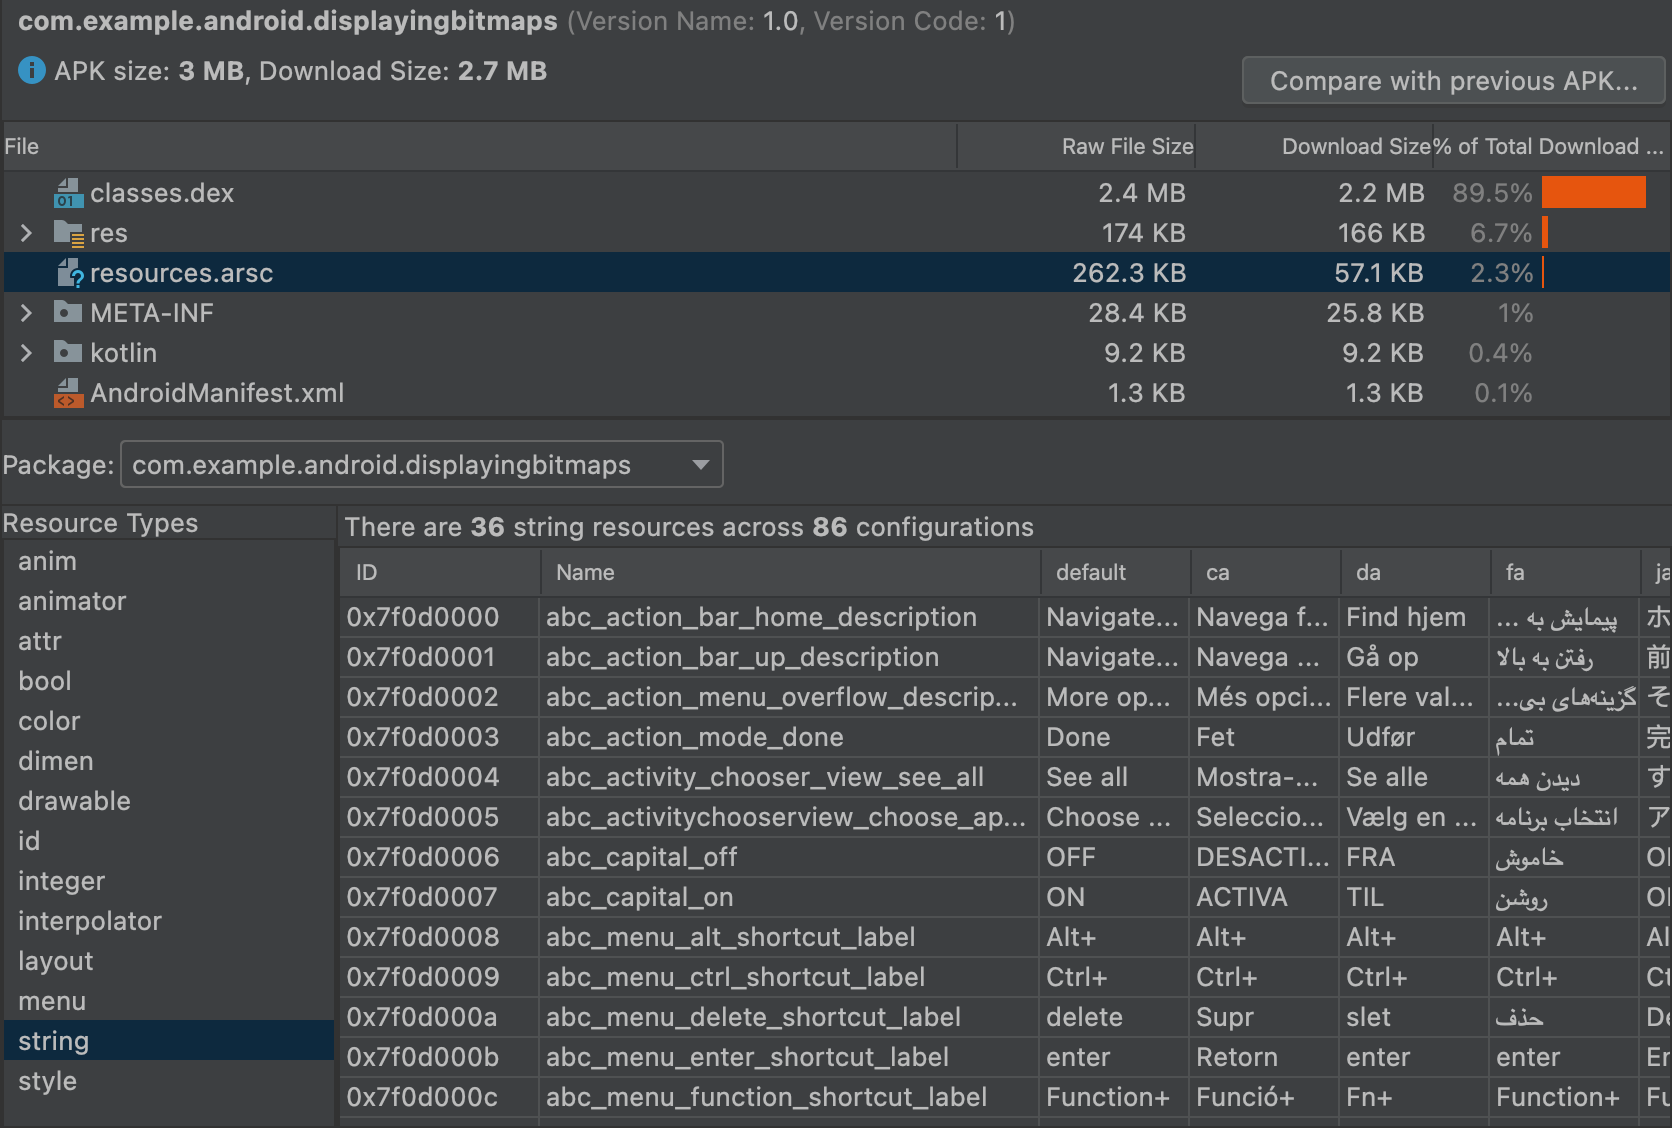
APK 分析器还可以显示各种文本和二进制文件。例如,在 resources.arsc 实体查看器中,您可以查看配置专用的值,如字符串资源的语言翻译。在图 10 中,您可以看到每个字符串资源的翻译。
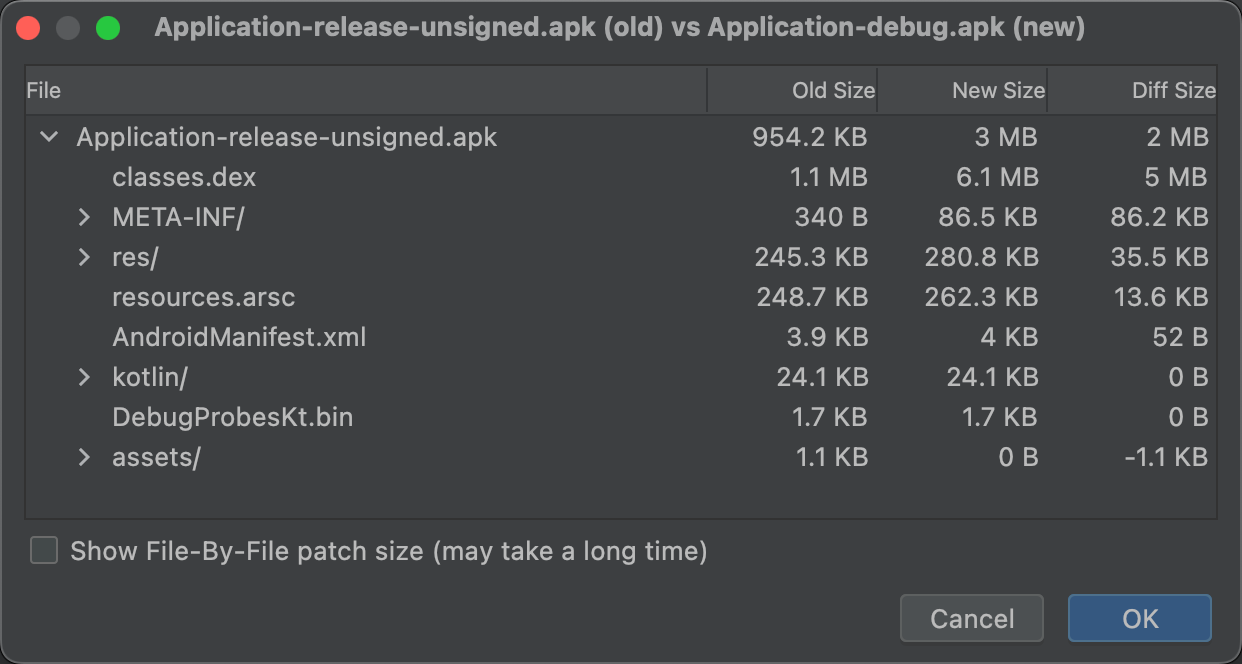
比较文件
APK 分析器可以比较两个不同 APK 或 app bundle 文件中的实体大小。当您需要了解为什么您的应用较之先前版本有所增大时,这非常有用。
在发布经过更新的应用之前,请执行以下操作:
- 将要发布的应用版本加载到 APK 分析器中。
- 点击 APK 分析器右上角的 Compare with previous APK…。
在选择对话框中,找到上次向用户发布的工件,然后点击 OK。
此时将显示一个类似于图 11 中的对话框,帮助您评估更新可能会对用户产生的影响。
图 11 显示了特定应用的调试 build 和发布 build 之间的差异。这两种 build 类型使用不同的 build 选项,因而会以不同的方式改变底层实体。