 Google uses AI technology to translate content into your preferred language. AI translations can contain errors.
调用图表
使用集合让一切井井有条
根据您的偏好保存内容并对其进行分类。
调用图表以图形方式来呈现方法轨迹或函数轨迹,其中调用的时间段和时间在横轴上表示,而其被调用方则在纵轴上显示。对系统 API 的调用显示为橙色,对应用自有方法的调用显示为绿色,对第三方 API(包括 Java 语言 API)的调用显示为蓝色。图 1 显示了一个调用图表示例,说明了给定方法或函数的 Self 时间、Children 时间和 Total 时间的概念。如需详细了解这些概念,请参阅自上而下和自下而上的图表。
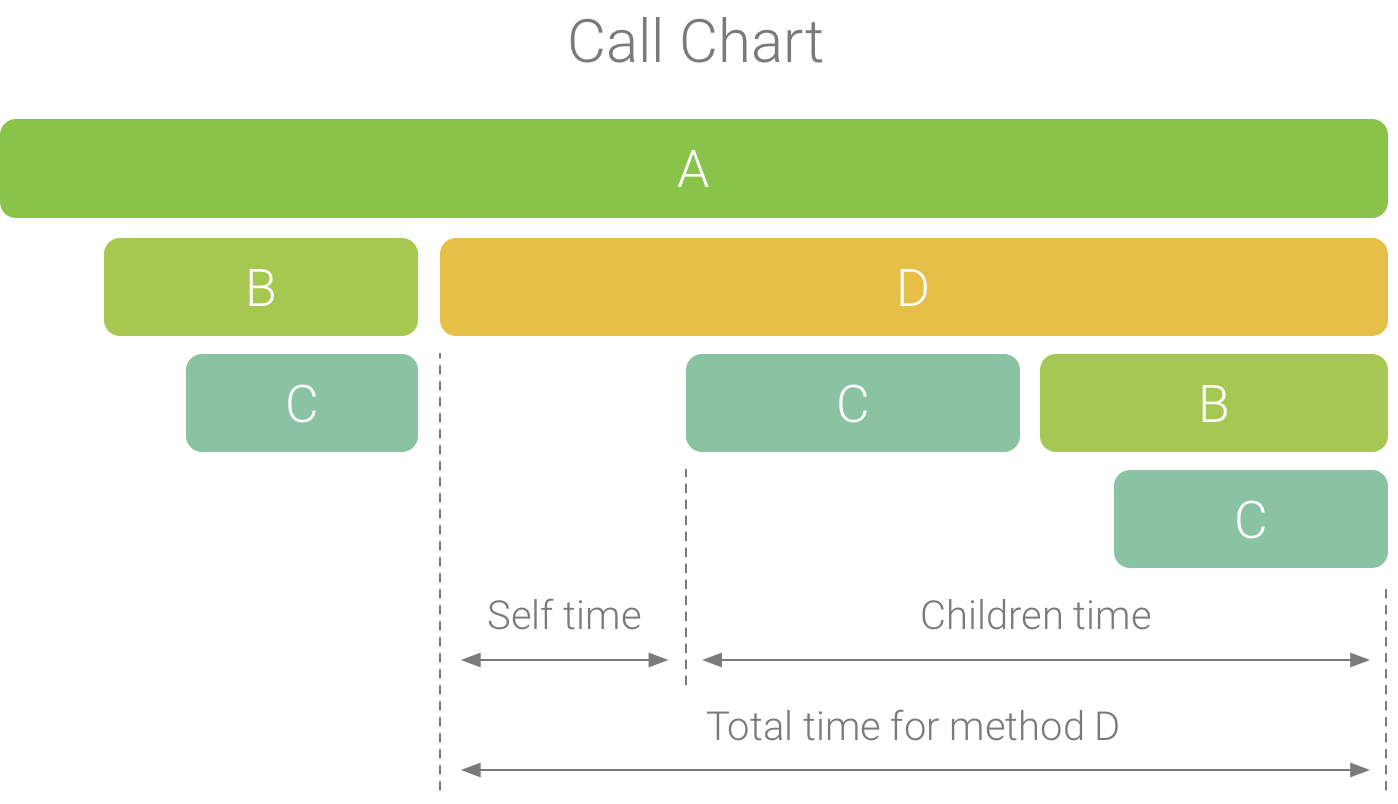
图 1. 一个调用图表示例,展示了方法 D 的 Self 时间、Children 时间和 Total 时间。
本页面上的内容和代码示例受内容许可部分所述许可的限制。Java 和 OpenJDK 是 Oracle 和/或其关联公司的注册商标。
最后更新时间 (UTC):2026-03-06。
[null,null,["最后更新时间 (UTC):2026-03-06。"],[],[]]
