
记录 Java/Kotlin 分配有助于您识别可能会导致性能问题的不理想的内存模式。分析器可为您显示有关对象分配情况的以下信息:
- 分配了哪些类型的对象以及它们使用多少空间。
- 每个分配的堆栈轨迹,包括在哪个线程中。
- 对象被解除分配的时间。
您应记录正常条件和极端条件下用户交互期间的内存分配情况,从而准确识别您的代码是否在短时间内分配了过多对象,或所分配的对象是否出现了泄漏。 详细了解为什么应分析应用内存。
如何记录 Java/Kotlin 分配
如需记录 Java/Kotlin 分配情况,请从性能分析器的首页标签页中选择 Track Memory Consumption (Java/Kotlin Allocations) 任务。请注意,您需要使用可调试的应用(使用 Profiler:以可调试模式运行“app”(完整数据))来记录 Java/Kotlin 分配。
默认情况下,Android Studio 会捕获内存中的所有对象分配。如果您有一个分配了大量对象的应用,则可能会在分析时观察到应用的运行速度明显减慢。如需在进行性能剖析时提高性能,请前往内存分配跟踪下拉菜单,然后选择抽样,而不是完整。 在采样时,性能分析器会定期收集内存中的对象分配情况。
如需在录制时强制执行垃圾回收事件,请点击垃圾桶图标  。
。
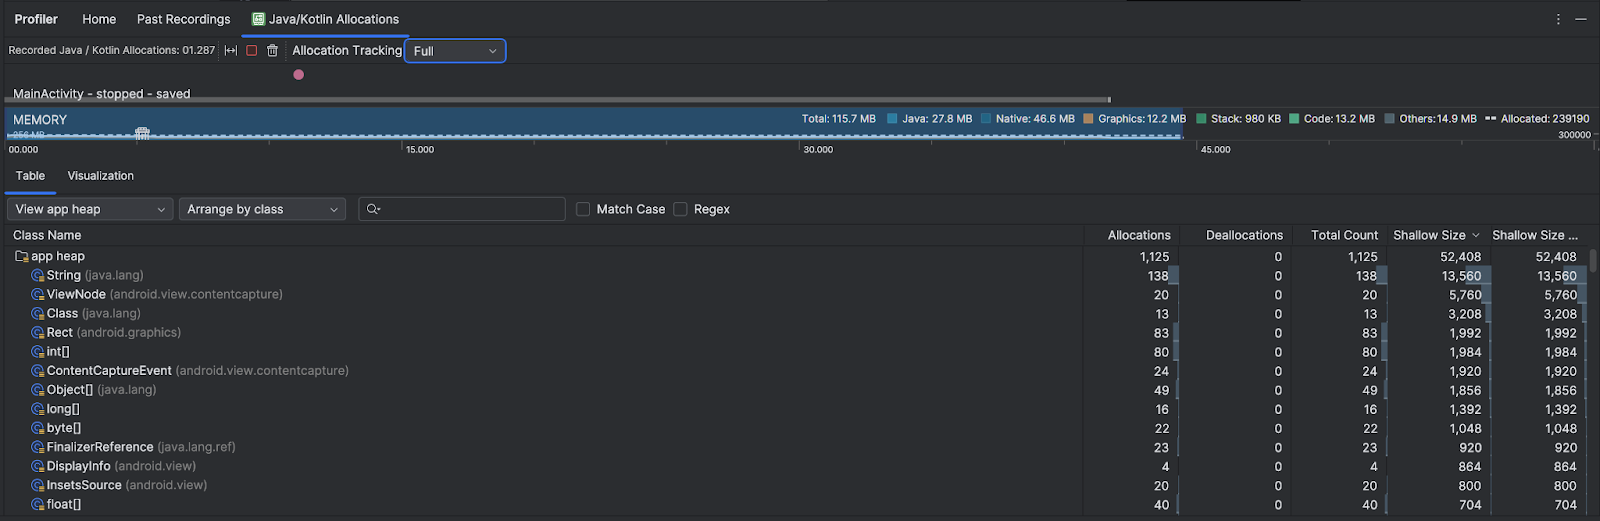
Java/Kotlin 分配概览
停止录制后,您会看到以下内容:
- 事件时间轴显示 activity 状态、用户输入事件和屏幕旋转事件。
- 内存使用量时间轴会显示以下信息。选择时间轴的某个部分可过滤到特定时间范围。
- 一个堆叠图表,显示每个内存类别当前使用多少内存,如左侧的 y 轴以及顶部的彩色键所示。
- 一条虚线,表示分配的对象数,如右侧的 y 轴所示。
- 每个垃圾回收事件的图标。
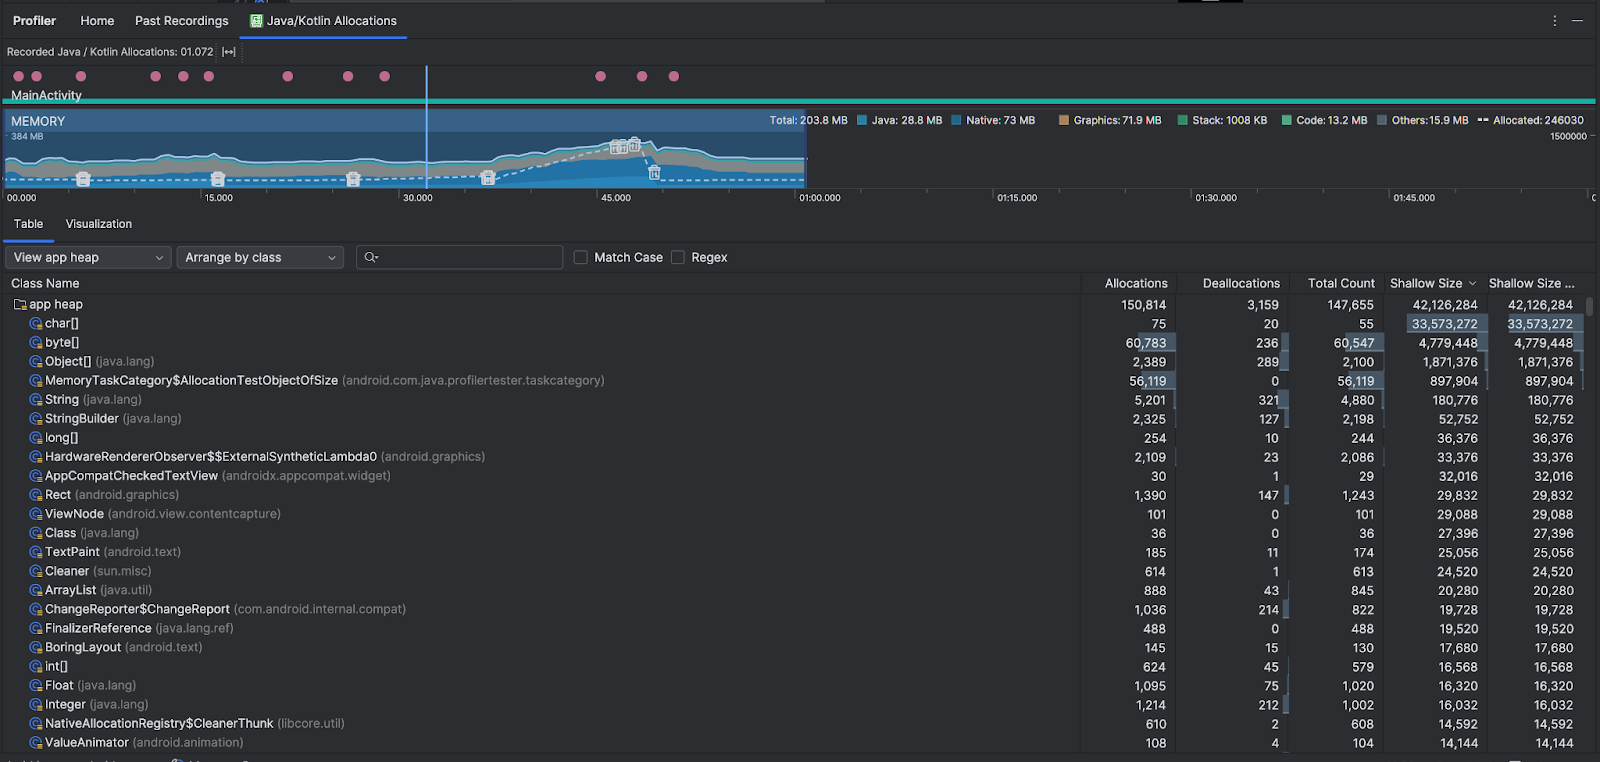
- 表格标签页会显示课程列表。Total Count 是所选时间范围结束时的分配数量(Allocations 减去 Deallocations),因此,先调试 Total Count 值最高的类可能比较合理。如果您更想根据所选时间范围内的峰值分配量对课程进行问题排查,请按分配量进行优先排序。同样,“Remaining Size”(剩余大小)是指“Allocations Size”(分配大小)减去“Deallocations Size”(释放大小)所得的结果,以字节为单位。
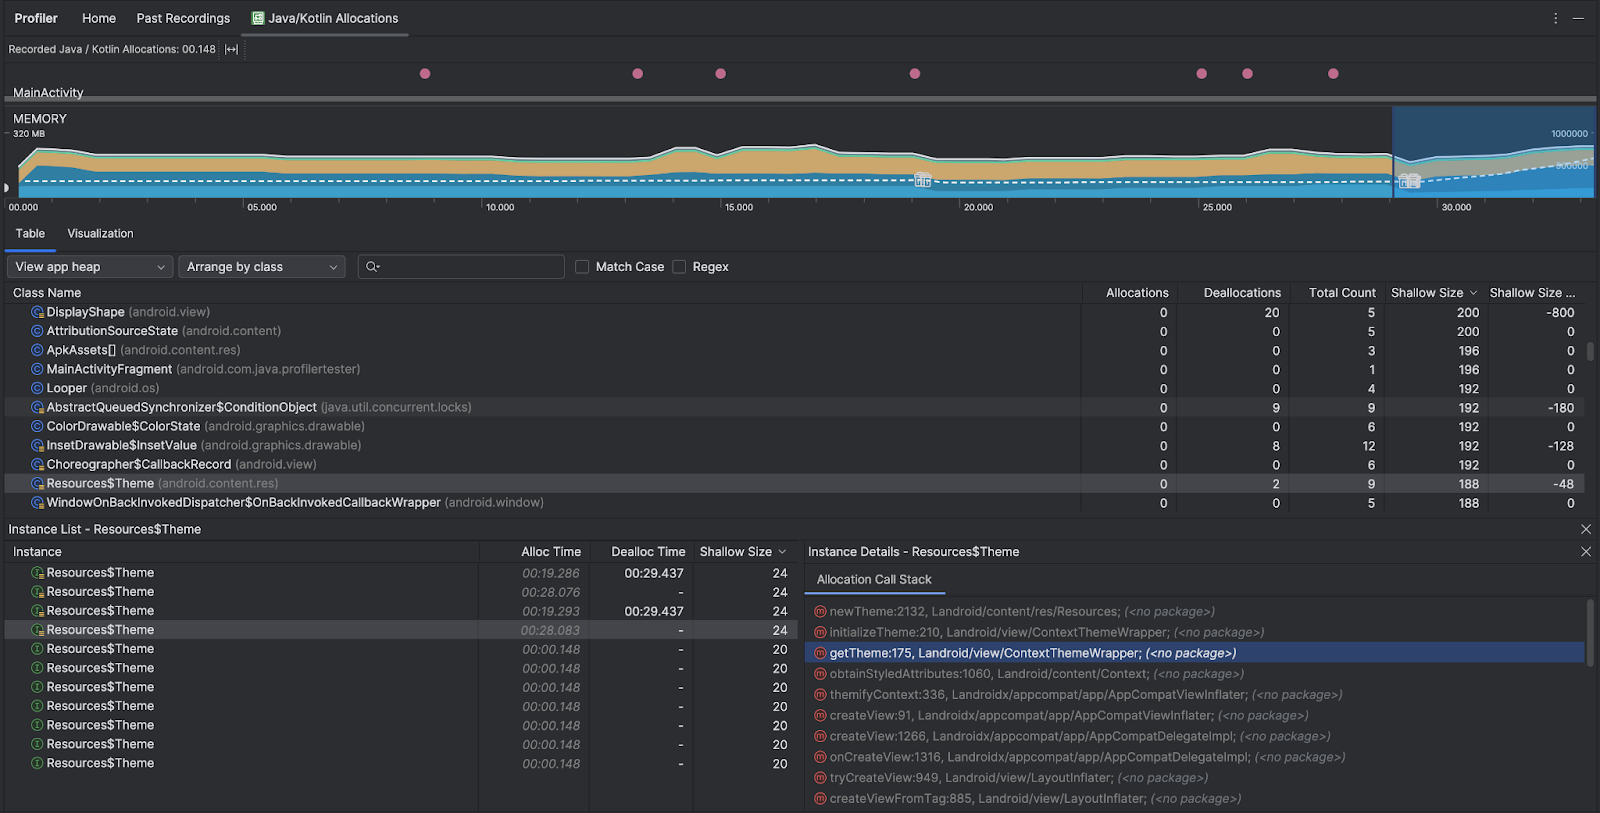
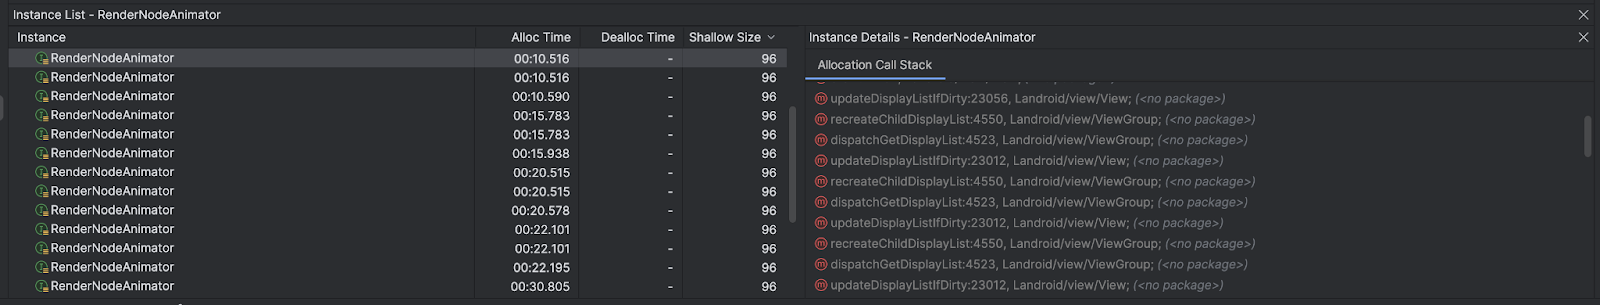
- 当您点击表格列表中的某个类时,系统会打开实例窗格,其中列出了关联的对象,包括它们的分配时间、取消分配时间以及浅层大小。
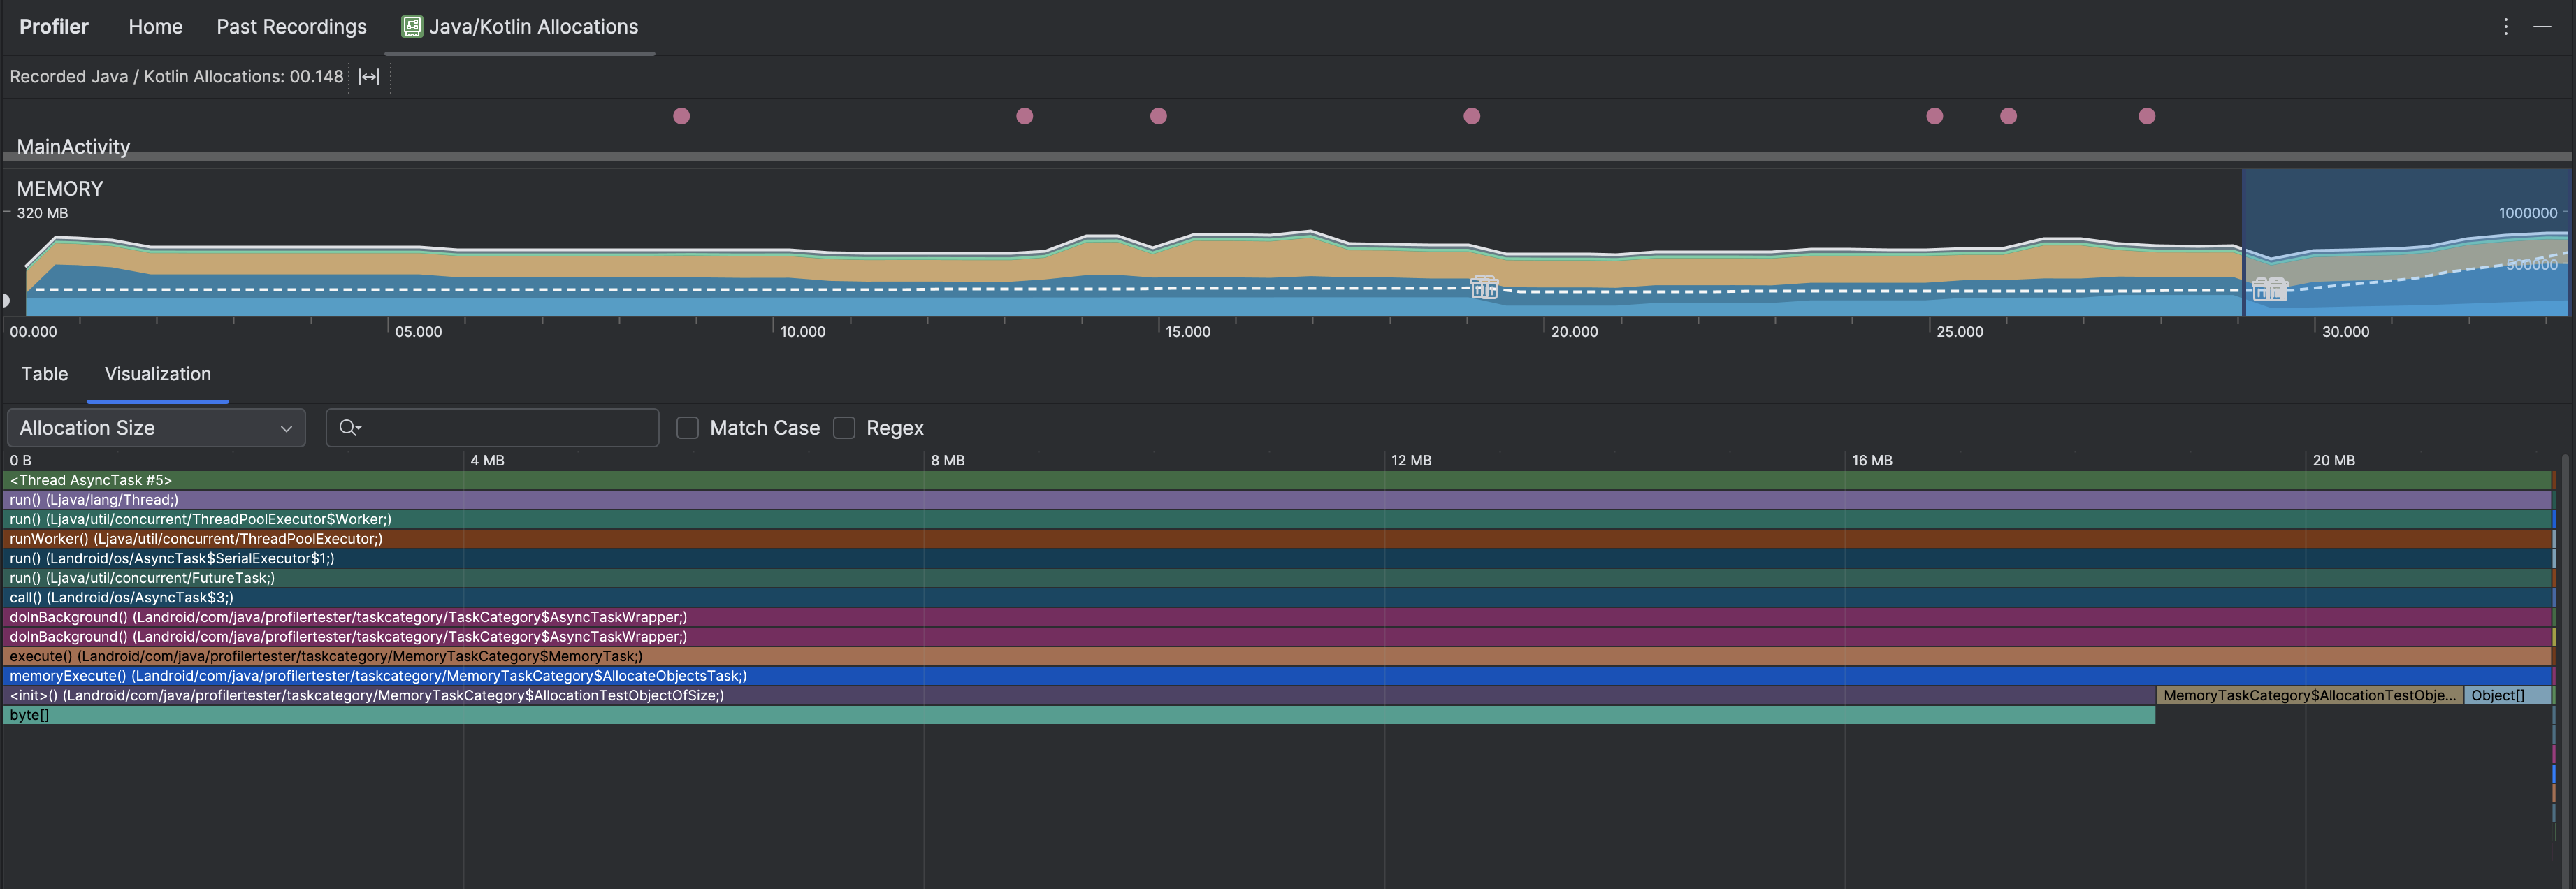
可视化标签页显示所选时间范围内调用堆栈中所有对象的汇总视图。它主要显示的是所显示的实例的调用栈占用的总内存量。第一行显示线程名称。默认情况下,对象会根据分配大小从左到右堆叠;您可以使用下拉菜单更改排序。
使用堆下拉菜单可过滤到特定堆。除了捕获堆转储时可用的过滤条件之外,您还可以过滤 JNI 堆中的类,该堆显示了 Java 原生接口 (JNI) 引用的分配和释放位置。
使用“安排”下拉菜单选择如何安排分配。除了捕获堆转储时可用的排列方式之外,您还可以按调用堆栈进行排列。
如何计算内存
您在顶部看到的数字基于您的应用根据 Android 系统机制所提交的所有私有内存页面。此计数不包含与系统或其他应用共享的页面。 内存计数中的类别如下:

- Java:从 Java 或 Kotlin 代码分配的对象的内存。
Native:从 C 或 C++ 代码分配的对象的内存。
即使您的应用中不使用 C++,您也可能会看到此处使用了一些原生内存,因为即使您编写的代码采用 Java 或 Kotlin 语言,Android 框架仍使用原生内存代表您处理各种任务,如处理图像资源和其他图形。
Graphics:图形缓冲区队列为向屏幕显示像素(包括 GL 表面、GL 纹理等等)所使用的内存。请注意,这是与 CPU 共享的内存,不是 GPU 专用内存。
Stack:您的应用中的原生堆栈和 Java 堆栈使用的内存。这通常与您的应用运行多少线程有关。
Code:您的应用用于处理代码和资源(如 DEX 字节码、经过优化或编译的 DEX 代码、.
so库和字体。Others:您的应用使用的系统不确定如何分类的内存。
Allocated:您的应用分配的 Java/Kotlin 对象数。此数字没有计入 C 或 C++ 中分配的对象。
检查分配记录
要检查分配记录,请按以下步骤操作:
- 在表格标签页中浏览类列表,找到分配或总数值(取决于您要优化的内容)异常大且可能存在泄漏的对象。
- 在 Instance View 窗格中,点击一个实例。系统会打开字段或分配调用堆栈标签页,具体取决于适用于相应实例的内容。使用字段或分配调用堆栈标签页中的信息,确定实例是否确实需要,或者是否是不必要的重复。
右键点击任意列表条目,即可跳转到相关源代码。
查看全局 JNI 引用
Java 原生接口 (JNI) 是一个框架,可让 Java 代码和原生代码相互调用。JNI 引用由原生代码进行管理,因此可能会出现以下问题:
- 原生代码使用的 Java 对象保持活动状态的时间过长。
- 如果丢弃了 JNI 引用而未先明确将其删除,Java 堆上的某些对象可能会变得无法访问。
- 全局 JNI 引用已达到上限。
如需排查此类问题,请在分析器中选择 View JNI heap 以浏览所有全局 JNI 引用,并按 Java 类型和原生调用堆栈对其进行过滤。在字段标签页中,右键点击某个实例字段,然后选择前往实例,即可查看相关的分配调用堆栈。
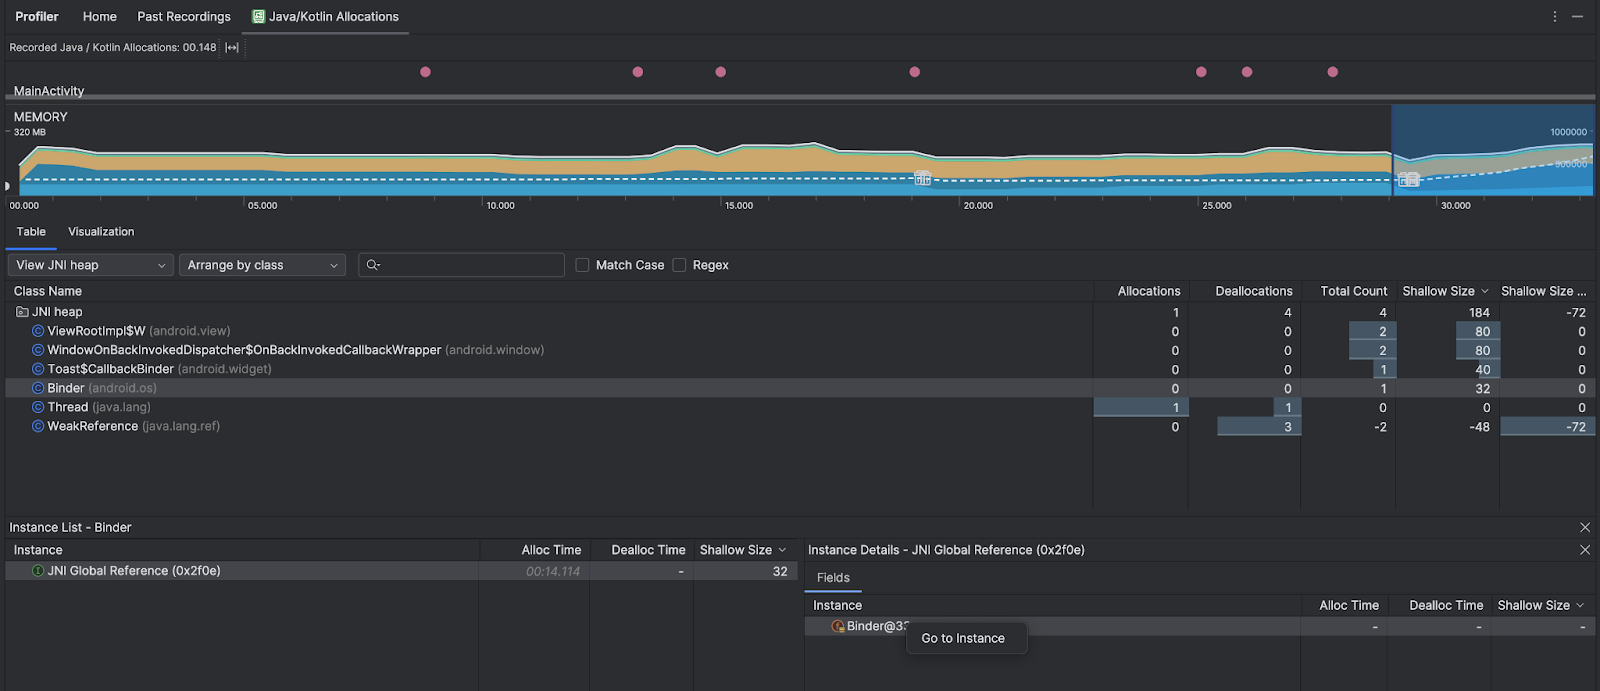
Allocation Call Stack 标签页会显示 JNI 引用在代码中分配和释放的位置。
如需详细了解 JNI,请参阅 JNI 提示。