
如果您正在编写原生代码,并且担心其内存用量,不妨分析应用的原生分配情况,看看是否有优化机会。
为什么应分析您的应用内存
Android 提供了托管内存环境 - 当 Android 确定您的应用不再使用某些对象时,垃圾回收器会将未使用的内存释放回堆中。虽然 Android 查找未使用内存的方式在不断改进,但对于所有 Android 版本,系统都必须在某个时间点短暂地暂停您的代码。大多数情况下,这些暂停难以察觉。不过,如果您的应用分配内存的速度比系统回收内存的速度快,则当回收器释放足够的内存以满足您的分配需要时,您的应用可能会延迟。此延迟可能会导致您的应用跳帧,使其明显变慢。
如需了解可减少应用内存使用量的编程做法,请阅读管理应用内存。
原生分配概览
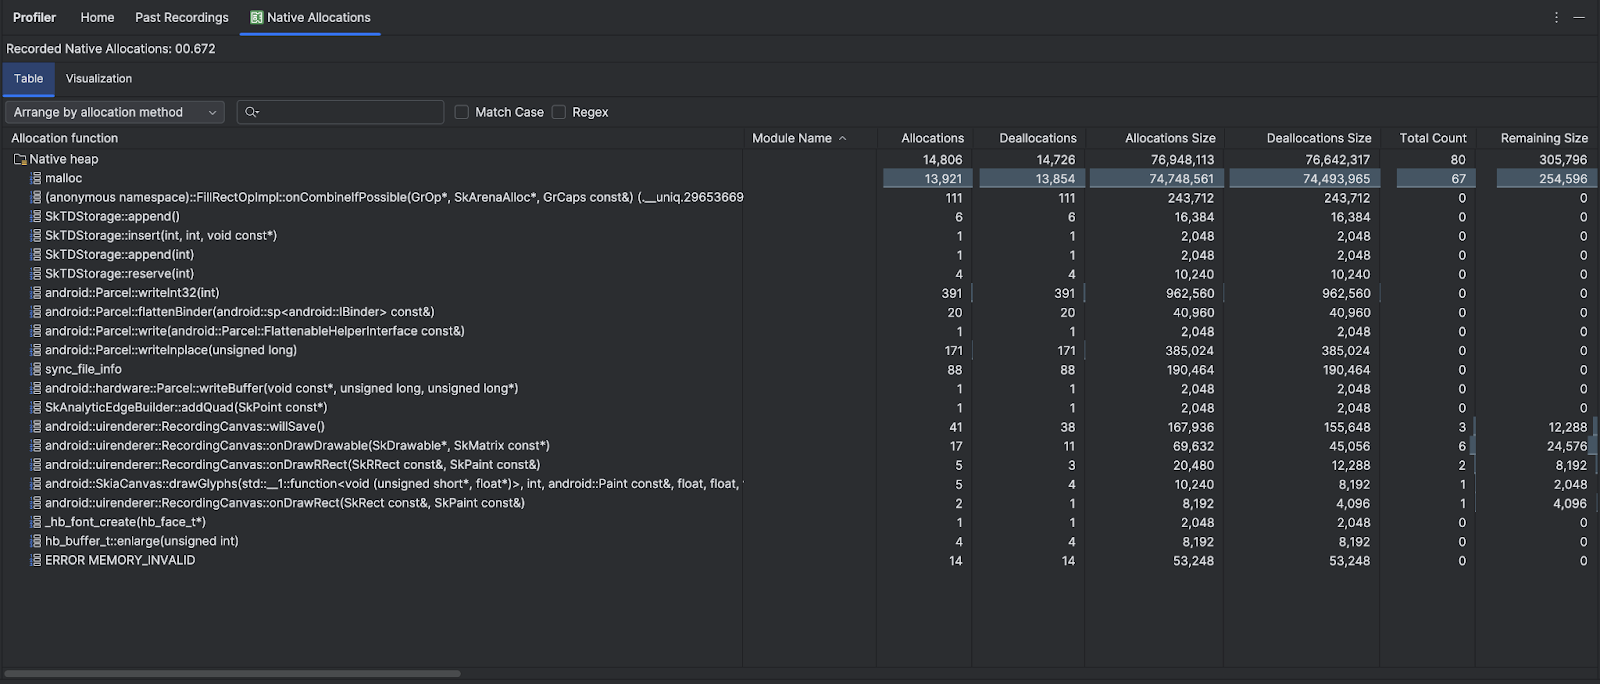
当您运行跟踪内存用量(原生分配)任务时,Android Studio 性能分析器会跟踪指定时间段内采用原生代码表示的对象的分配和解除分配情况,并提供以下信息:
- Allocations:在选定时间段内使用
malloc()或new运算符分配的对象数。 - Deallocations:在选定时间段内使用
free()或delete运算符解除分配的对象数。 - Allocations Size:在选定时间段内所有分配的总大小(以字节为单位)。
- Deallocations Size:在选定时间段内所有已释放内存的总大小(以字节为单位)。
- Total Count:Allocations 列中的值减去 Deallocations 列中的值所得的结果。
- Remaining Size:Allocations Size 列中的值减去 Deallocations Size 列中的值所得的结果。
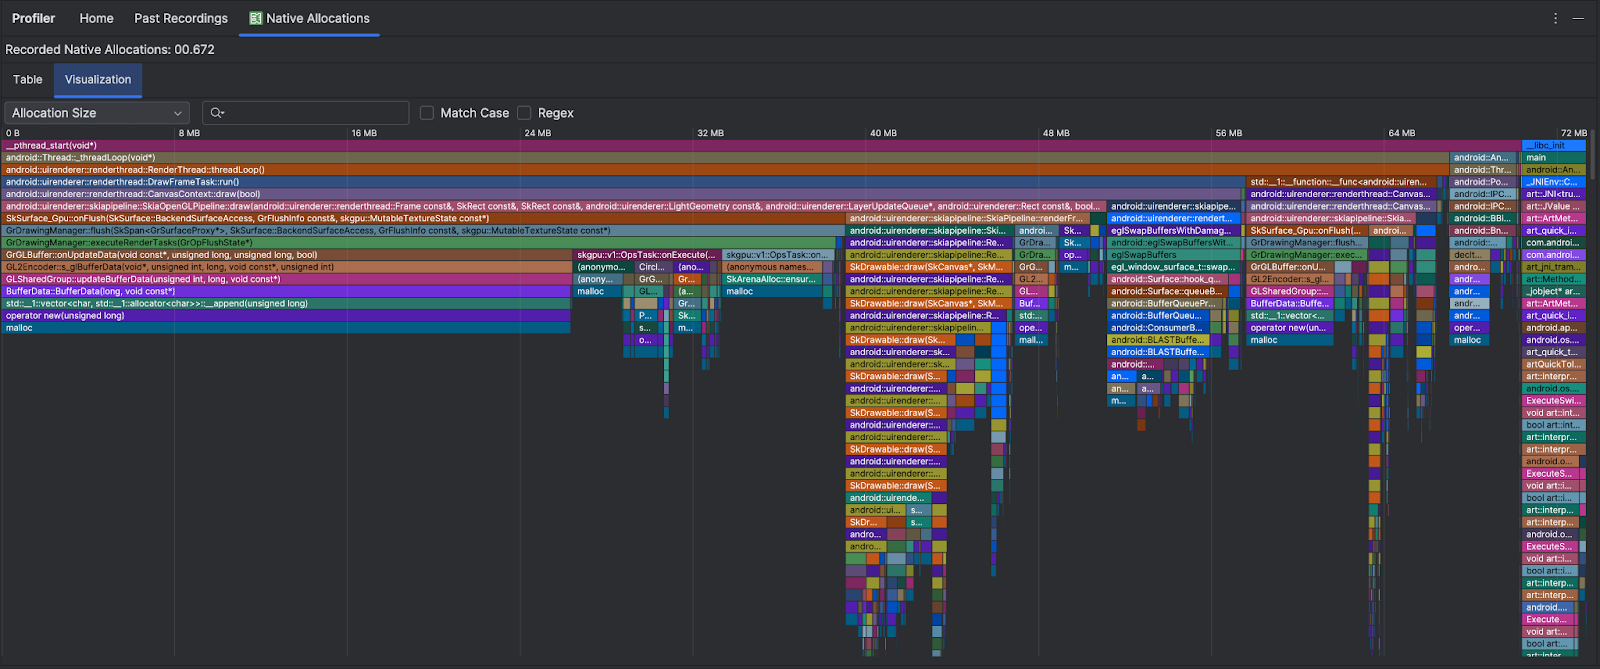
可视化标签页会显示所选时间范围内调用堆栈中与原生代码相关的所有对象的汇总视图。它本质上显示的是包含所示实例的调用堆栈所占用的总内存量。第一行显示线程名称。默认情况下,对象会按分配大小从左到右堆叠;您可以使用下拉菜单更改排序。
默认情况下,性能分析器使用的采样大小为 2048 个字节:每次分配 2048 个字节的内存时,系统都会截取内存的快照。示例规模越小,快照越频繁,从而产生更准确的内存用量数据。示例规模越大,数据的准确性越差,但占用的系统资源越少,因此录制时的性能就越高。如需更改采样大小,请参阅修改录制配置。