
调用堆栈有助于识别 CPU 热点,即执行时间较长的代码段。调用堆栈有助于您了解已执行代码的哪个部分,以及调用这些代码的原因。
调用栈样本概览
如需对调用栈进行抽样,请从 Android Studio 性能分析器的 Home 标签页中选择 Find CPU Hotspots (Callstack Sample) 任务。解析记录后,您会看到以下视觉效果:
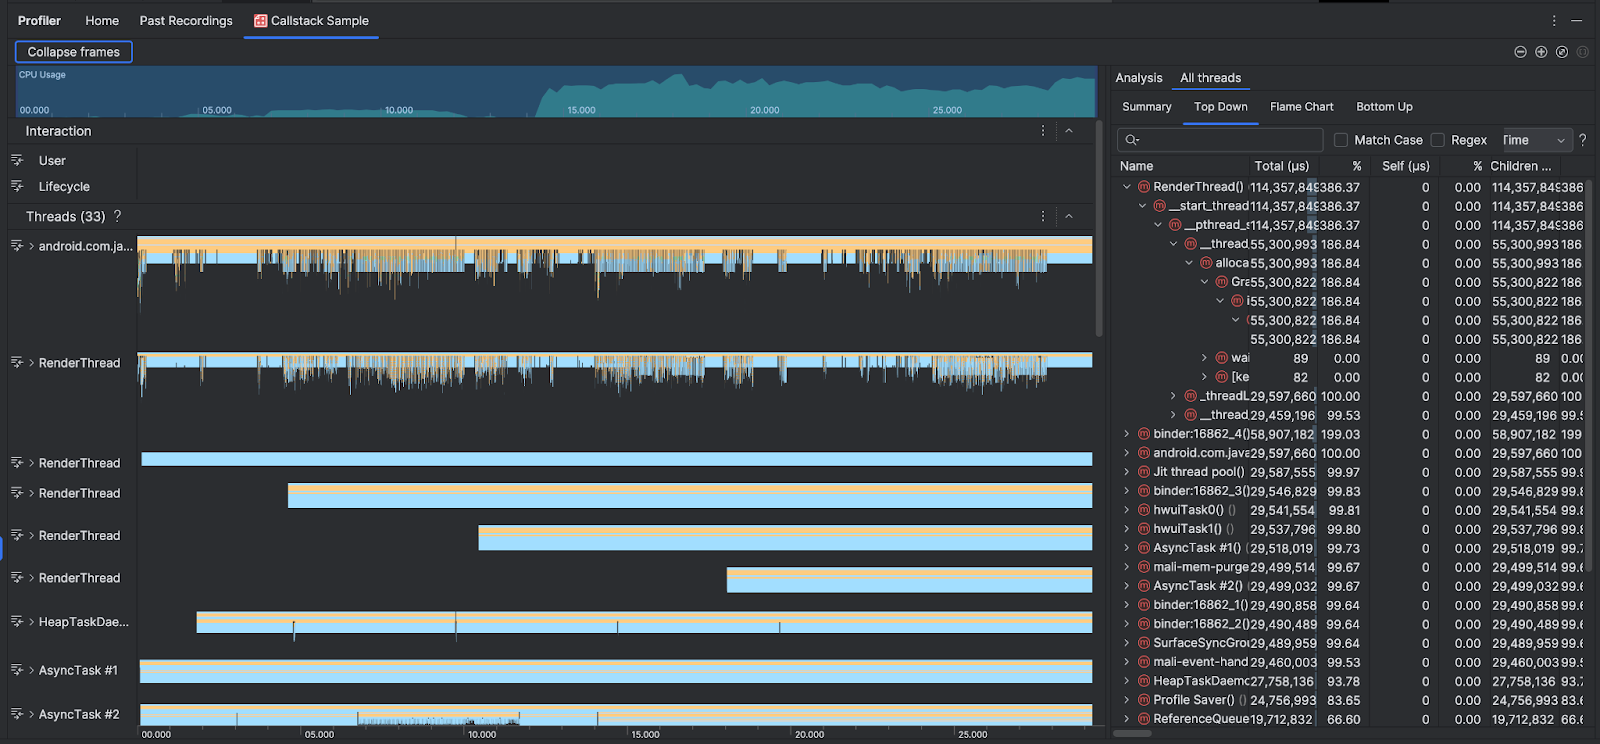
为了补充 CPU 使用情况和互动时间轴,线程部分会显示应用和系统发出的每个调用的帧。以下是有关如何浏览调用堆栈示例的一些提示:
- 展开感兴趣的线程,然后使用键盘快捷键浏览堆栈帧。点击某个堆栈帧,即可在分析窗格中获取有关相应事件和相关调用的详细信息。
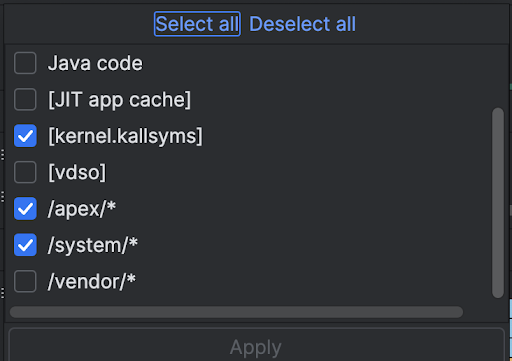
- 如需过滤到特定类型的堆栈帧,请点击收起帧,然后选中要隐藏的帧类型。折叠帧会将其从线程和分析部分中移除。根据您的调查,您可能需要收起来自 Java 虚拟机(例如
android::AndroidRuntime::start和art::{...})和系统内核(例如[kernel.kallsyms]+{offset})的帧。通常,这对应于收起与[kernel.kallsyms]、/apex/和/system/*相关的帧。
由于 Java/Kotlin 程序通常通过 Java 虚拟机执行,因此当 Android Studio 为 Java/Kotlin 程序收集调用堆栈时,调用堆栈通常不仅包含 Java/Kotlin 代码,还包含运行程序本身以及程序与系统和硬件通信所需的原生代码。
- 如需跳转到与堆栈帧关联的源代码,请右键点击相应帧,然后点击 Jump to source。
- 如需在事件表格中突出显示与事件关联的堆栈帧,请点击相应事件。
使用命令行的原生代码示例
在内部,Android Studio 使用 simpleperf 跟踪应用的原生代码。如果您想为 Simpleperf 指定其他选项,例如对特定设备 CPU 进行采样或以高精度指定采样时长,可以从命令行使用 simpleperf。