
对于部署到搭载 Android 9 或更高版本的设备的应用,Process Memory (RSS) 部分会显示应用使用的物理内存量。
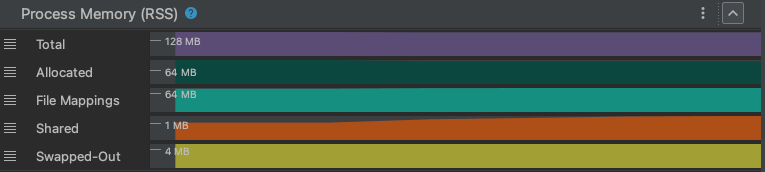
图 1. 在性能分析器中查看物理内存。
进程内存 (RSS) 部分中各行的含义如下:
总计:这是您的进程使用的物理内存总量。在基于 Unix 的系统上,这被称为“驻留集大小”,是匿名分配、文件映射和共享内存分配所使用的所有内存的组合。
对于 Windows 开发者,驻留集大小类似于工作集大小。
已分配:此计数器跟踪进程的正常内存分配目前占用了多少物理内存。这些分配均匿名(不由特定文件支持)且不公开(不共享)。在大多数应用中,这由堆分配量(使用
malloc或new)和堆栈内存组成。从物理内存中换出时,这些分配会写入系统交换文件。文件映射:此计数器会跟踪进程用于文件映射的物理内存量,也就是说,通过内存管理器从文件映射至内存区域的内存。
共享:此计数器跟踪在此进程和系统中其他进程之间共享的内存所用的物理内存量。