
システム トレースでは、システム全体のアクティビティとリソース使用量が表示されるため、アプリのプロセスがどのようにスケジュールされ、実行されているかを確認できます。Android Studio Profiler のシステム トレース ビューは、一般的に次の調査に使用されます。
- アプリプロセスとシステム プロセスがデバイスのコアとスレッドにどのように分散されているか。
- UI のレンダリングの滑らかさ。
- デバイスとアプリの両方のレベルでの電力使用量。
このページでは、システム トレース ビューで最も一般的に使用されるビジュアルの概要について説明します。ここに記載されていない可視化について詳しくは、グラフの用語集をご覧ください。システム トレースの用途について詳しくは、このセクションの他のページをご覧ください。
システム トレースを記録すると、タイムライン上に次の可視化が表示されます。さまざまなシステム リソースがどのように関連しているかに注目する必要があります。たとえば、モデムのパワーレールでスパイクが発生した場合は、スレッド セクションに移動して、その時点でスパイクの原因となっている可能性のあるスレッド アクティビティを確認する必要があります。
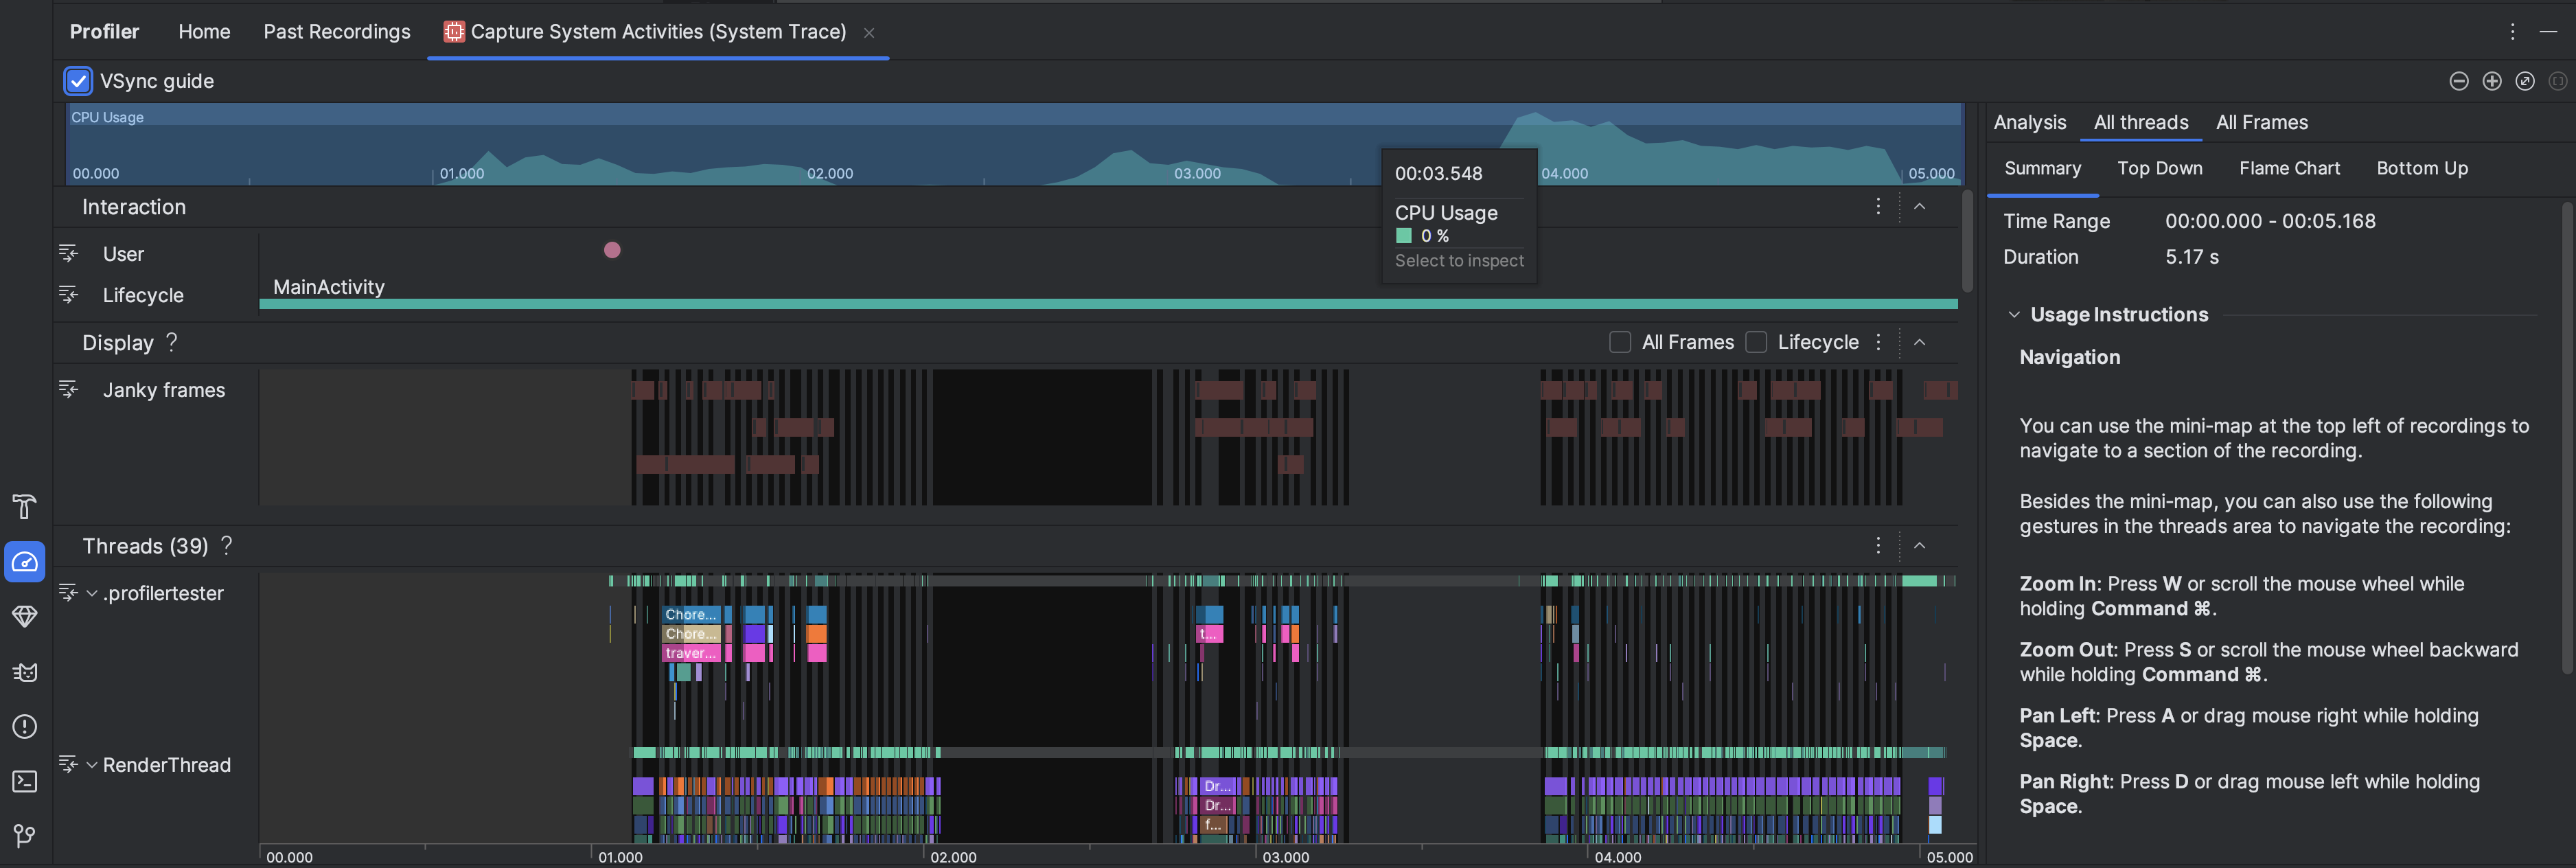
- CPU 使用率: アプリの CPU 使用率を、利用可能な合計 CPU 容量に対する割合で時間ごとに示します。タイムラインの一部をハイライト表示して、その期間の詳細をフィルタします。
- インタラクション: タイムラインでのユーザー インタラクション イベントとアプリ ライフサイクル イベントが表示されます(デバッグ可能なアプリプロセスと API レベル 26 以降を搭載したデバイスが必要です)。
- ディスプレイ: アプリの UI がどれだけスムーズにレンダリングされるかに関する情報が表示されます。[ライフサイクル] を選択して、アプリがメインスレッドと
RenderThreadで各フレームをレンダリングする際にかかる時間を調べます。この情報は、UI ジャンクや低フレームレートの原因となるボトルネックを調査する際に役立ちます。 Threads: アプリとさまざまなシステム プロセスが実行するスレッドを表示します。システム トレースを使用して UI ジャンクを調査または減らす方法については、UI ジャンクを検出するをご覧ください。
ヒント: Threads タイムラインを調べるときは、次のショートカットを利用できます。- ズームイン: Ctrl キー(macOS の場合は Command キー)を押しながら、W キーを押すかマウスホイールをスクロールします。
- ズームアウト: Ctrl キー(macOS の場合は Command キー)を押しながら、S キーを押すかマウスホイールを後方にスクロールします。
- 左にパン: A キーを押すか、Space キーを押しながらマウスを右にドラッグします。
- 右にパン: D キーを押すか、Space キーを押しながらマウスを左にドラッグします。
- スレッドを開くまたは閉じる: スレッドを選択して、スレッド名をダブルクリックするか Enter キーを押します。
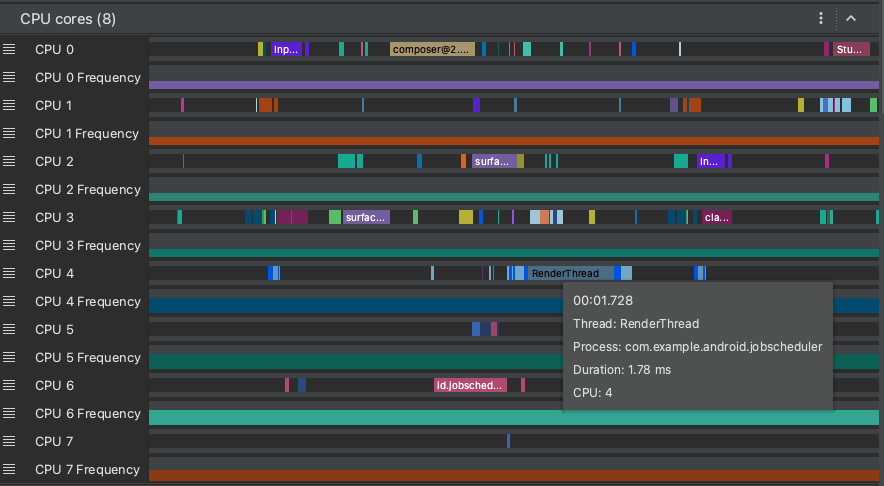
CPU コア: デバイスの各コアのアクティビティを表示します。コア別のアクティビティを表示すると、どのコアが最新のモバイル プロセッサの「big」コアまたは「little」コアであるかを把握できます。スレッド アクティビティにポインタを合わせると、そのコアが動作しているスレッドを確認できます。
Process Memory (RSS): アプリが現在使用している物理メモリの量が表示されます。詳しくは、グラフの用語集をご覧ください。
Power Rails: 物理デバイスでプロファイリングを行うと表示されます。詳しくは、電力使用量を調べるをご覧ください。
バッテリー: アプリのバッテリー使用量が表示されます。