
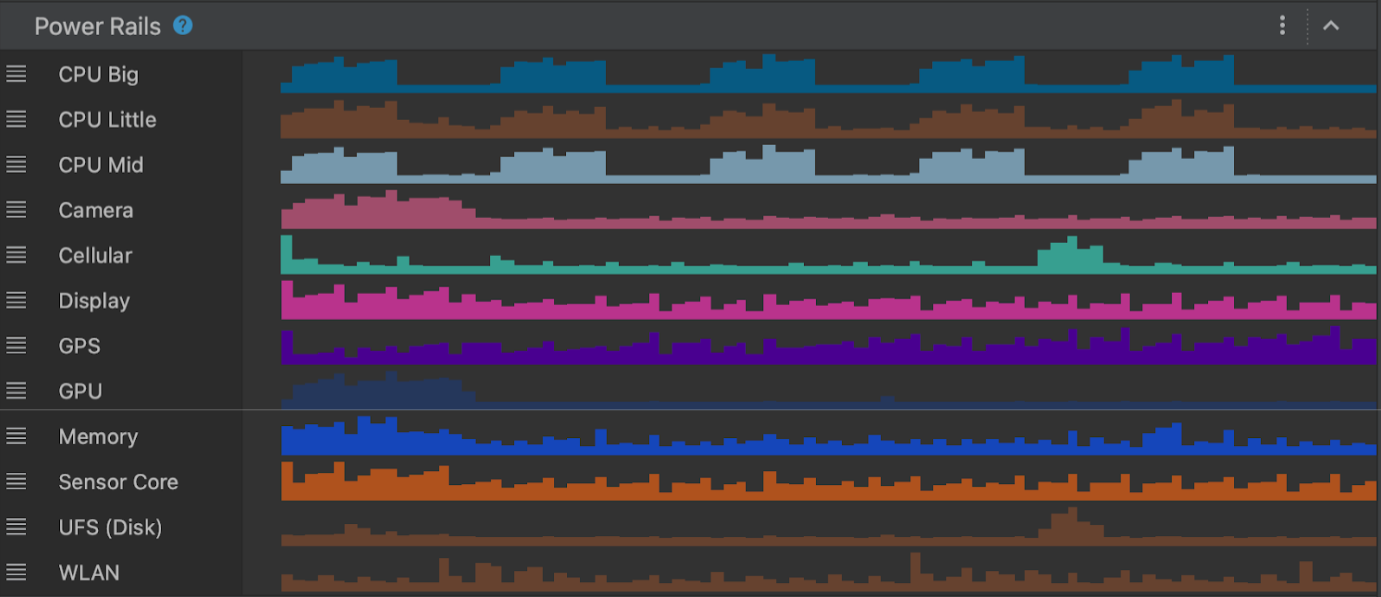
从 Android Studio Hedgehog 开始,功耗性能分析器会显示设备上的功耗。您可以在设备端功耗管理器 (ODPM) 中查看这些新数据。它会按名为“Power Rails”的子系统细分相关信息。如需查看受支持的子系统列表,请参阅可分析电源轨。
System Trace 用于记录并显示功耗数据。它是 CPU 性能分析器的一部分。这些数据有助于您直观地将设备的功耗与应用中发生的操作相关联。借助功耗性能分析器,您可以直观地了解这些数据。
可分析电源轨
ODPM 可报告所有可分析电源轨,适用于 Android 10(API 级别 29)及更高版本,以及 Pixel 6 及之后推出的 Pixel 设备。
| 电源轨名称 | 说明 |
|---|---|
| CPU Big | 大 CPU 核心的功耗。 |
| CPU Little | 小 CPU 核心的功耗。 |
| CPU Mid | 中 CPU 核心的功耗。 |
| Camera | 摄像头传感器的功耗。 |
| Cellular | 移动网络传感器的功耗。 |
| Display | 显示屏的功耗。 |
| GPS | GPS 传感器的功耗。 |
| GPU | GPU 传感器的功耗。 |
| Memory | RAM 内存传感器的功耗。 |
| Sensor core | 其他设备传感器的功耗。 |
| UFS (disk) | 磁盘传感器的功耗。 |
| Wi-Fi | Wi-Fi 传感器的功耗。 |
不支持 ODPM 的设备可以通过库仑计和电池电量计提供功耗数据。
| 名称 | 说明 |
|---|---|
| Capacity | 剩余电量百分比 (%)。 |
| Charge | 剩余电量,以微安小时 (μAh) 为单位。 |
| Current | 瞬时电流,以微安 (μA) 为单位。 |
通过功耗性能分析器分析功耗的场景示例
假设您正在构建一款应用,此应用需要通过网络下载资源。您想要了解单独下载各个资源与以大分块的形式下载这些资源相比,Wi-Fi 电源轨的功耗有何变化。
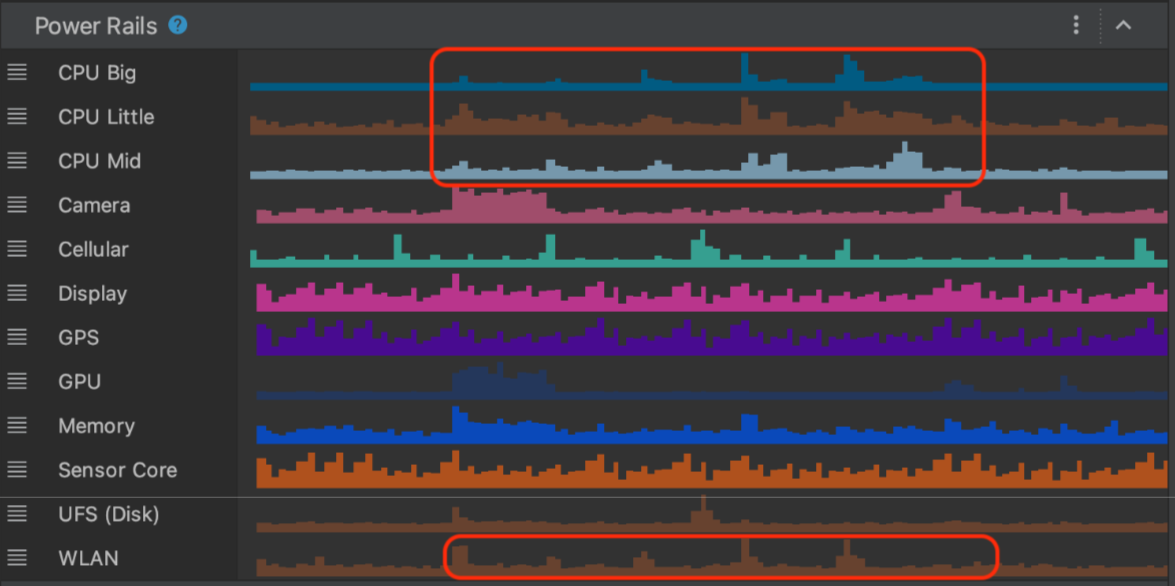
场景 A:应用发出单独的网络请求,要求通过 Wi-Fi 下载资源。
场景 B:应用发出一个网络请求,要求通过 Wi-Fi 下载一个超大资源。
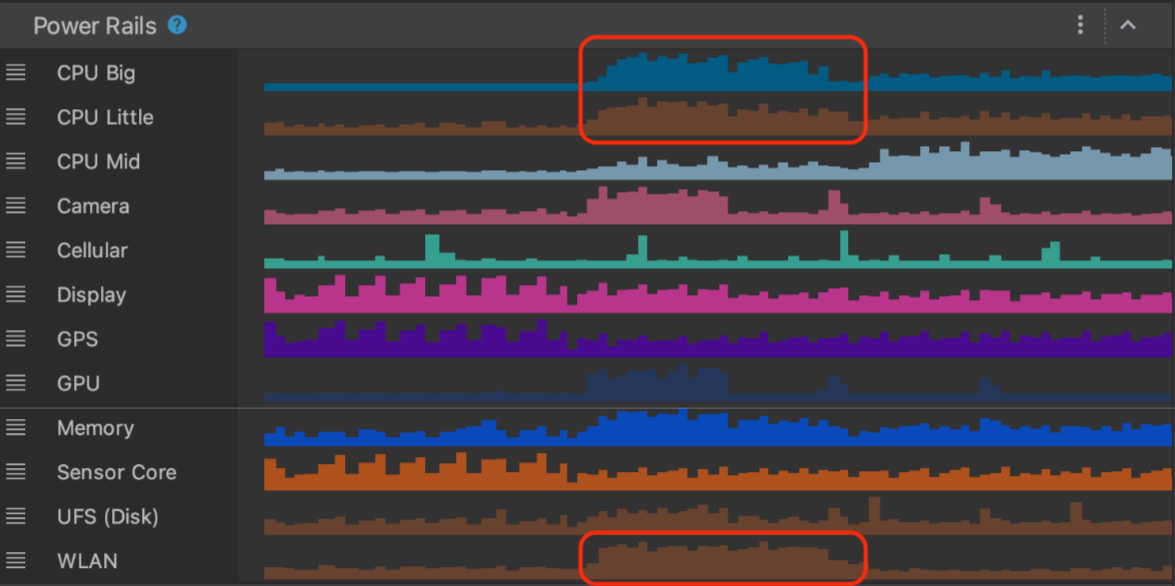
如以上场景所示,这两条系统轨迹将根据您触发下载的方式来显示 Wi-Fi 电源轨中的不同功耗特征。
虽然以上示例只是一种用于在不同场景下测量功耗的简单方法,但它展示了相关流程,您可以据此为您的应用构建更复杂的 A/B 测试。您可以利用这些测试针对不同功能或同一功能的不同实现来降低功耗。
重要提示
- ODPM 测量的是设备一级的功耗,并不特定于任何应用。您可以将 ODPM 中的功耗信息与应用前台或后台发生的情况关联起来。因此,您可以根据读取 ODPM 数据时设备中处于活动状态的应用数量来预计功耗数据中的噪声数据。
- 功耗性能分析器可以读取来自 ODPM 的功耗数据,ODPM 仅适用于搭载 Android 10(API 级别 29)及更高版本的 Pixel 6 及之后推出的 Pixel 设备。
- 某些电源轨可能仅适用于部分实现了 ODPM 的设备。