
请按照此页面上的步骤完成 bug 报告。由于可用于修复 bug 的资源有限,因此我们会优先修复具有完整相关信息的 bug。信息不完整的 bug 报告会被关闭。如果发生这种情况,您可提供补充信息并重新提交 bug 报告。
为避免您就已得到修复的 bug 提交报告,请确保您使用的是最新版本的工具。您还可以在 Android Studio 问题跟踪器上搜索类似问题,看看是否已经有人报告过您遇到的问题。
如何报告 bug
若要报告 bug,请按以下步骤操作:
如需在 Android Studio 中打开 bug 报告,请依次选择 Help > Submit a Bug Report。
这是重现 bug 最简单的方法,因为此方法会使用您的 Android Studio 版本、Kotlin 或 Java 版本和系统信息来填充 bug 报告,而这些正是正确重现问题所需的信息。
您也可以在此处提交 bug,并自行添加版本信息。
请附上诊断报告,以便我们调试您的问题。如需生成诊断报告 ZIP 文件,请依次点击 Help > Collect Logs and Diagnostic Data。
描述重现问题的确切步骤。请提交尽可能多的信息,包括代码段、可用于重现 bug 的 GitHub 项目、可展现您观察到的问题的屏幕截图或录制内容。
详细描述问题。请描述您期望发生的结果以及实际观察到的结果。
为 bug 报告取一个描述性的标题。使用更具描述性的标题便于按问题分类。
对于某些 bug,我们需要更多信息,详见如下部分:
Android Studio bug 详细信息
若要报告针对 Android Studio 的 bug,请附上本部分中所述的其他信息。
如果 IDE 挂起
如果 IDE 本身运行非常缓慢或完全停滞,请按本页所述的方法生成几个线程转储并将它们附加到 bug 报告中。这些线程转储会显示 IDE 正在执行哪些操作导致其运行变慢。
如果 IDE 运行缓慢但未停滞,请在 bug 报告中附加 idea.log 文件。如需附加该文件,请依次选择 Help > Collect Logs and Diagnostic Data 或 Help > Show Log in Files(在 macOS 上,请依次选择 Help > Show Log in Finder)。此文件会显示 IDE 是否持续将错误抛出到日志中。
使用 CPU 配置文件诊断速度缓慢问题
如果您在 Android Studio 中遇到运行缓慢的问题,CPU 配置文件有时可以帮助您诊断问题。
若要使用 Android Studio 的 Performance Testing 插件捕获 CPU 配置文件,请按以下步骤操作:
安装该插件。
- 在 Android Studio 插件市场中搜索“Performance Testing”。
- 或者,您也可以从插件网站下载与 Android Studio 兼容的插件版本。
创建 CPU 配置文件。
- 当 Android Studio 运行缓慢时,选择 Start CPU Usage Profiling。
- 重复执行一些有延迟问题的操作(代码补全、输入和等待突出显示更新内容等)。
- 点击 Stop CPU Usage Profiling。
共享该配置文件。
此时系统会显示一个提示框,其中会提供 CPU 快照文件名,文件名遵循以下格式:
snapshot-NNN。在 bug 报告中共享该快照文件。
如果 IDE 耗尽内存
Android Studio 中的内存问题有时难以重现和报告。为帮助解决此问题,Android Studio 提供了内存使用情况报告,您可以将此报告发送给 Android Studio 团队,以帮助确定内存问题的来源。
运行内存使用情况报告
若要运行内存使用情况报告,请按以下步骤操作:
在菜单栏中依次点击 Help > Analyze Memory Usage。
Android Studio 将转储相应的堆并提示您重启 IDE。如果重启 IDE,堆转储分析会立即开始。否则,堆转储分析会在您下次运行 Android Studio 时开始。无论哪一种情形,IDE 都会在内存使用情况报告可供查看时通知您,如图 1 所示。
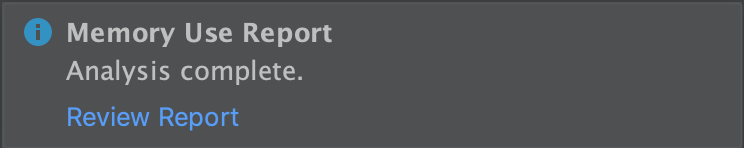
图 1. 内存使用情况报告的通知。 点击 Review Report。
在发送报告之前,您可以查看其中包含的信息:
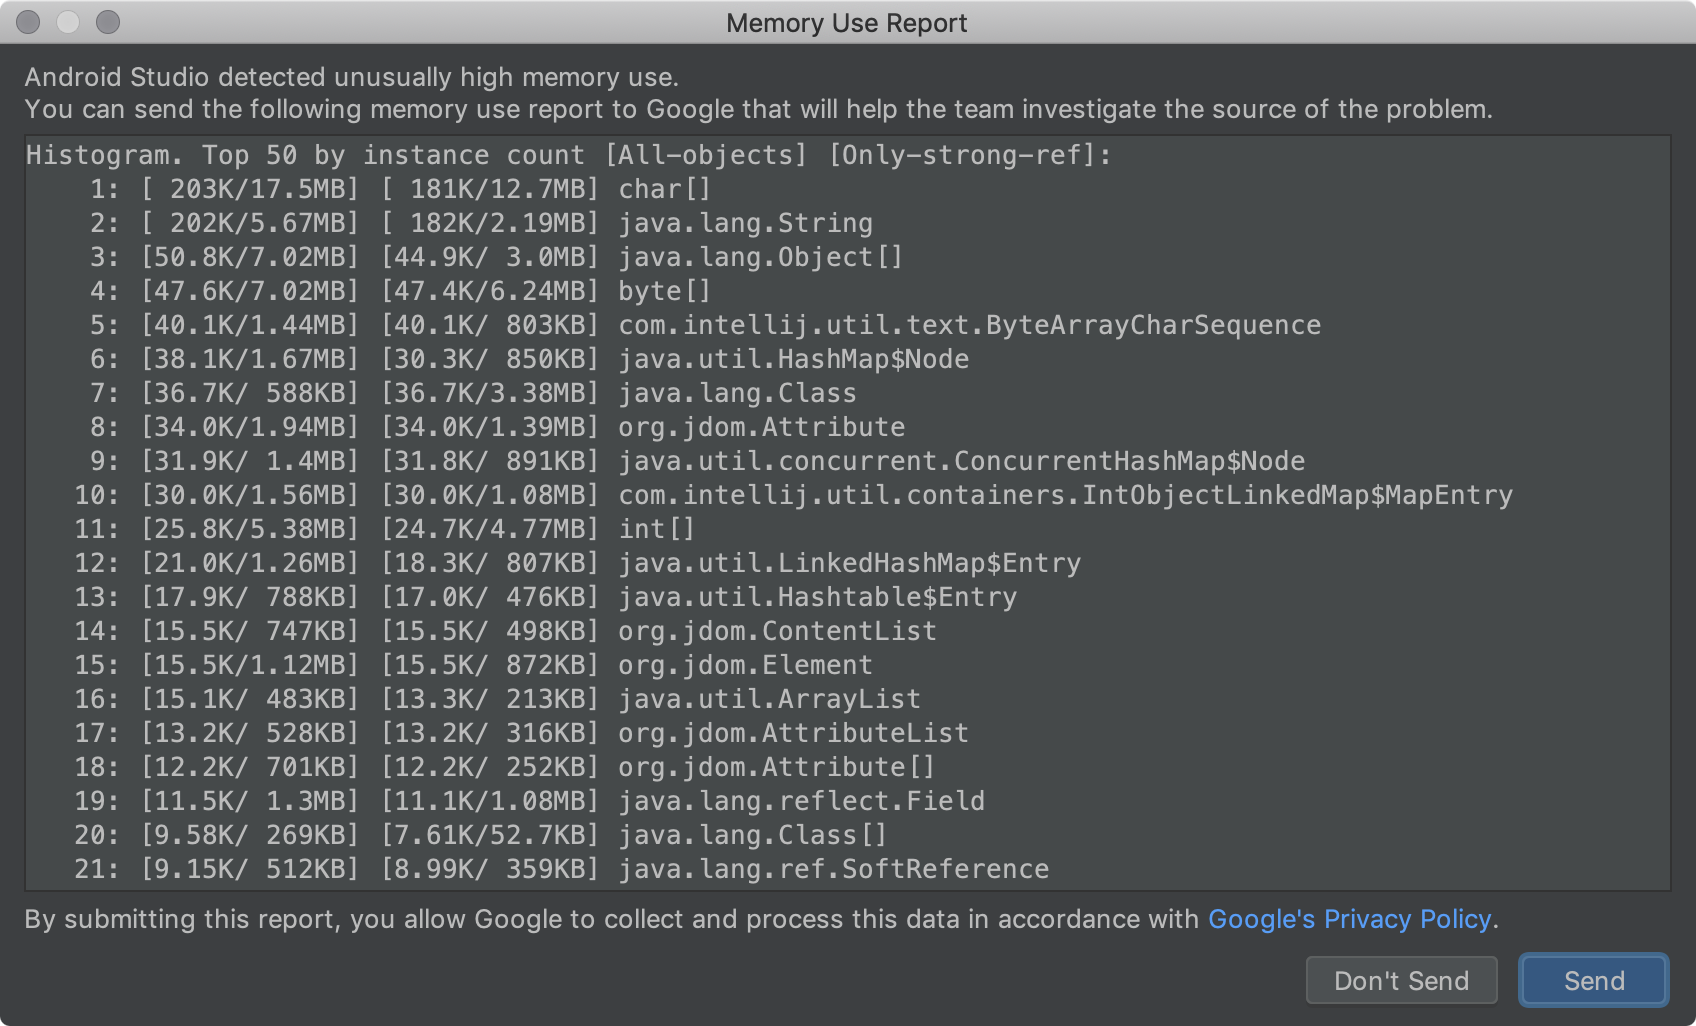
图 2. 对内存使用情况报告的分析。 查看完毕后,将报告内容复制并粘贴到文件中,并在提交 bug 时附加该文件。
通过这种方式提交报告信息,可确保 Android Studio 团队能够在调查您的内存问题时使用问题跟踪器与您沟通。
如果 IDE 崩溃或抛出异常
对于其他类型的崩溃,请附加通过以下方法找到的 idea.log 文件:依次选择 Help > Collect Logs and Diagnostic Data,或者 Help > Show Log in Files(在 macOS 上,请依次选择 Help > Show Log in Finder)。
生成线程转储
线程转储是 JVM 中运行的所有线程的输出。对于每个线程而言,线程转储是所有堆栈帧的输出。这样您就可以轻松查看 IDE 的实时动态,尤其是在间隔几秒就生成若干线程转储的情况下。
在您报告 IDE 异常忙碌导致 CPU 超负荷运行或 IDE 似乎停滞的 bug 后,线程转储可以准确找出是哪个代码正在执行大量作业,或哪些线程正在争用资源,导致死锁。
JDK 附带一个名为“jstack”的工具,该工具可用于生成线程转储。首先,查找该 Android Studio 进程的进程 ID (PID)。为此,请使用 jps 命令:
在 Linux 或 macOS 上:
jps -mv | grep studio
在 Windows 上:
jps -mv | findstr studio
此操作将输出一行很长的代码,如下所示:
$ jps -mv | grep studio
37605 -Dfile.encoding=UTF-8 -ea -Dsun.io.useCanonCaches=false -Djava.net.preferIPv4Stack=true -Djna.nosys=true ...
第一个数字(在本例中为 37605)是进程 ID。
然后,生成线程转储,并将其保存到 dump.txt 文件中,运行的命令如下:
jstack -l pid >> dump.txt
如果此方法不起作用,您可以尝试其他一些针对特定平台的方式来生成线程转储。如需了解详细说明,请参阅 IntelliJ 支持。
构建工具和 Gradle bug 详细信息
若要针对构建工具或 Gradle 报告 bug,请附加可演示问题的实际项目或示例项目,以确保捕获所有需要的信息。分享项目之前,请移除所有敏感信息。
如果无法分享项目,请注明所用工具的版本(请尝试使用最新稳定版或最新预览版,然后再报告 bug)。若要查找工具版本,请执行以下操作:
Android Gradle 插件版本:
- 依次选择 File > Project Structure。
- 点击 Project。
- 找到 Android Gradle Plugin Version。
Gradle 版本:
- 依次选择 File > Project Structure。
- 点击 Project。
- 找到 Gradle Version。
Android Studio 版本:
- 依次选择 Help > About。
- 找到 Android Studio Version。
此外,请添加以下信息(如适用):
- 如果某个行为意外将工具从较低版本更改为当前版本,请注明这两个版本。
- 如果 build 失败并出现错误,请使用
--stacktrace选项(例如./gradlew <task> --stacktrace)从命令行运行该 build,并在 bug 报告中提供堆栈轨迹。 - 如果 build 用时超出了预期,请尝试执行以下任一操作:
- 运行
./gradlew <task> --scan并在 bug 报告中分享生成的 Gradle build 扫描结果。 - 运行
./gradlew <task> -Pandroid.enableProfileJson=true,然后分享<root-project>/build/android-profile目录下生成的 Chrome 跟踪记录文件。
- 运行
Android 模拟器 bug 详细信息
若要使用该模拟器的扩展控件收集信息并提交 bug,请按以下步骤操作:
- 在模拟器面板中,点击 More 图标
 。
。 在 Extended controls 窗口中,选择 Bug Report。
执行此操作会打开一个界面,其中显示 bug 报告详细信息,例如屏幕截图、AVD 配置信息和 bug 报告日志。您可以在此处输入重现 bug 的步骤,也可以先等一下,稍后将其输入到下一步生成的报告中。
等待 bug 报告完成收集,然后点击 Send to Google。
此时系统将打开一个窗口,供您将 bug 报告保存在文件夹中。您的浏览器也会打开,以在 Google 问题跟踪器中创建一个报告,其中填充有必要的模拟器详细信息。
在该报告中,填写所有剩余的详细信息(如重现 bug 的步骤),并附加创建 bug 报告时保存的文件。
否则,请手动输入以下详细信息:
模拟器版本
- 在模拟器中,打开 Extended controls。
- 点击 Help。
- 点击 About 标签页以查找 Emulator version。
Android SDK 工具版本
- 依次选择 Tools > SDK Manager。
- 点击 SDK Tools。
- 找到 Android SDK Tools。
主机 CPU 型号
- 在 Linux 上:打开
/proc/cpuinfo。 - 在 Windows 上:右键点击我的电脑,然后选择属性。
- 在 macOS 上:选择 Apple 图标,然后点击关于本机
- 在 Linux 上:打开
设备名称
- 在 AVD Manager 中,点击以打开相应设备的 Actions 列中的菜单。
- 选择 View Details(或打开
$avdname.avd/config.ini文件)。 - 查找 hw.device.name 对应的条目。例如:
hw.device.name=Nexus 5。