
Un registro del sistema muestra las actividades y el uso de recursos en todo el sistema, por lo que puedes ver cómo se programan y ejecutan los procesos de tu app. La vista de registro del sistema en el generador de perfiles de Android Studio se usa comúnmente para investigar lo siguiente:
- Cómo se distribuyen los procesos del sistema y de la app en los núcleos y subprocesos del dispositivo
- Qué tan fluida es la renderización de la IU
- Uso de batería a nivel del dispositivo y de la app
En esta página, se proporciona una descripción general de los elementos visuales más utilizados en la vista de registro del sistema. Consulta el glosario de gráficos para obtener más detalles sobre las visualizaciones que no se describen aquí. Para obtener ejemplos más detallados de para qué usar un registro del sistema, consulta las otras páginas de esta sección.
Después de registrar un seguimiento del sistema, verás las siguientes visualizaciones que se muestran en un cronograma. Debes enfocarte en cómo se correlacionan los diferentes recursos del sistema. Por ejemplo, si observas un aumento repentino en el riel de alimentación del módem, debes ir a la sección de subprocesos y ver qué actividad de subprocesos podría estar causando el aumento en ese momento.
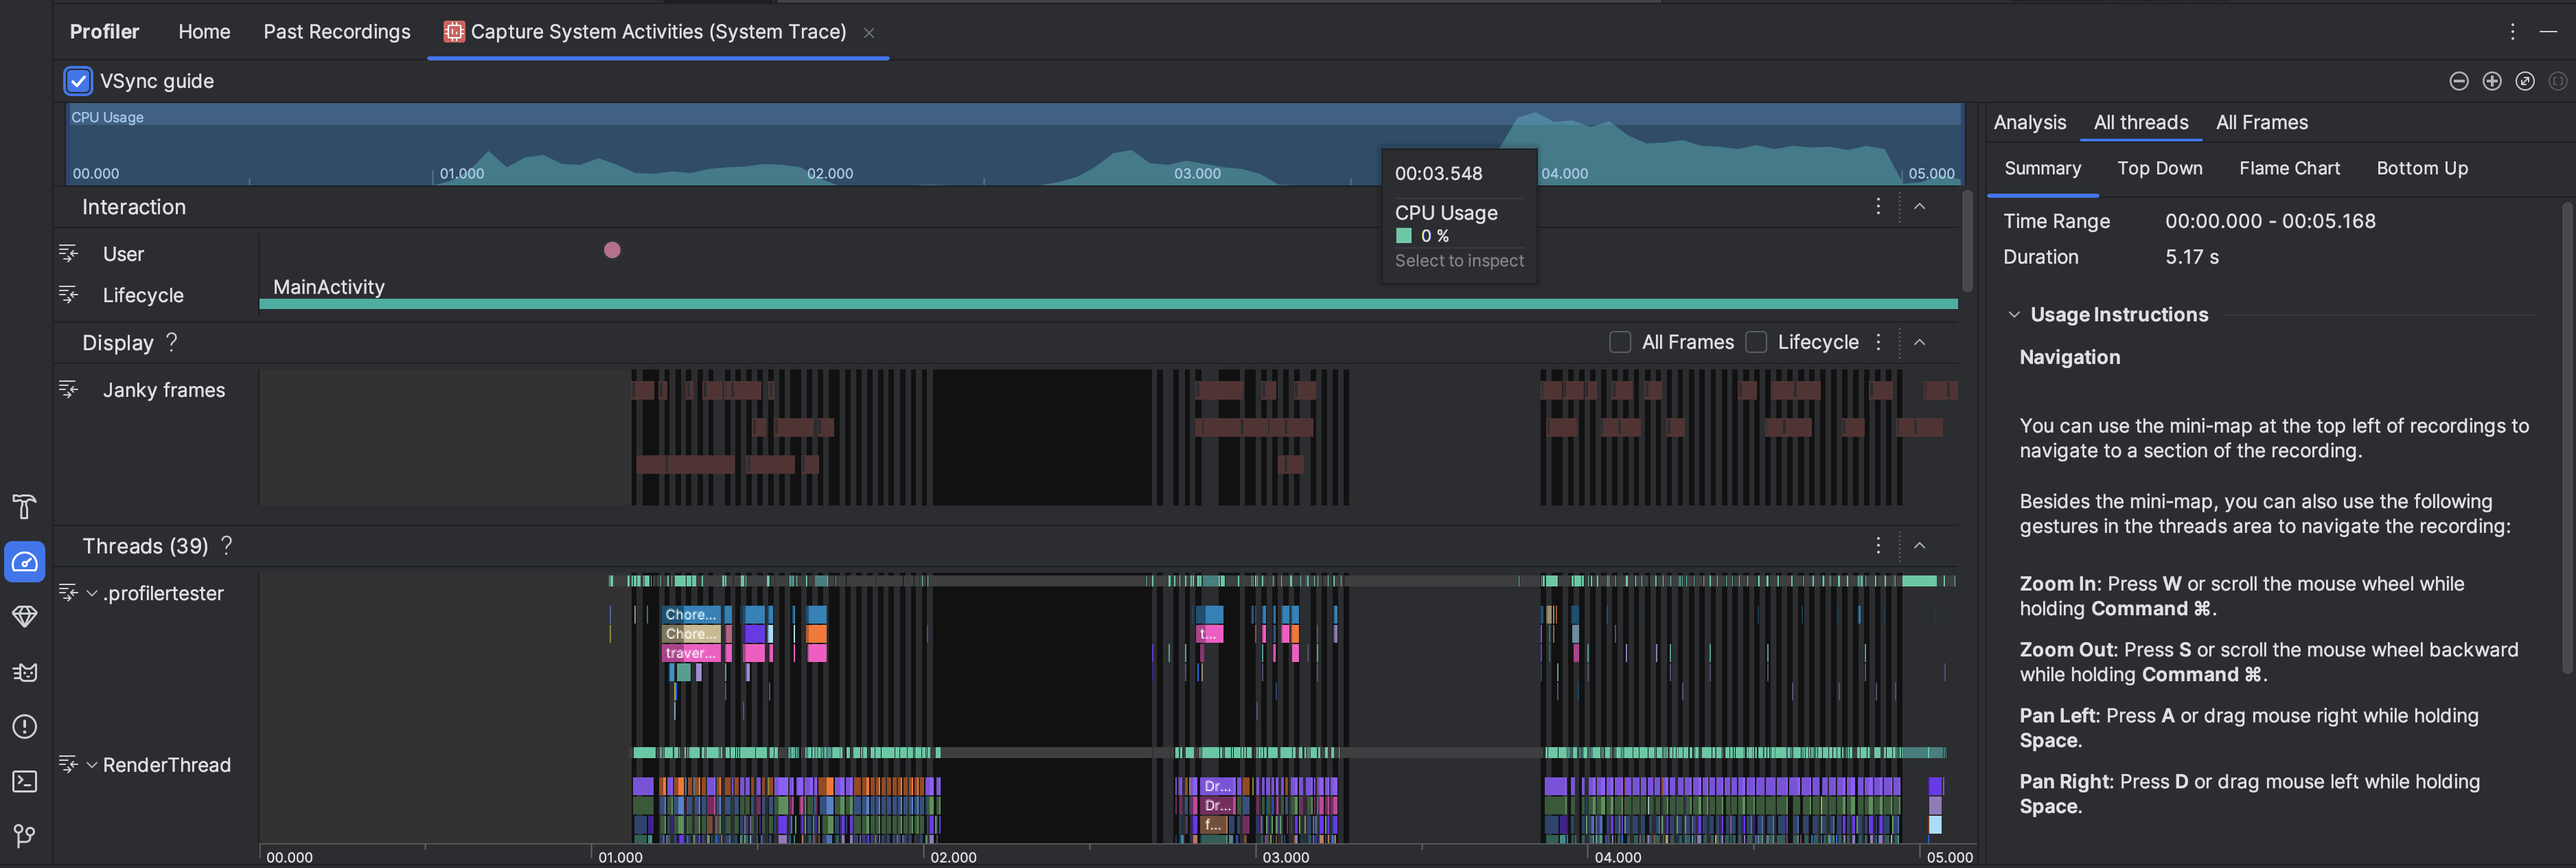
- Uso de CPU: Muestra el uso de CPU de tu app como un porcentaje de la capacidad total de CPU disponible por tiempo. Destaca una sección de la línea de tiempo para filtrar los detalles de ese período.
- Interactions: Muestra la interacción del usuario y los eventos de ciclo de vida de la app en un cronograma (requiere un proceso de app depurable y un dispositivo que ejecute el nivel de API 26 o superior).
- Pantalla: Muestra información relacionada con la fluidez con la que se renderiza la IU de tu app. Selecciona Ciclo de vida para inspeccionar cuánto tiempo le toma a tu app renderizar cada fotograma en el subproceso principal y
RenderThread. Esta información es útil para investigar los cuellos de botella que causan el bloqueo de la IU y una baja velocidad de fotogramas. Threads: Muestra los subprocesos en los que se ejecutan tu app y varios procesos del sistema. Para obtener información sobre cómo usar los registros del sistema para investigar y ayudar a reducir los bloqueos de la IU, consulta Detecta bloqueos de la IU.
Nota: Cuando inspecciones el cronograma de Threads, puedes usar las siguientes combinaciones de teclas:- Acercar: Presiona W o desplaza la rueda del mouse mientras mantienes presionada la tecla Ctrl (Comando en macOS).
- Alejar: Presiona S o desplaza la rueda del mouse hacia atrás mientras mantienes presionada la tecla Ctrl (Comando en macOS).
- Desplazarse a la izquierda: Presiona A o arrastra el mouse hacia la derecha mientras mantienes presionada la barra espaciadora.
- Desplazarse a la derecha: Presiona D o arrastra el mouse hacia la izquierda mientras mantienes presionada la barra espaciadora.
- Expandir o contraer un subproceso: Haz doble clic en el nombre del subproceso o presiona Intro mientras un subproceso está seleccionado.
Núcleos de CPU: Muestra la actividad en cada núcleo del dispositivo. Ver la actividad por núcleo puede darte una idea de cuáles son los núcleos"grandes" o "pequeños" en los procesadores móviles modernos. Mantén el puntero sobre una actividad para ver el subproceso que está ejecutando el núcleo en ese determinado momento.

Memoria de proceso (RSS): Muestra la cantidad de memoria física que la app usa en ese momento. Para obtener más detalles, consulta el glosario de gráficos.
Rieles de energía: Aparece cuando realizas la creación de perfiles en un dispositivo físico. Para obtener más información, consulta Cómo inspeccionar el uso de la batería.
Batería: Muestra el uso de batería de la app.