
Android は、アプリからフレームを生成して画面に表示することで、UI をレンダリングします。アプリの UI レンダリングが遅いと、システムはフレームをスキップせざるを得なくなり、 ユーザーは画面のちらつきを繰り返し感じます。これを「ジャンク」といいます。
ジャンクが発生する場合、通常は、UI スレッド(ほとんどのアプリではメインスレッド)でなんらかの速度低下やブロッキング非同期呼び出しが発生したことが原因です。システム トレースを使用すると、問題のある場所を特定できます。
Jetpack Compose を使用している場合、トレースでレンダリング パフォーマンスを調査する最善の方法は、コンポジション トレーシングを有効にすることです。Compose の一般的なパフォーマンスの問題については、Jetpack Compose のパフォーマンスをご覧ください。
Compose アプリの場合は、アプリのマクロレベルのビュー が必要なときに、このガイドの手順を使用します。ここで紹介するシステム トレースは、ディスク I/O の負荷が高い、 ガーベジ コレクションが頻繁に発生する、GPU レンダリングのボトルネックなど、メインスレッドをブロックするシステムレベルの問題が原因で発生するジャンク を特定するのに役立ちます。ジャンクが UI レイヤに限定されている場合は、Jetpack Compose のパフォーマンス ガイドを使用してください。 このガイドは、過剰な再コンポジション、間違ったフェーズでの状態の読み取り、不安定なパラメータの使用など、Compose 固有の非効率性を修正するのに役立ちます。
Android 12 以降でジャンクを検出する
Android 12(API レベル 31)以降を搭載したデバイスの場合、キャプチャされたトレースは CPU Profiler の [Display] ペインにある [Janky frames] トラックに表示されます。
ジャンクを検出する手順は次のとおりです。
Android Studio で、[View] > [Tool Windows] > [Profiler] を選択するか、ツールバーの [Profile]
 ボタンをクリックします。
[Select Deployment Target] ダイアログが表示されたら、プロファイリング用にアプリをデプロイするデバイスを選択します。USB 経由でデバイスを接続しているにもかかわらずデバイスがリストに表示されない場合は、USB デバッグが有効になっているかを確認します。
[CPU] タイムラインの任意の場所をクリックして CPU Profiler を開きます。
CPU Profiler の構成メニューで [System Trace] を選択し、[Record] をクリックします。アプリの操作が完了したら、[Stop] をクリックします。
[Display] の下に [Janky frames] トラックが表示されます。デフォルトでは、Profiler は調査対象の候補としてジャンクのあるフレームのみを表示します。ジャンクのあるフレーム内で赤くハイライト表示された部分は、レンダリング期限からの超過時間を表しています。
![[Janky frames] トラックのスクリーンショット](https://developer.android.google.cn/static/studio/images/profile/jank_detection-janky_frames.png?hl=ja)
ジャンクのあるフレームが表示されたら、それをクリックします。M キーを押すと、選択したフレームを中心に表示倍率を調整できます。関連するイベントが、メインスレッド、[RenderThread]、[GPU completion] スレッドでハイライト表示されます。
![[Janky frames] とメインスレッドが表示された Profiler のスクリーンショット](https://developer.android.google.cn/static/studio/images/profile/jank_detection-janky_frames_detailed.png?hl=ja)
[**All Frames**]、[**Lifecycle**] のチェックボックスをオンにすることで、それぞれ、すべてのフレーム、レンダリング時間の内訳を表示できます。
![上と同じ Profiler 画面で [All Frames] と [Lifecycle] のチェックボックスをオンにした場合のスクリーンショット](https://developer.android.google.cn/static/studio/images/profile/jank_detection-allframes_lifecycle_checkboxed.png?hl=ja)
Android 11 でジャンクを検出する
Android 11(API レベル 30)搭載デバイスの場合、キャプチャされたトレースは CPU Profiler の [Frame Lifecycle] セクションに表示されます。
![さまざまなトラックが含まれる [Frame Lifecycle] セクション](https://developer.android.google.cn/static/studio/images/profile/jank_detection-frame-lifecycle-tracks.png?hl=ja)
[Frame Lifecycle] セクションには、レイヤ名と 4 つのトラックが表示されます。各トラックは、フレーム レンダリング パイプラインの 1 つのステージを表しています。Frame Lifecycle の要素は次のとおりです。
- Frame Lifecycle(レイヤ名): セクション タイトルには、かっこ書きでレイヤ名が含まれています。レイヤは、単一の合成単位です。
- アプリケーション: このトラックは、バッファがアプリによってキューから除外されてから
、再度キューに追加されるまでの時間を示します。これは通常、
RenderThreadのトレース イベントに対応します。 - GPU 待機: このトラックは、GPU がバッファを保有していた期間を示します。これは、バッファが GPU に送信されてから、GPU がバッファに対する処理を終了するまでの時間です。GPU がこの期間にこのバッファのみを処理していたということではありません。 特定の期間に GPU が処理していた内容の詳細な情報については、Android GPU Inspectorを使用することをおすすめします。
- Composition: このトラックは、SurfaceFlinger がバッファをラッチして合成のために送信してから、バッファがディスプレイに 送信されるまでの時間を示します。
- Frames on display: このトラックは、フレームが 画面に表示されていた期間を示します。
[Frame Lifecycle] セクションは、フレーム バッファがレンダリング パイプラインのさまざまなステージ間をどのように移動するかを示します。フレームはフレーム番号ごとに色分けされているため、特定のフレームを簡単に追跡できます。
Android Studio では、トレース内のすべてのフレームを [All Frames] タブに表形式で表示することもできます。
![[All Frames] タブにおけるトレース内の全フレームの表](https://developer.android.google.cn/static/studio/images/profile/jd-all-frames.png?hl=ja)
[Frame #]、[Application]、[Wait for GPU]、および [Composition] の各列には、上記の [Frame Lifecycle] セクション内のトラックと同じデータが表示されます。[Frame Duration] 列は、[Application] の開始から [Frames on Display] の開始までの時間を示します。これは基本的に、1 つのフレームをエンドツーエンドでレンダリングするためにかかる時間です。
フレームの表を任意の列で並べ替えると、最短または最長のフレームをすばやく見つけることができます。この表には、何百ものフレーム間を移動するのに役立つページネーション コントロールもあります。
Android 11 でジャンクを検出して調査する手順は次のとおりです。
[Application] 列を基準にして [All Frames] 表を降順に並べ替えて、最も時間がかかるフレームから表示されるようにします。
![降順に並べ替えられた [Application] 列](https://developer.android.google.cn/static/studio/images/profile/jank_detection-app-col-sorted.png?hl=ja)
最も時間がかかっているフレームを見つけて、表の行を選択します。これにより、左側のタイムライン ビューで、選択したフレームにズームインされます。
![タイムライン ビューと [Frames] 表](https://developer.android.google.cn/static/studio/images/profile/jank_detection-timeline-and-frames-table.png?hl=ja)
[Frame Lifecycle] セクションと [Threads] セクションで、関連するスレッドを探します。
![[Frame Lifecycle] セクションと [Threads] セクション](https://developer.android.google.cn/static/studio/images/profile/jank_detection-frame-lifecycle-threads.png?hl=ja)
Android 10 以前でジャンクを検出する
Android 10(API レベル 29)以前を搭載したデバイスの場合、関連する OS グラフィックス パイプライン情報が、CPU Profiler のシステム トレースで [Display] という単一のセクションに表示されます。
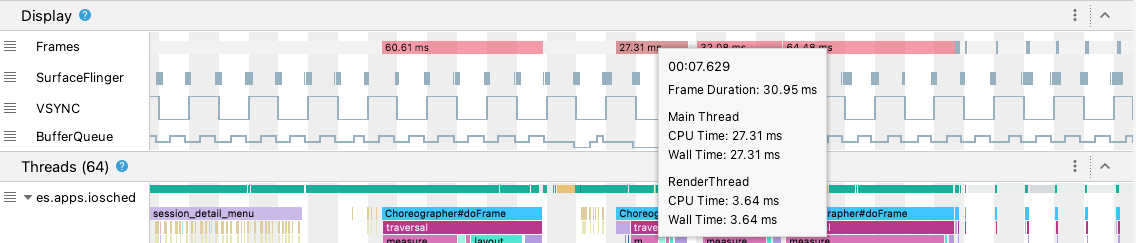
- フレーム: このセクションは、アプリの UI スレッドと
RenderThreadトレース イベント を示します。16 ミリ秒より長いイベントは赤色で示され、60 フレーム/秒(FPS)でレンダリングするための期限を超えることから、ジャンクが発生した可能性として ハイライト表示されます。 - SurfaceFlinger: このセクションは、SurfaceFlinger が フレーム バッファを処理するタイミングを示します。SurfaceFlinger は、表示するバッファの送信を行うシステム プロセスです。
- VSYNC: このセクションは、ディスプレイ パイプラインを同期する信号である VSYNC を示します。トラックには VSYNC-app シグナルが表示されます。これはアプリの起動が遅すぎることを示します。通常は、UI スレッドがビジー状態であることが原因です。これにより、アニメーション中に画面にちらつきが発生し、アニメーションまたはスクロールが完了するまでの入力レイテンシが増えます。1 秒あたり 60 回を超える頻度で、または変動レートで発生する可能性があるため、リフレッシュ レートの高いディスプレイでの表示には VSYNC が特に重要です。
- BufferQueue: このセクションは、キューに入れられ、
SurfaceFlinger が使用するまで待機しているフレーム バッファの数を示します。Android 9(API レベル 28)以降を搭載したデバイスにデプロイされたアプリの場合、このトラックはアプリのサーフェス BufferQueue のバッファ数を示します(
0、1、または2)。BufferQueue は、Android グラフィックス コンポーネント間を移動する際の画像バッファの状態を把握するために役立ちます。たとえば値が2の場合は、アプリがトリプル バッファされていることを意味します。その結果、入力レイテンシが長くなります。
[Display] セクションでは、UI スレッドや RenderThread に 16 ミリ秒以上かかった場合など、起こり得るジャンクを検出するために役立つシグナルを確認できます。ジャンクの原因の詳細を正確に調査するには、UI レンダリングに関連するスレッドが表示される [Threads] セクションを調べます。
![[Display] の [Threads] セクション](https://developer.android.google.cn/static/studio/images/profile/jank_detection-threads.png?hl=ja)
上の図では、[Threads] セクションに UI スレッド
(java.com.google.samples.apps.iosched)、RenderThread、GPU
completion スレッドが表示されています。これらは UI レンダリングに関連するスレッドであり、ジャンクを引き起こす可能性があります。
Android 10 以前のデバイスでジャンクを検出する手順は次のとおりです。
[Display] の [Frames] トラックを確認します。赤いフレームは調査候補です。
![[Display] の [Frames] セクション](https://developer.android.google.cn/static/studio/images/profile/jank_detection-frames-track.png?hl=ja)
ジャンクのある可能性のあるフレームが見つかったら、
Wキーを押すか Control キー(macOS では Command キー)を押しながらマウスホイールをスクロールしてズームインします。UI スレッドとRenderThreadのトレース イベントを確認できるようになるまでズームインし続けます。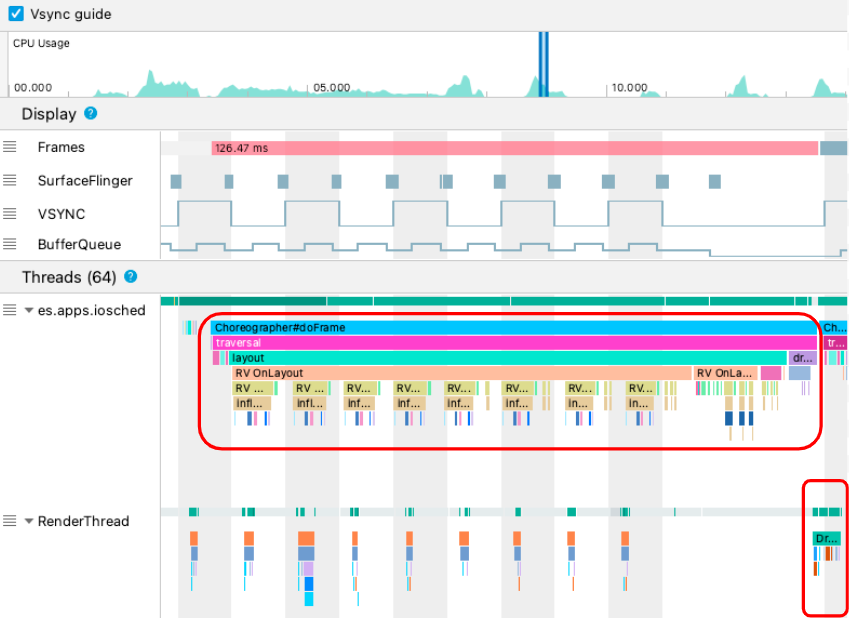
上の図の
Choreographer#doFrameは、UI スレッドがChoreographerを呼び出して、アニメーション、ビュー レイアウト、画像描画、 関連プロセスを調整していたタイミングを示しています。DrawFramesは、RenderThreadが形成され、実際の描画コマンドが GPU に発行されたタイミングを示しています。メインスレッドで特に長いトレース イベントが見つかった場合は、ズームインして、どの UI コンポーネントまたはコンポーズ可能な関数がフレームを遅延させているかを確認します。
Perfetto を使用した高度な調査
Android Studio のシステム トレース プロファイリング タスクは Perfetto によって実行されます。複雑なレンダリングの問題に対処していて、カスタム SQL クエリや高度なタイムライン ナビゲーションが必要な場合は、IDE の外部でトレース分析を行うことができます。
Android Studio からシステム トレースをエクスポートするには、Profiler ペインの [Export trace] アイコン をクリックし、生成されたファイルをウェブベースの [Perfetto UI] にドラッグします。これにより、システムレベルのパフォーマンス分析専用の環境が提供されます。VSYNC、SurfaceFlinger、Frame Timeline トラックなど、OS グラフィックス パイプラインの詳細を解釈する方法については、 Perfetto の公式ドキュメントをご覧ください。
詳細
ジャンクを減らす方法については、一般的なジャンク発生源をご覧ください。