
本文档介绍了 Batterystats 工具和 Battery Historian 脚本的基本设置步骤和工作流。如需了解如何使用 Battery Historian 检查耗电模式,请参阅使用 Battery Historian 分析耗电情况。
Batterystats 是包含在 Android 框架中的一种工具,用于收集设备上的电池数据。您可以使用 adb 将收集的电池数据转储到开发机器,并生成可使用 Battery Historian 分析的报告。Battery Historian 会将报告从 Batterystats 转换为可在浏览器中查看的 HTML 可视化内容。
Batterystats 和 Battery Historian 在以下场景下非常有用:
- 显示进程从什么位置以及通过何种方式消耗电池电量。
- 识别系统为了延长电池续航时间会延迟或移除应用中的哪些任务。
安装 Battery Historian
您可以使用 Docker 安装 Battery Historian。如需了解其他安装方法(包括通过源代码构建),请参阅项目的 GitHub 页面上的自述文件。如需使用 Docker 进行安装,请执行以下操作:
如需确认 Docker 是否已正确安装,请打开命令行并输入以下命令:
docker run hello-world如果 Docker 已正确安装,将显示如下输出:
Unable to find image 'hello-world:latest' locally
latest: Pulling from library/hello-world
78445dd45222: Pull complete
Digest:
sha256:c5515758d4c5e1e838e9cd307f6c6a0d620b5e07e6f927b07d05f6d12a1ac8d7
Status: Downloaded newer image for hello-world:latest

Hello from Docker!
This message shows that your installation appears to be working correctly.

To generate this message, Docker took the following steps:
1. The Docker client contacted the Docker daemon.
2. The Docker daemon pulled the "hello-world" image from the Docker Hub.
3. The Docker daemon created a new container from that image which runs the
executable that produces the output you are currently reading.
4. The Docker daemon streamed that output to the Docker client, which sent it to your terminal
先启动 Docker Desktop 应用(即 Docker 的 GUI 前端),然后再运行 Battery Historian 映像。运行此映像会初始化 Docker 工具。此操作至少要执行一次,Battery Historian 才会运行。
首次运行 Battery Historian 时,请从命令行运行此工具。您无法通过 Docker Desktop 应用指定用于运行 Web 服务器的端口,只能从命令行执行此操作。不过,当您从命令行成功运行容器后,系统会在 Docker Desktop 中创建一个条目,然后您可以使用 Docker Desktop 中的同一监听器端口启动该条目。
使用以下命令运行 Battery Historian 映像:
docker run -p port_number:9999 gcr.io/android-battery-historian/stable:3.1 --port 9999
Battery Historian 会使用您选择的端口,如使用
port_number指定的端口。在浏览器中前往 Battery Historian,确认它正在运行。具体地址因操作系统而异:
- 对于 Linux 和 Mac
- Battery Historian 可在
http://localhost:port_number找到。 - 对于 Windows
- 启动 Docker 后,系统会告诉您该工具所用计算机的 IP 地址。例如,如果 IP 地址为 123.456.78.90,则 Battery Historian 位于
http://123.456.78.90:port_number。
然后,系统会显示 Battery Historian 初始页,您可以从中上传和查看电池统计信息。
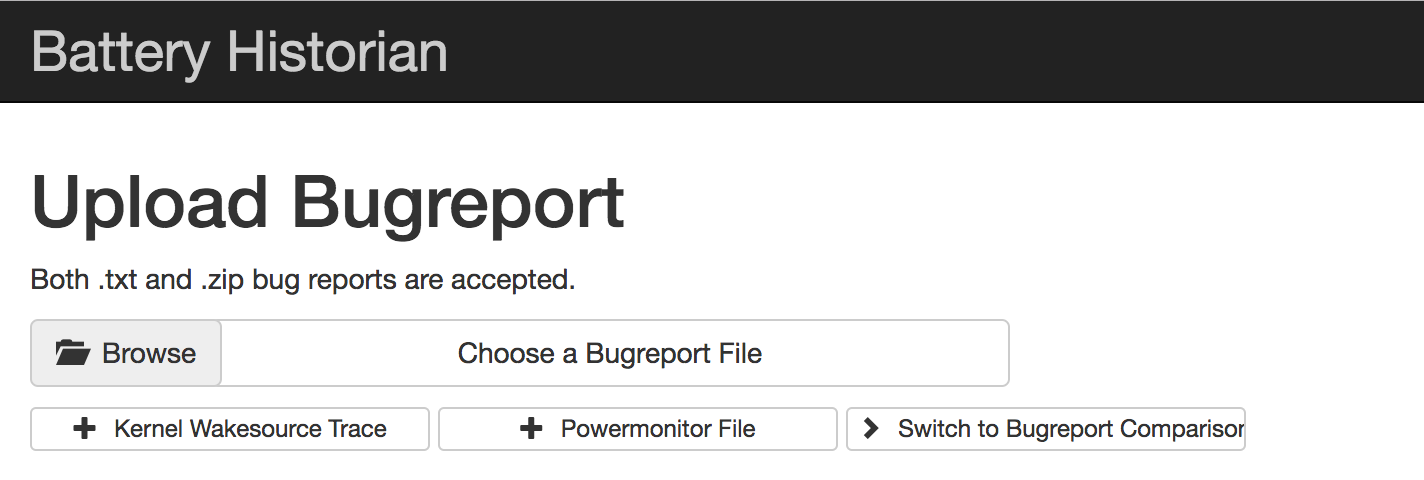
图 1. Battery Historian 初始页。
使用 Batterystats 收集数据
如需使用 Batterystats 从您的设备收集数据并在 Battery Historian 中打开该数据,请执行以下操作:
将移动设备连接到计算机。
在终端窗口中,运行以下命令来关闭正在运行的
adb服务器:adb kill-server重启
adb并运行以下命令来检查已连接的设备。adb devices该命令会列出您的设备,类似于以下示例输出。
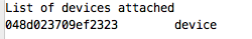
图 2. adb devices的输出,显示有一个已连接的设备如果其中未列出任何设备,请确保您的手机已连接且已启用 USB 调试功能,然后停止并重启
adb。运行以下命令,重置电池数据的收集操作:
adb shell dumpsys batterystats --reset设备始终会在后台收集 Batterystats 和其他调试信息。重置操作会清除之前收集的电池数据。如果您不重置,输出内容会非常大。
断开设备与计算机的连接,以便仅通过设备电池供电。
使用您的应用,然后执行您要收集数据的操作。例如,断开 Wi-Fi 连接并将数据发送到云端。
重新连接手机。
确保系统能识别您的手机,然后运行以下命令:
adb devices运行以下命令,转储所有电池数据。此过程可能需要一段时间。
adb shell dumpsys batterystats > [path/]batterystats.txt
系统会使用可选路径参数在您指定的目录中创建
batterystats.txt文件。如果您未指定路径,系统将在您的主目录中创建文件。使用原始数据生成报告。
- 对于搭载 Android 7.0 及更高版本的设备:
-
adb bugreport [path/]bugreport.zip
- 对于搭载 Android 6.0 及更低版本的设备:
-
adb bugreport [path/]bugreport.txt
bug 报告可能需要几分钟才能完成。在完成之前,请勿断开设备连接或取消该进程。
与
batterystats.txt一样,这些文件是系统使用可选的path参数在您指定的目录中创建的。如果您未指定路径,系统将在您的主目录中创建这些文件。如果 Battery Historian 尚未运行,请使用以下命令运行:
docker run -p port_number:9999 gcr.io/android-battery-historian/stable:3.1 --port 9999
如需在 Battery Historian 中查看数据,请在浏览器中打开 Battery Historian。对于 Mac 和 Linux,Battery Historian 会在
http://localhost:port_number运行;对于 Windows,Battery Historian 会在http://your_IP_address:port_number运行。点击 Browse,然后选择您创建的 bug 报告文件。
点击 Submit。Battery Historian 会打开您根据 Batterystats 数据创建的图表。
使用 Battery Historian 图表查看数据
Battery Historian 图表会显示一段时间内与电源相关的事件。
当系统组件由于处于活动状态而正在消耗电池电量时,每行都会显示一个彩色条形段。图表不会显示该组件使用的电量,仅表示相关应用处于活动状态。图表按类别进行整理,并以一个条形显示每个类别随时间的变化,如图表的 X 轴所示。
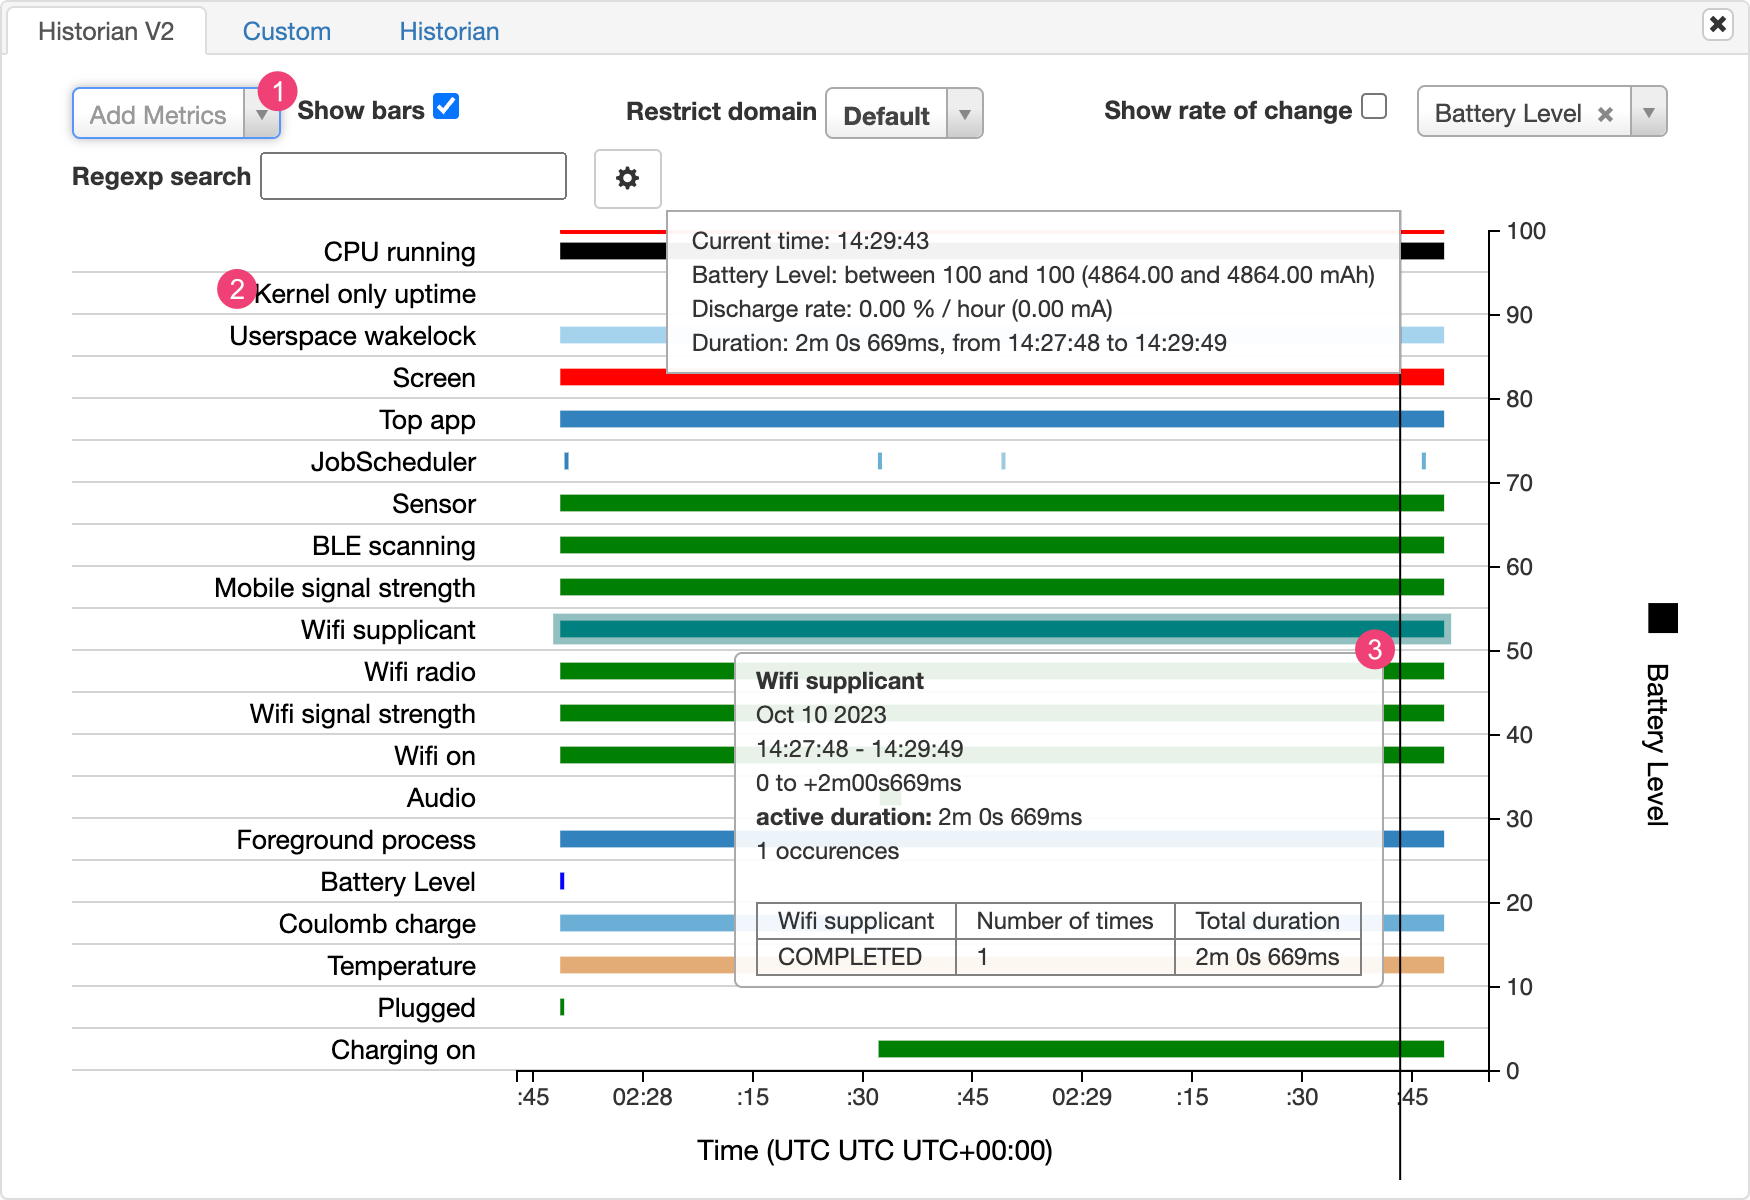
- 从下拉列表中添加其他指标。
- 将指针悬停在指标名称上可查看有关每个指标的更多信息,包括图表中使用的颜色对应的键。
- 将指针悬停在某个条形上可查看有关该指标的更多详细信息以及时间轴上特定点的电池统计信息。
其他 Batterystats 输出
在 Battery Historian 图表之后的统计信息部分中,您可以查看 batterystats.txt 文件中的其他信息。
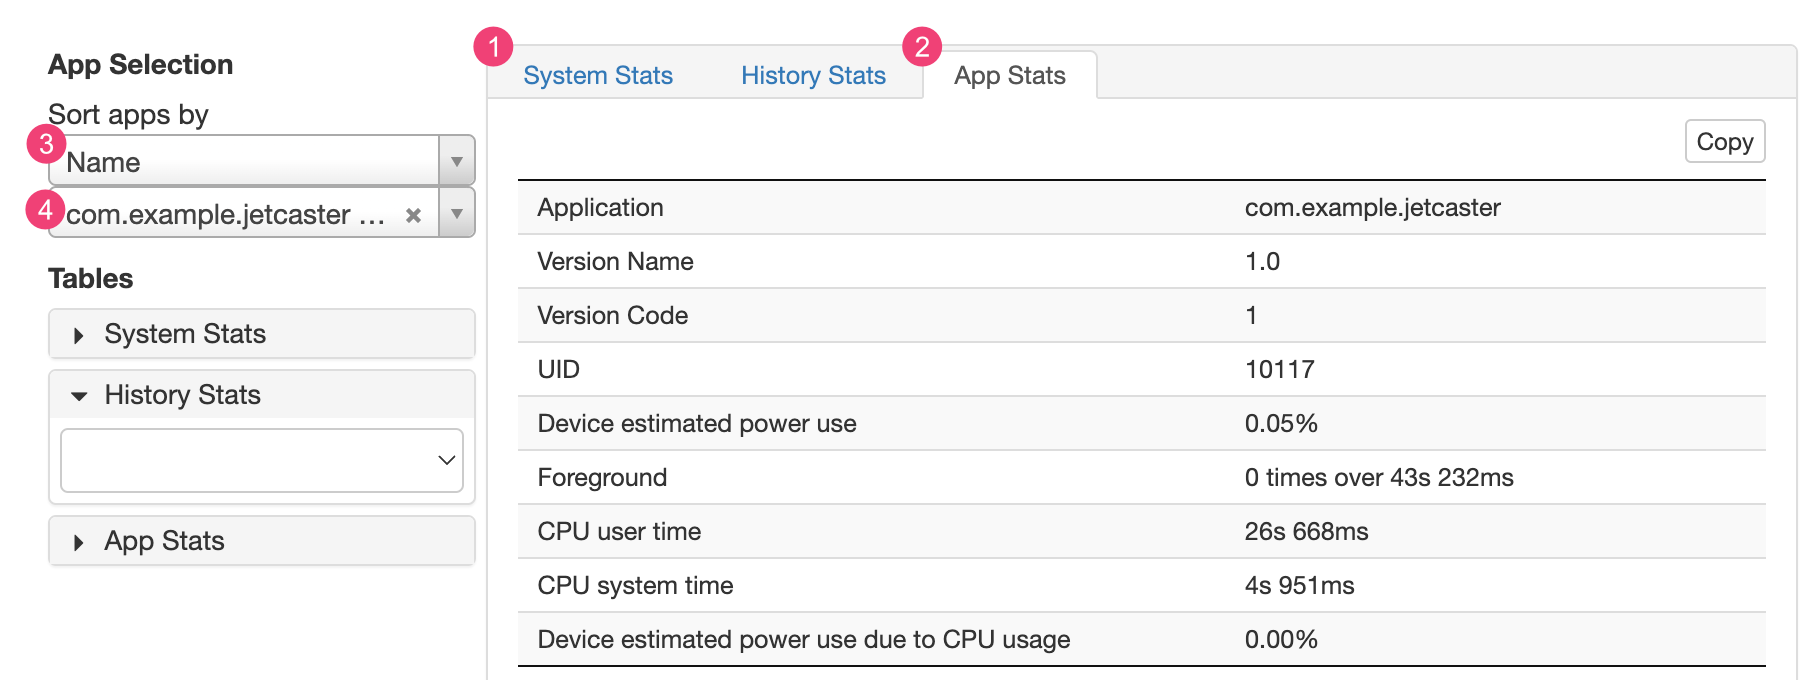
System Stats 标签页(标示为 1)包含系统范围的统计信息,例如电池信号电平和屏幕亮度。此信息可全面反映设备的具体情况。这对于确保没有任何外部事件影响您的测试尤为有用。
App Stats 标签页(标示为 2)包含有关特定应用的信息。请使用 App Selection 窗格中的 Sort apps by 下拉列表(标示为 3)对应用列表进行排序。您可以使用应用下拉列表(标示为 4)选择特定应用来查看统计信息。