
このチュートリアルでは、Batterystats ツールと Battery Historian スクリプトの基本的なセットアップ方法とワークフローについて説明します。Battery Historian を使用してバッテリー消費パターンを調べる方法については、Battery Historian を使用して消費電力を分析するをご覧ください。
Batterystats は Android フレームワークに含まれるツールで、デバイスのバッテリー データを収集します。adb を使用して、収集したバッテリー データを開発マシンにダンプし、レポートを作成できます。このレポートは、Battery Historian を使用して分析できます。Battery Historian は、Batterystats が生成したレポートを、ブラウザで表示可能な HTML 表示形式に変換します。
Batterystats と Battery Historian は、以下の場合に便利です。
- 各プロセスが、バッテリーのどこからどのように電流を引き出しているのかを表示できます。
- アプリ内で、保留したり削除したりすることでバッテリー駆動時間を延ばせるタスクを特定できます。
Battery Historian をインストールする
Docker を使用して Battery Historian をインストールできます。ソースからビルドするなど、他のインストール方法については、プロジェクトの GitHub ページの README をご覧ください。Docker を使用してインストールする手順は次のとおりです。
Docker ウェブサイトの手順に沿って Docker をインストールします。無料のパーソナル プランを含め、どのサブスクリプション タイプでも機能します。
Docker が正しくインストールされているか確認するには、コマンドラインを開いて次のコマンドを入力します。
docker run hello-worldDocker が正しくインストールされていれば、次のような出力が表示されます。
Unable to find image 'hello-world:latest' locally
latest: Pulling from library/hello-world
78445dd45222: Pull complete
Digest:
sha256:c5515758d4c5e1e838e9cd307f6c6a0d620b5e07e6f927b07d05f6d12a1ac8d7
Status: Downloaded newer image for hello-world:latest

Hello from Docker!
This message shows that your installation appears to be working correctly.

To generate this message, Docker took the following steps:
1. The Docker client contacted the Docker daemon.
2. The Docker daemon pulled the "hello-world" image from the Docker Hub.
3. The Docker daemon created a new container from that image which runs the
executable that produces the output you are currently reading.
4. The Docker daemon streamed that output to the Docker client, which sent it to your terminal
Battery Historian イメージを実行する前に、Docker Desktop アプリ(Docker の GUI フロントエンド)を起動します。これを実行すると、Docker ツールが初期化されます。Battery Historian は、この操作を少なくとも 1 回行うまで実行されません。
Battery Historian を初めて実行するときは、コマンドラインから実行します。Docker Desktop アプリでは、ウェブサーバーを実行するポートを指定できません。コマンドラインからのみ指定できます。ただし、コマンドラインからコンテナを正常に実行すると、Docker Desktop アプリにエントリが作成され、Docker Desktop から同じリスナーポートを使用してコンテナを起動できるようになります。
次のコマンドを使用して Battery Historian イメージを実行します。
docker run -p port_number:9999 gcr.io/android-battery-historian/stable:3.1 --port 9999
Battery Historian は、
port_numberで指定されたポートを使用します。ブラウザで Battery Historian に移動して、実行中になっているか確認します。アドレスはオペレーティング システムによって異なります。
- Linux、Mac の場合
- Battery Historian は
http://localhost:port_numberで確認できます。 - Windows の場合
- Docker を起動すると、使用しているマシンの IP アドレスが表示されます。たとえば IP アドレスが 123.456.78.90 の場合、Battery Historian は
http://123.456.78.90:port_numberで確認できます。
次に、Battery Historian のスタートページが表示されます。このページでは、バッテリーの統計情報をアップロード、確認できます。
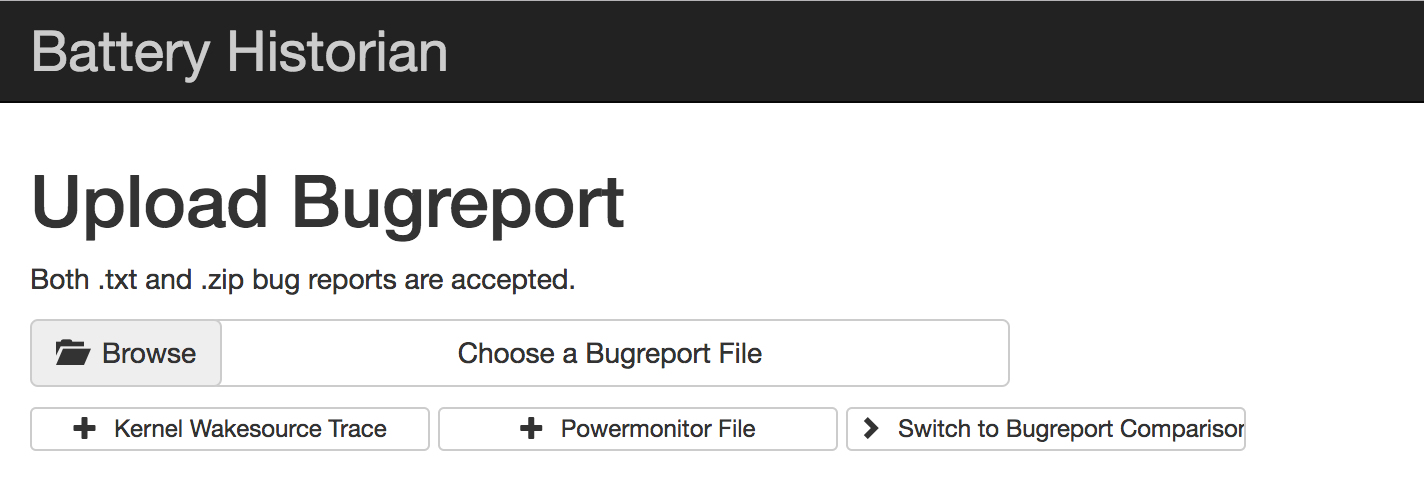
図 1. Battery Historian のスタートページ。
Batterystats を使用してデータを収集する
Batterystats を使用してデバイスからデータを収集し、Battery Historian でそのデータを開く手順は次のとおりです。
モバイル デバイスをパソコンに接続します。
ターミナル ウィンドウから、次のコマンドを実行して、実行中の
adbサーバーをシャットダウンします。adb kill-server次のコマンドを実行して、
adbを再起動し、接続済みのデバイスを確認します。adb devices次の出力例のようにデバイスが表示されます。
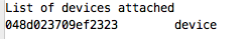
図 2. 接続済みのデバイスが 1 台であることを示す adb devicesの出力。デバイスが表示されない場合は、スマートフォンが接続されていて USB デバッグが有効になっていることを確認してから、
adbを終了して再起動します。次のコマンドを実行して、バッテリー データの収集をリセットします。
adb shell dumpsys batterystats --resetデバイスは常に、Batterystats と各種デバッグ情報をバックグラウンドで収集しています。リセットすると、以前のバッテリー収集データが消去されます。リセットしない場合、出力が非常に大きくなる可能性があります。
デバイスのバッテリーだけから電流を引き出すようにするため、デバイスをパソコンから切断します。
アプリを使用して、データ収集の対象にするアクションを実行します。たとえば、Wi-Fi から切断してクラウドにデータを送信します。
スマートフォンを再接続します。
スマートフォンが認識されていることを確認してから、次のコマンドを実行します。
adb devices次のコマンドを実行して、すべてのバッテリー データをダンプします。この処理にはしばらく時間がかかることがあります。
adb shell dumpsys batterystats > [path/]batterystats.txt
path 引数を使用して指定した上記のディレクトリに、
batterystats.txtファイルが作成されます。path を指定しなかった場合、このファイルはホーム ディレクトリに作成されます。元データからレポートを作成します。
- Android 7.0 以降を搭載しているデバイスの場合:
-
adb bugreport [path/]bugreport.zip
- Android 6.0 以前を搭載しているデバイスの場合:
-
adb bugreport [path/]bugreport.txt
バグレポートの作成が完了するまでに数分かかることがあります。処理が完了するまで、デバイスを切断したり、プロセスをキャンセルしたりしないでください。
このファイルは、上記の
batterystats.txtと同様、オプションのpath引数を使用して指定したディレクトリに作成されます。path を指定しなかった場合は、ホーム ディレクトリに作成されます。まだ実行していない場合は、次のコマンドを使用して Battery Historian を実行します。
docker run -p port_number:9999 gcr.io/android-battery-historian/stable:3.1 --port 9999
Battery Historian でデータを表示するには、ブラウザ内で Battery Historian を開きます。Mac や Linux の場合、Battery Historian は
http://localhost:port_numberで稼働します。Windows の場合、Battery Historian はhttp://your_IP_address:port_numberで稼働します。[Browse] をクリックして、上記で作成したバグレポート ファイルを選択します。
[Submit] をクリックします。Battery Historian で、Batterystats データから作成されたグラフが開きます。
Battery Historian グラフを使用してデータを表示する
Battery Historian グラフは、電力関連イベントを経時的にグラフ化します。
システム コンポーネントがアクティブでバッテリーから電流を引き出している場合、各行に色付きのバーセグメントが表示されます。グラフには、コンポーネントによるバッテリー使用量は表示されず、アプリがアクティブかどうかのみが表示されます。グラフはカテゴリ別に分類され、各カテゴリのバーの経時的変化がグラフの X 軸に沿って表示されます。
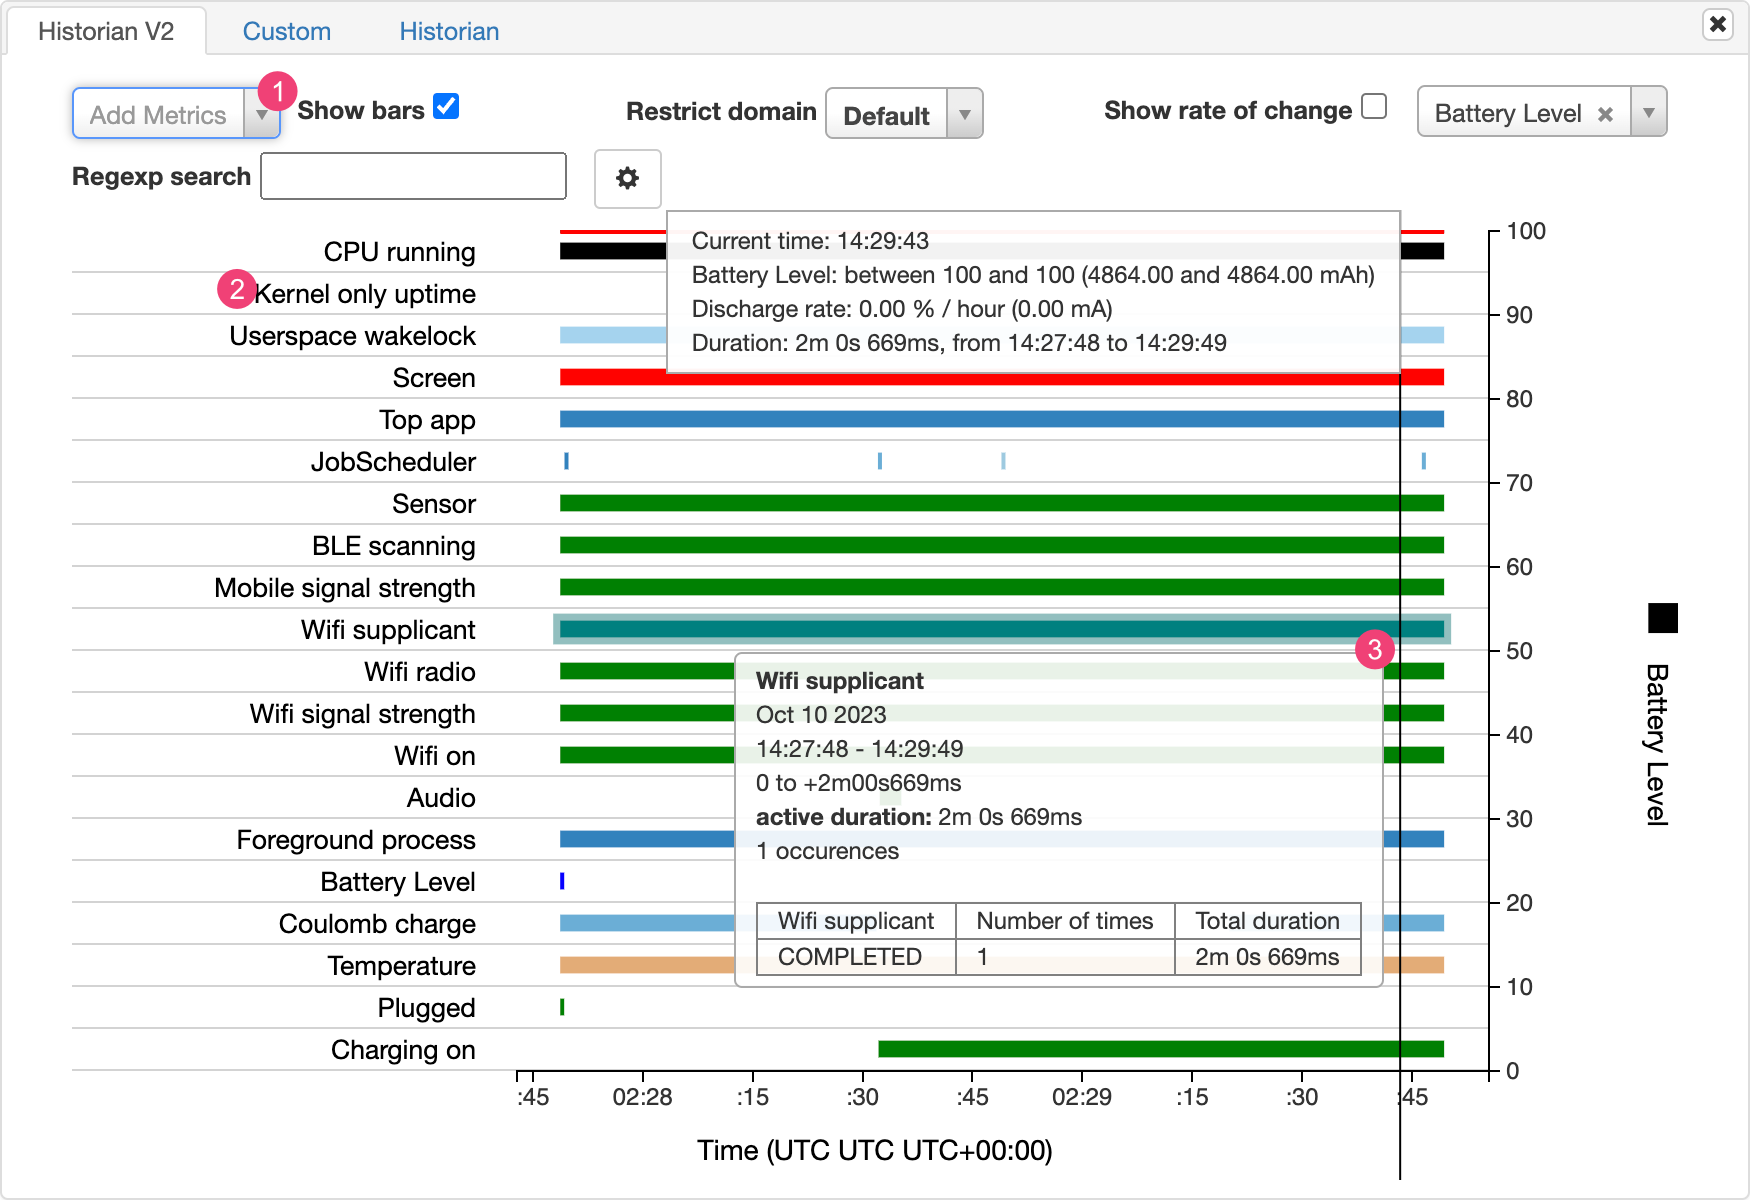
- プルダウン リストから、指標を追加します。
- 指標名の上にポインタを置くと、グラフで使用されている色のキーなど、各指標の詳細情報が表示されます。
- バーの上にポインタを置くと、タイムライン上の特定のポイントにおける指標やバッテリー統計情報に関する詳細情報が表示されます。
Batterystats のその他の出力
Battery Historian グラフの下にある統計情報セクションで、batterystats.txt ファイルに関する追加情報を表示できます。
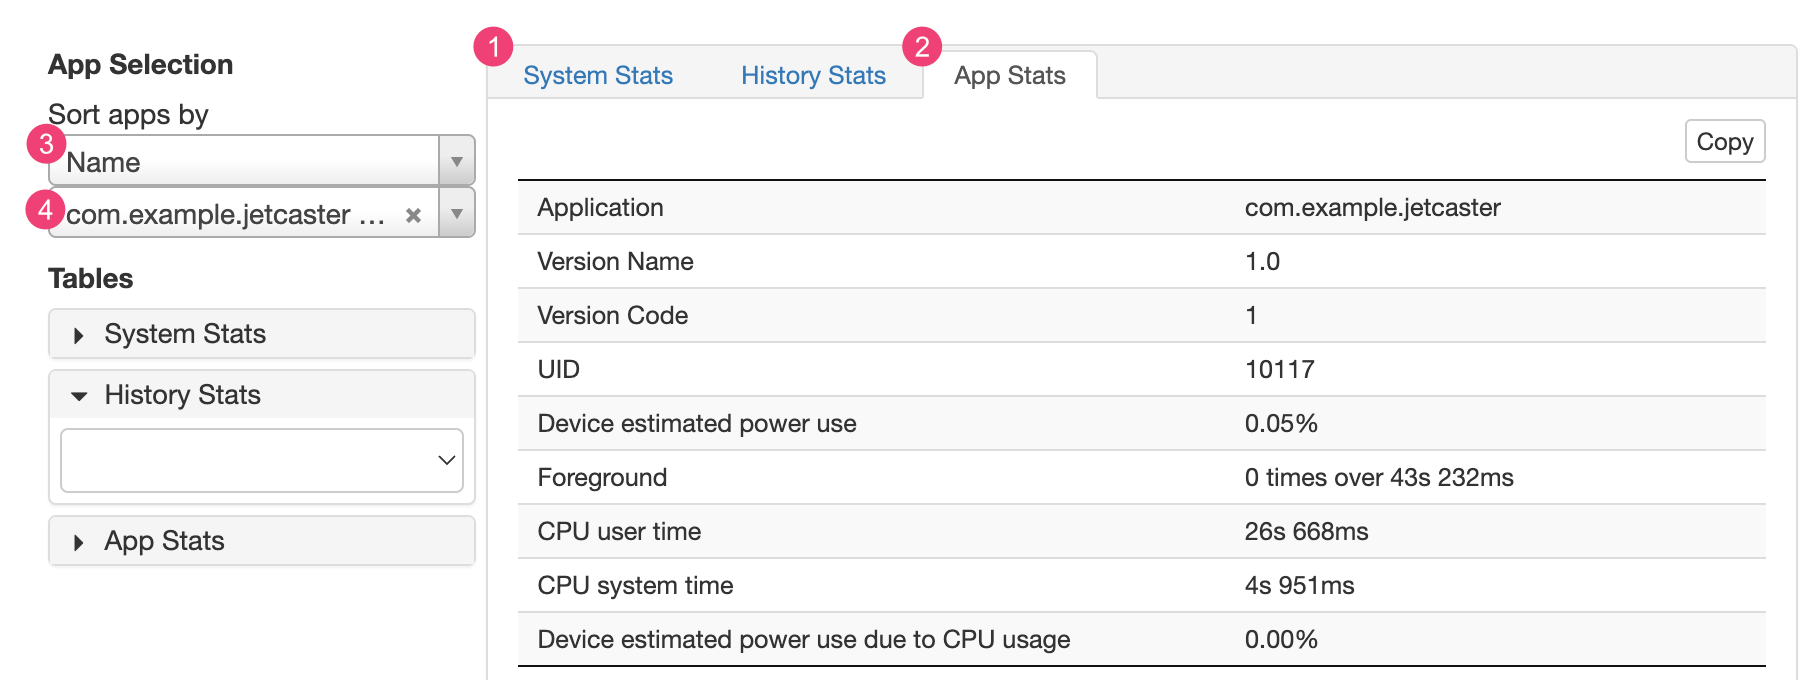
[System Stats] タブ(1)には、セルの信号レベルや画面の明るさなど、システム全体の統計情報が表示されます。この情報により、デバイスの全体的な状況を把握できます。この情報は、外部イベントがテストに影響していないか確認する際に特に便利です。
[App Stats] タブ(2)には、個々のアプリに関する情報が表示されます。[App Selection] ペインにある [Sort apps by] プルダウン リスト(3)を使用すると、アプリのリストを並べ替えられます。アプリ プルダウン リスト(4)を使用して特定のアプリを選択すると、その統計情報を表示できます。