
指标是指从基准测试中提取的主要信息类型。这些指标会以 List 的形式传递给 measureRepeated 函数;也就是说,您可以一次性指定多个测量指标。若要运行基准测试,必须至少提供 1 种类型的指标。
以下代码段会捕获帧时间和自定义的轨迹部分指标:
Kotlin
benchmarkRule.measureRepeated(
    packageName = TARGET_PACKAGE,
    metrics = listOf(
        FrameTimingMetric(),
        TraceSectionMetric("RV CreateView"),
        TraceSectionMetric("RV OnBindView"),
    ),
    iterations = 5,
    // ...
)
Java
benchmarkRule.measureRepeated(
    TARGET_PACKAGE,     // packageName
    Arrays.asList(      // metrics
        new StartupTimingMetric(),
        new TraceSectionMetric("RV CreateView"),
        new TraceSectionMetric("RV OnBindView"),
    ),
    5,                  // Iterations
    // ...
);
在这个示例中,RV CreateView 和 RV OnBindView 是 RecyclerView 中定义的可跟踪代码块的 ID。createViewHolder() 方法的源代码示例展示了如何在您自己的代码中定义可跟踪代码块。
本文稍后会详细介绍 StartupTimingMetric、TraceSectionMetric、FrameTimingMetric 和 PowerMetric。如需查看完整的指标列表,请查看 Metric 的子类。
基准测试结果会输出到 Android Studio,如图 1 所示。如果定义了多个指标,则所有这些指标会在输出中合并到一处。
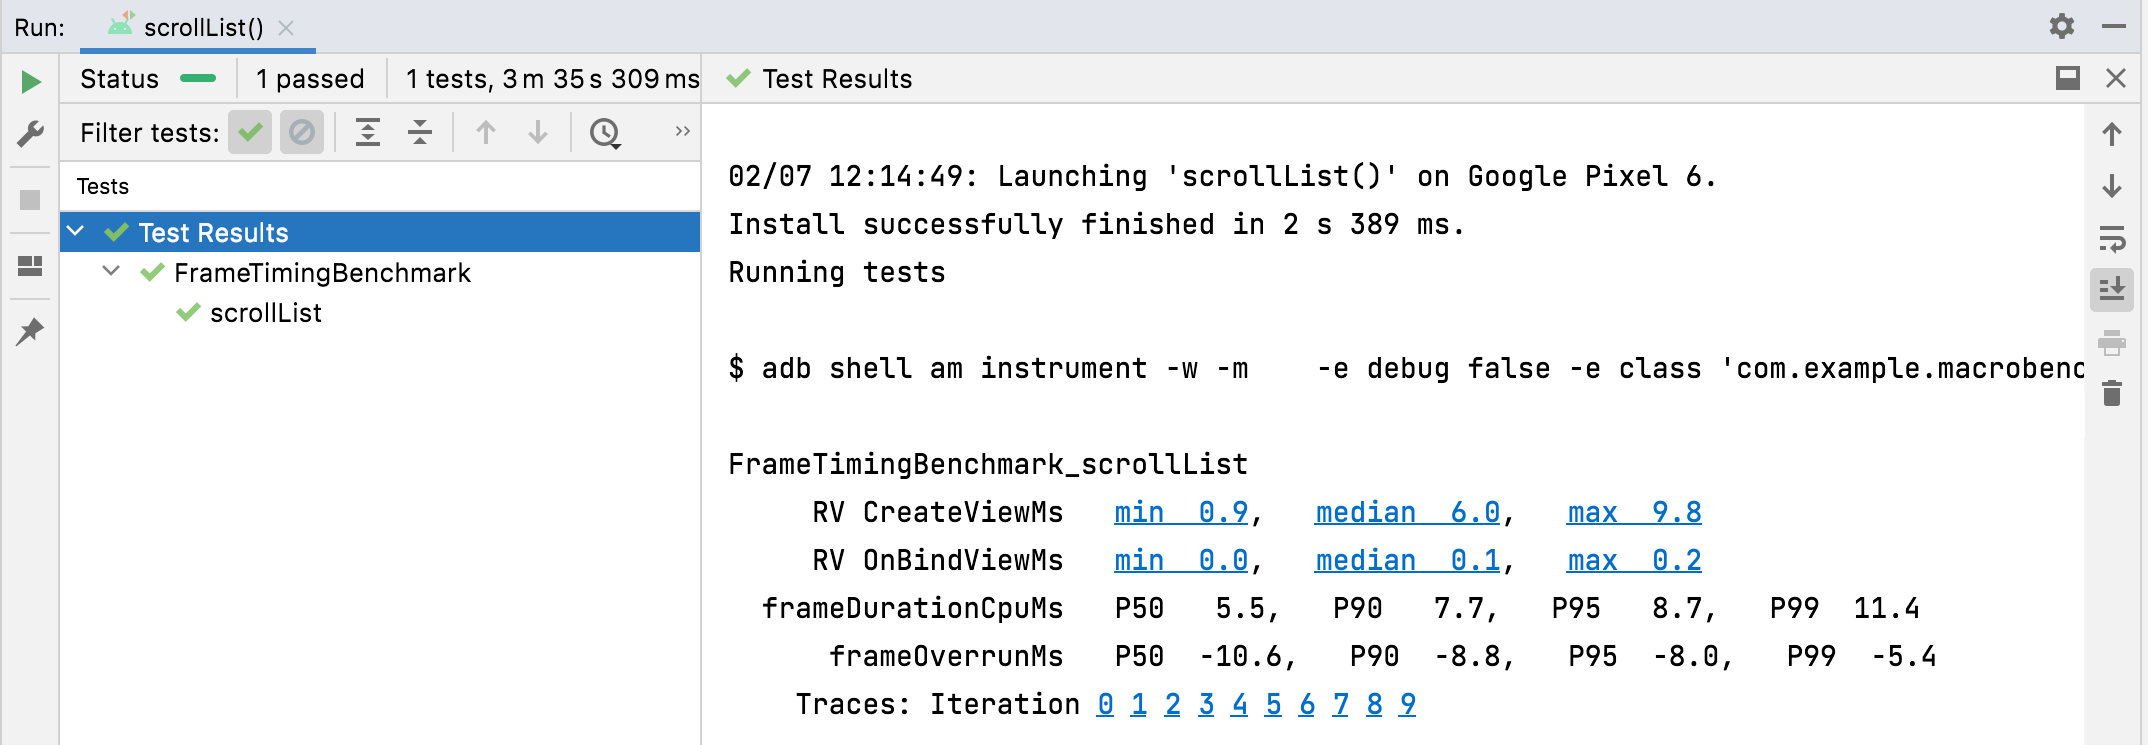
TraceSectionMetric 和 FrameTimingMetric 的结果。StartupTimingMetric
StartupTimingMetric 可捕获提供以下值的应用启动时间指标:
timeToInitialDisplayMs:从系统收到启动 intent 到渲染目标Activity的第一帧所用的时间。timeToFullDisplayMs:从系统收到启动 intent 到应用使用reportFullyDrawn()方法报告已完全绘制所用的时间。当跟随在reportFullyDrawn()调用之后或包含该调用的第一帧完成渲染时,测量即会停止。Android 10(API 级别 29)及更低版本可能不支持此测量功能。
StartupTimingMetric 会输出启动迭代的最小值、中位数值和最大值。如需评估启动方面的改进,您应重点关注中位数值,因为它们能够最准确地估算典型启动时间。如需详细了解影响应用启动时间的各个因素,请参阅应用启动时间。
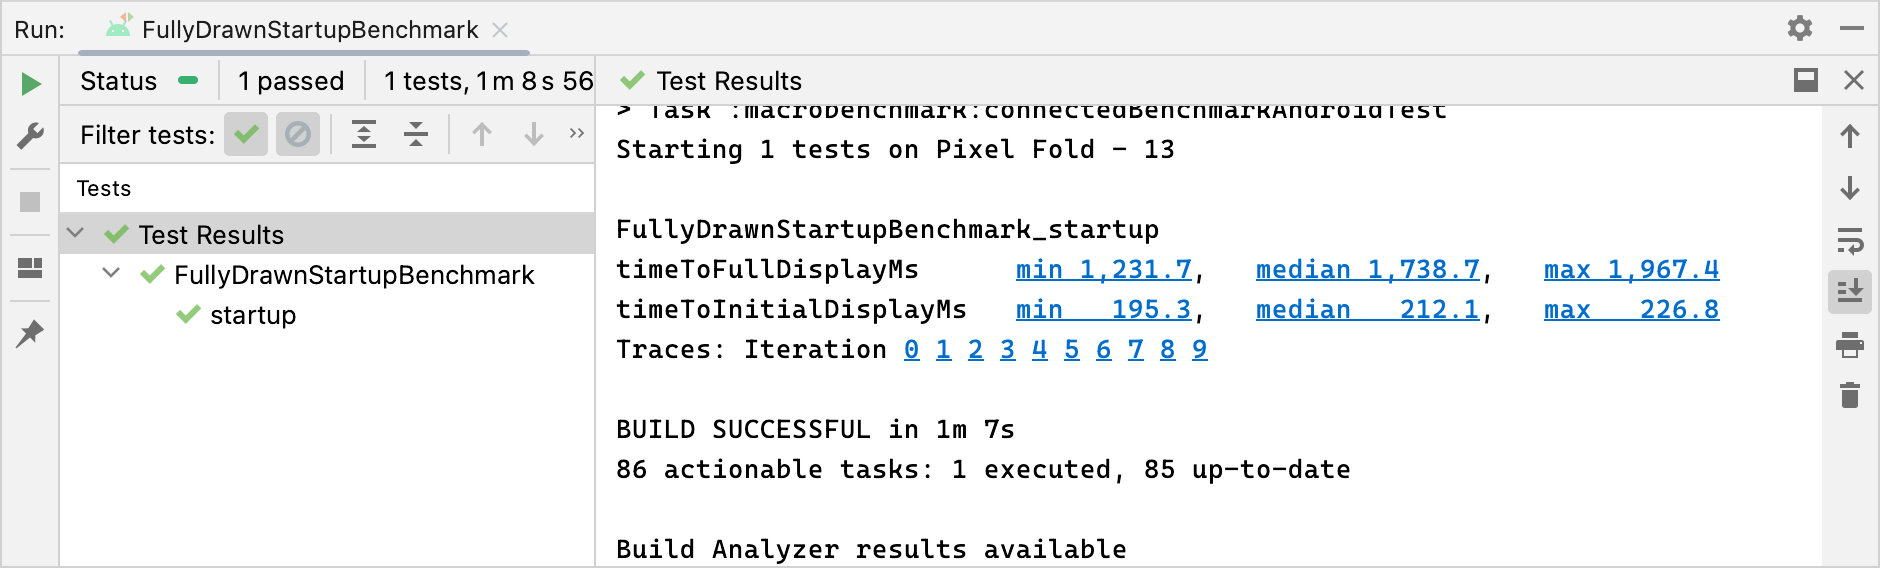
StartupTimingMetric 结果。FrameTimingMetric
FrameTimingMetric 会捕获基准测试所生成帧(如滚动或动画)的时间信息,并输出以下值:
frameOverrunMs:给定帧完全呈现用时与其呈现时限相差的时长。正数表示出现了丢帧和可见的卡顿。负数表示帧完全呈现用时比呈现时限少多少时间。注意:此指标仅适用于 Android 12(API 级别 31)及更高版本。frameDurationCpuMs:通过界面线程和RenderThread在 CPU 中生成帧所用的时间。
系统会收集分布在第 50 个、第 90 个、第 95 个和第 99 个百分位的以上测量值。
如需详细了解如何发现和改进呈现速度缓慢的帧,请参阅呈现速度缓慢。
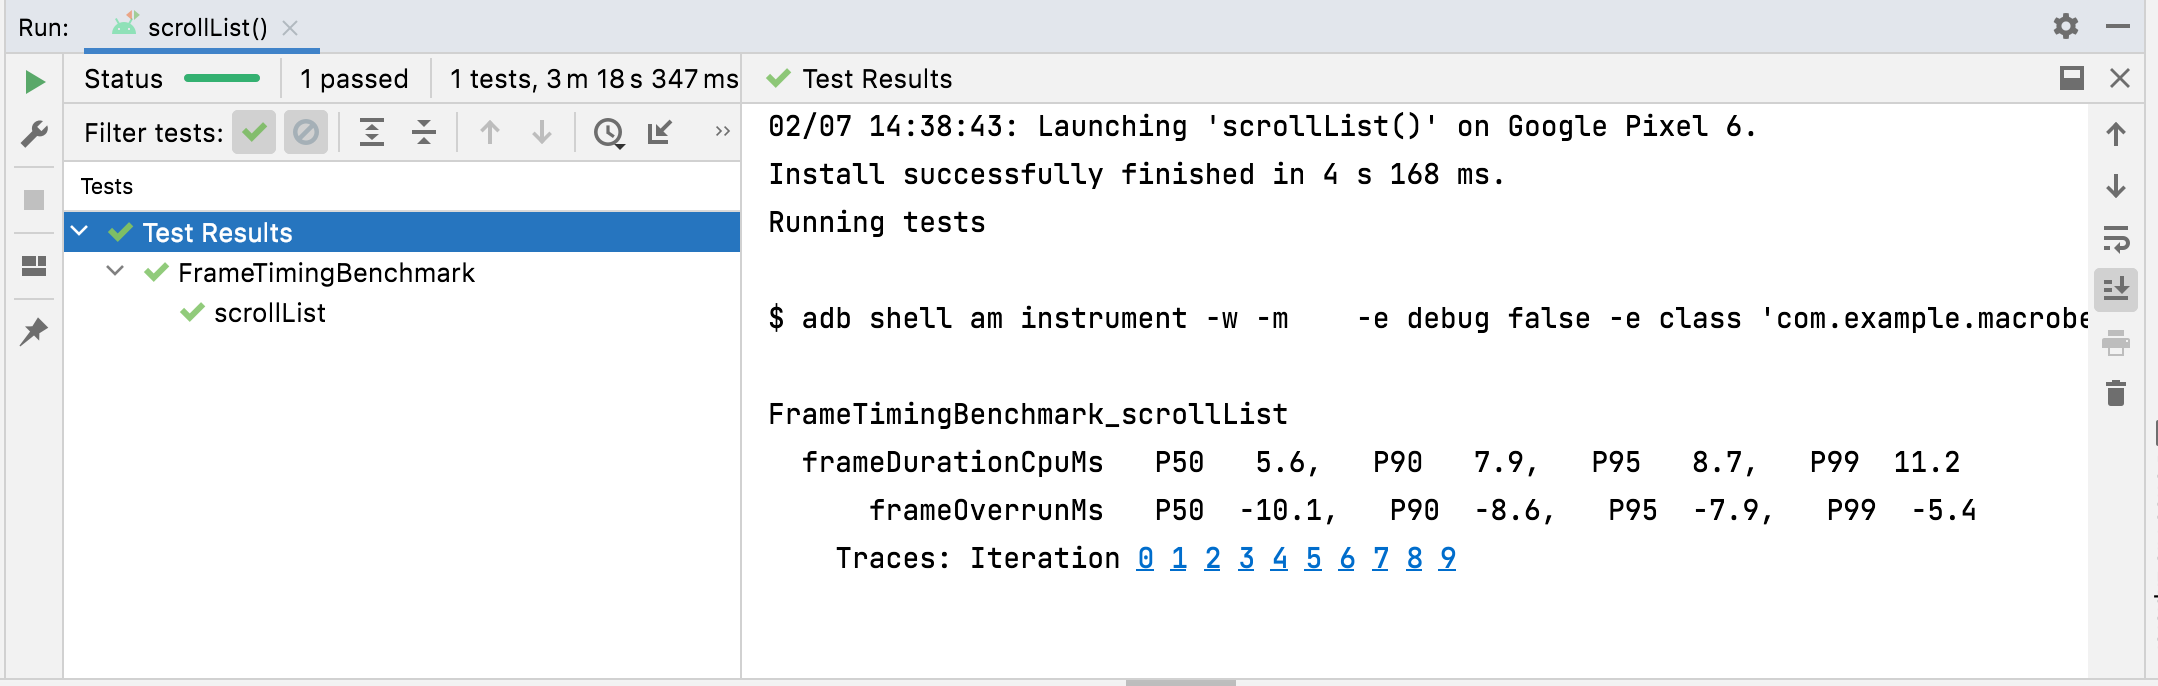
FrameTimingMetric 结果。TraceSectionMetric
TraceSectionMetric 会捕获与提供的 sectionName 匹配的轨迹部分发生的次数和所花费的时间。它会输出该时间的最小值、中位数和最大值(以毫秒为单位)。轨迹部分通过 trace(sectionName) 函数调用或者 Trace.beginSection(sectionName) 和 Trace.endSection() 之间的代码(或其异步变体之间的代码)来定义。该指标始终选择测量期间所捕获的第一个轨迹部分实例。默认情况下,它仅输出您的软件包中的轨迹部分;如需加入软件包以外的进程,请设置 targetPackageOnly = false。
如需详细了解如何进行跟踪,请参阅系统跟踪概览和定义自定义事件。
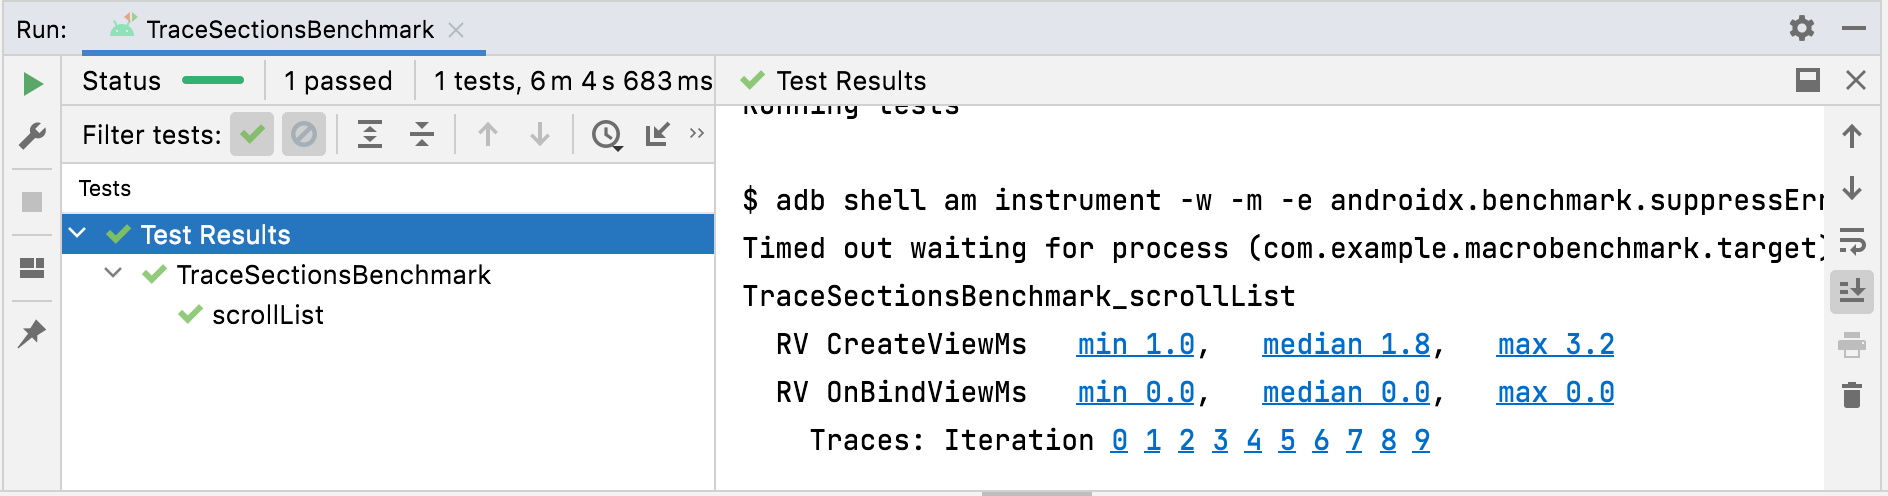
TraceSectionMetric 结果。PowerMetric
PowerMetric 会捕获所提供的电源类别在测试期间的耗电量或能量变化。
每个选定类别可拆分为多个可测量的子组件,未选择的类别则添加到“未选择”指标中。
以下指标测量的是系统级消耗,而不是每个应用的消耗,并且只适用于 Pixel 6、Pixel 6 Pro 及更新型号的设备:
power<category>Uw- 此类别在测试期间的耗电量。energy<category>Uws- 此类别在测试期间每单位时间传输的能量。
类别包括以下各项:
CPUDISPLAYGPUGPSMEMORYMACHINE_LEARNINGNETWORKUNCATEGORIZED
对于某些类别(如 CPU),可能很难将其他进程执行的工作与您自己的应用执行的工作区分开来。请移除或限制不必要的应用和账号,最大限度地减少干扰。
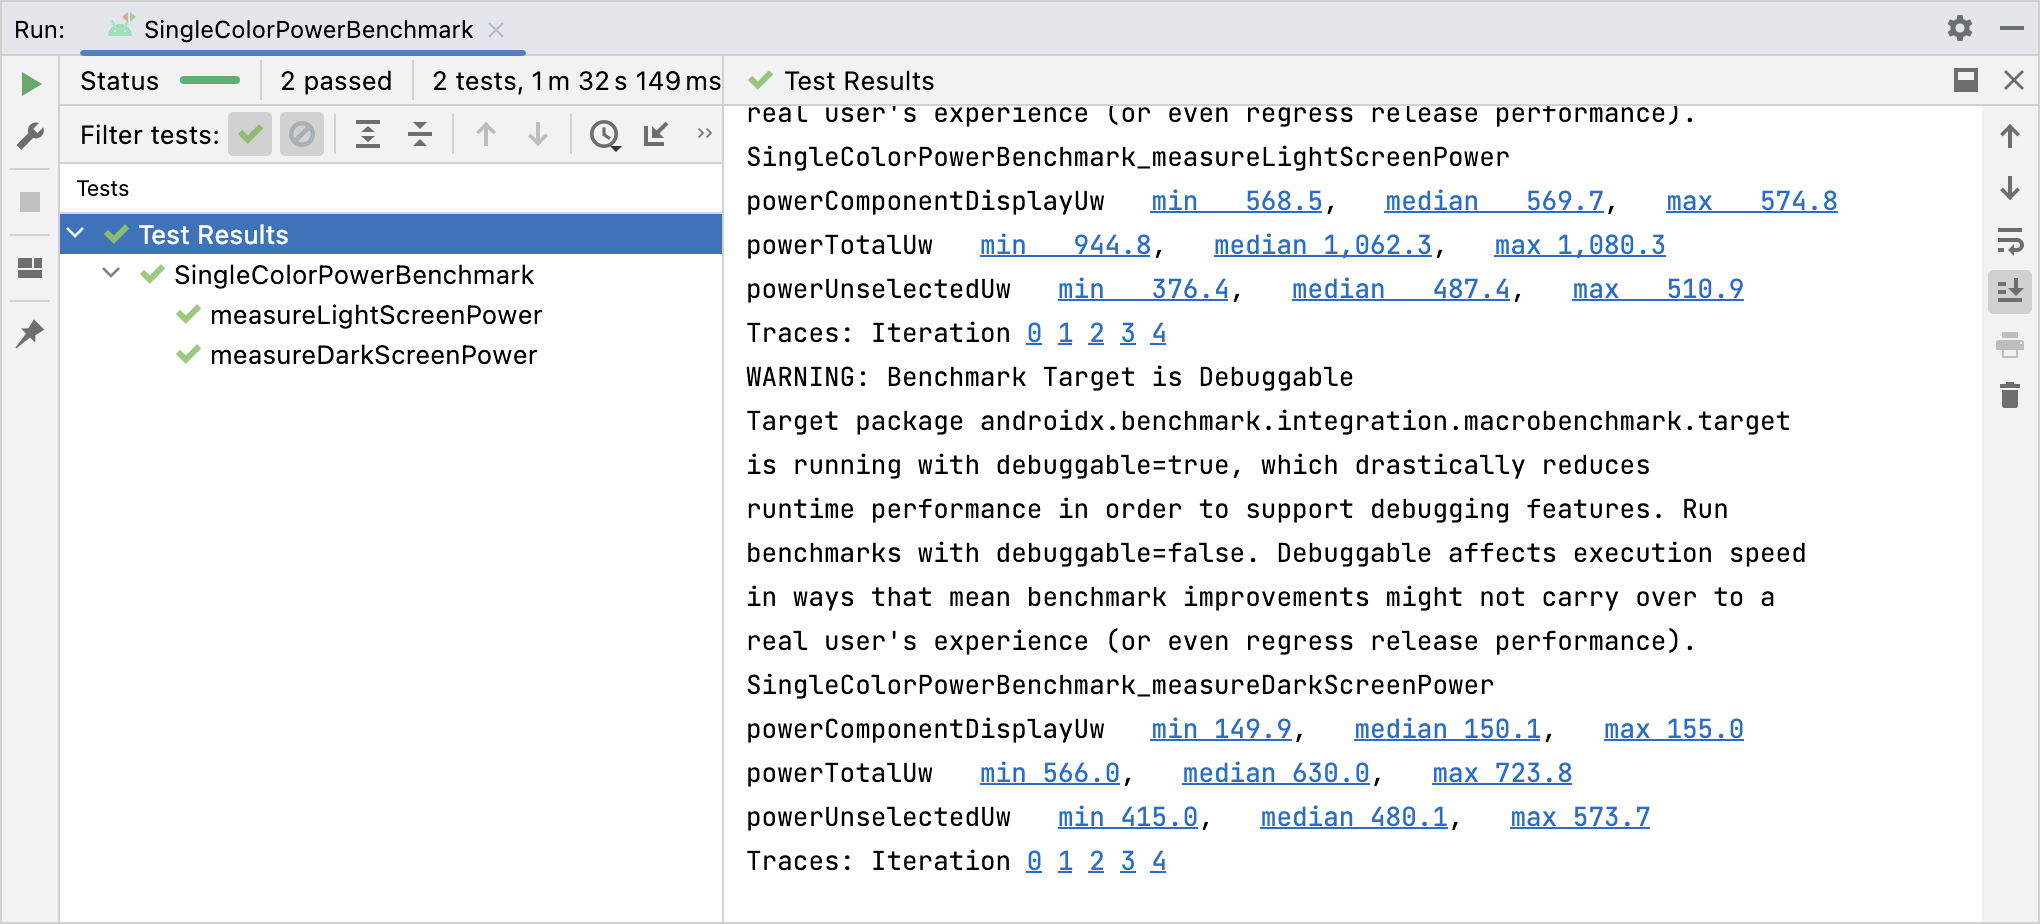
PowerMetric 结果。为您推荐
- 注意:当 JavaScript 处于关闭状态时,系统会显示链接文字
- 创建基准配置文件 {:#creating-profile-rules}
- 编写 Macrobenchmark
- 应用启动分析和优化 {:#app-startup-analysis-optimization}