
This section shows how to debug an Application Not Responding (ANR) using
ProfilingManager with an example trace.
Set up app to collect ANRs
Start by setting up an ANR trigger in your app:
public void addANRTrigger() { ProfilingManager profilingManager = getApplicationContext().getSystemService( ProfilingManager.class); List<ProfilingTrigger> triggers = new ArrayList<>(); ProfilingTrigger.Builder triggerBuilder = new ProfilingTrigger.Builder( ProfilingTrigger.TRIGGER_TYPE_ANR); triggers.add(triggerBuilder.build()); Executor mainExecutor = Executors.newSingleThreadExecutor(); Consumer<ProfilingResult> resultCallback = profilingResult -> { // Handle uploading trace to your back-end }; profilingManager.registerForAllProfilingResults(mainExecutor, resultCallback); profilingManager.addProfilingTriggers(triggers); }
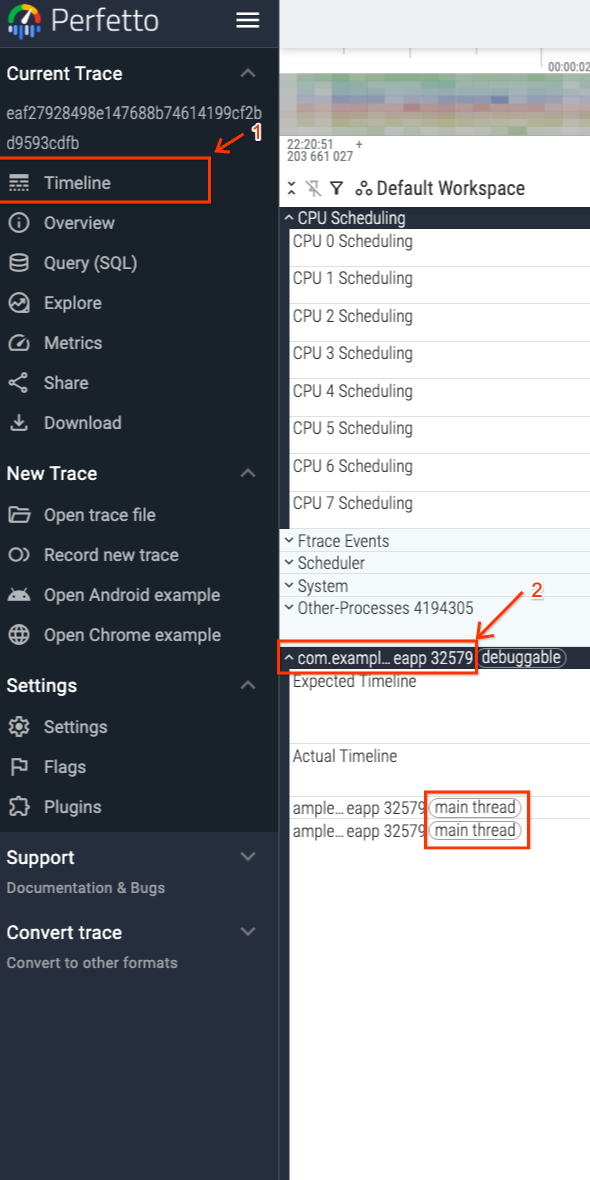
After capturing and uploading an ANR trace, open it in the Perfetto UI.
Analyze the trace
Because the ANR triggered the trace, you know the trace ended when the system detected unresponsiveness in your app's main thread. Figure 1 shows how to navigate to your app's main thread which is tagged accordingly within the UI.
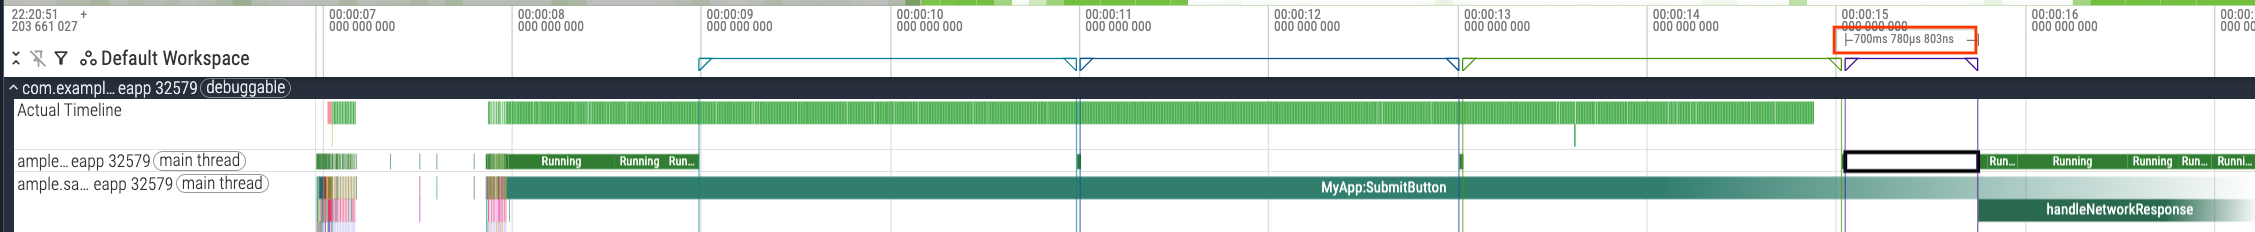
The end of the trace matches the ANR's timestamp, as shown in Figure 2.
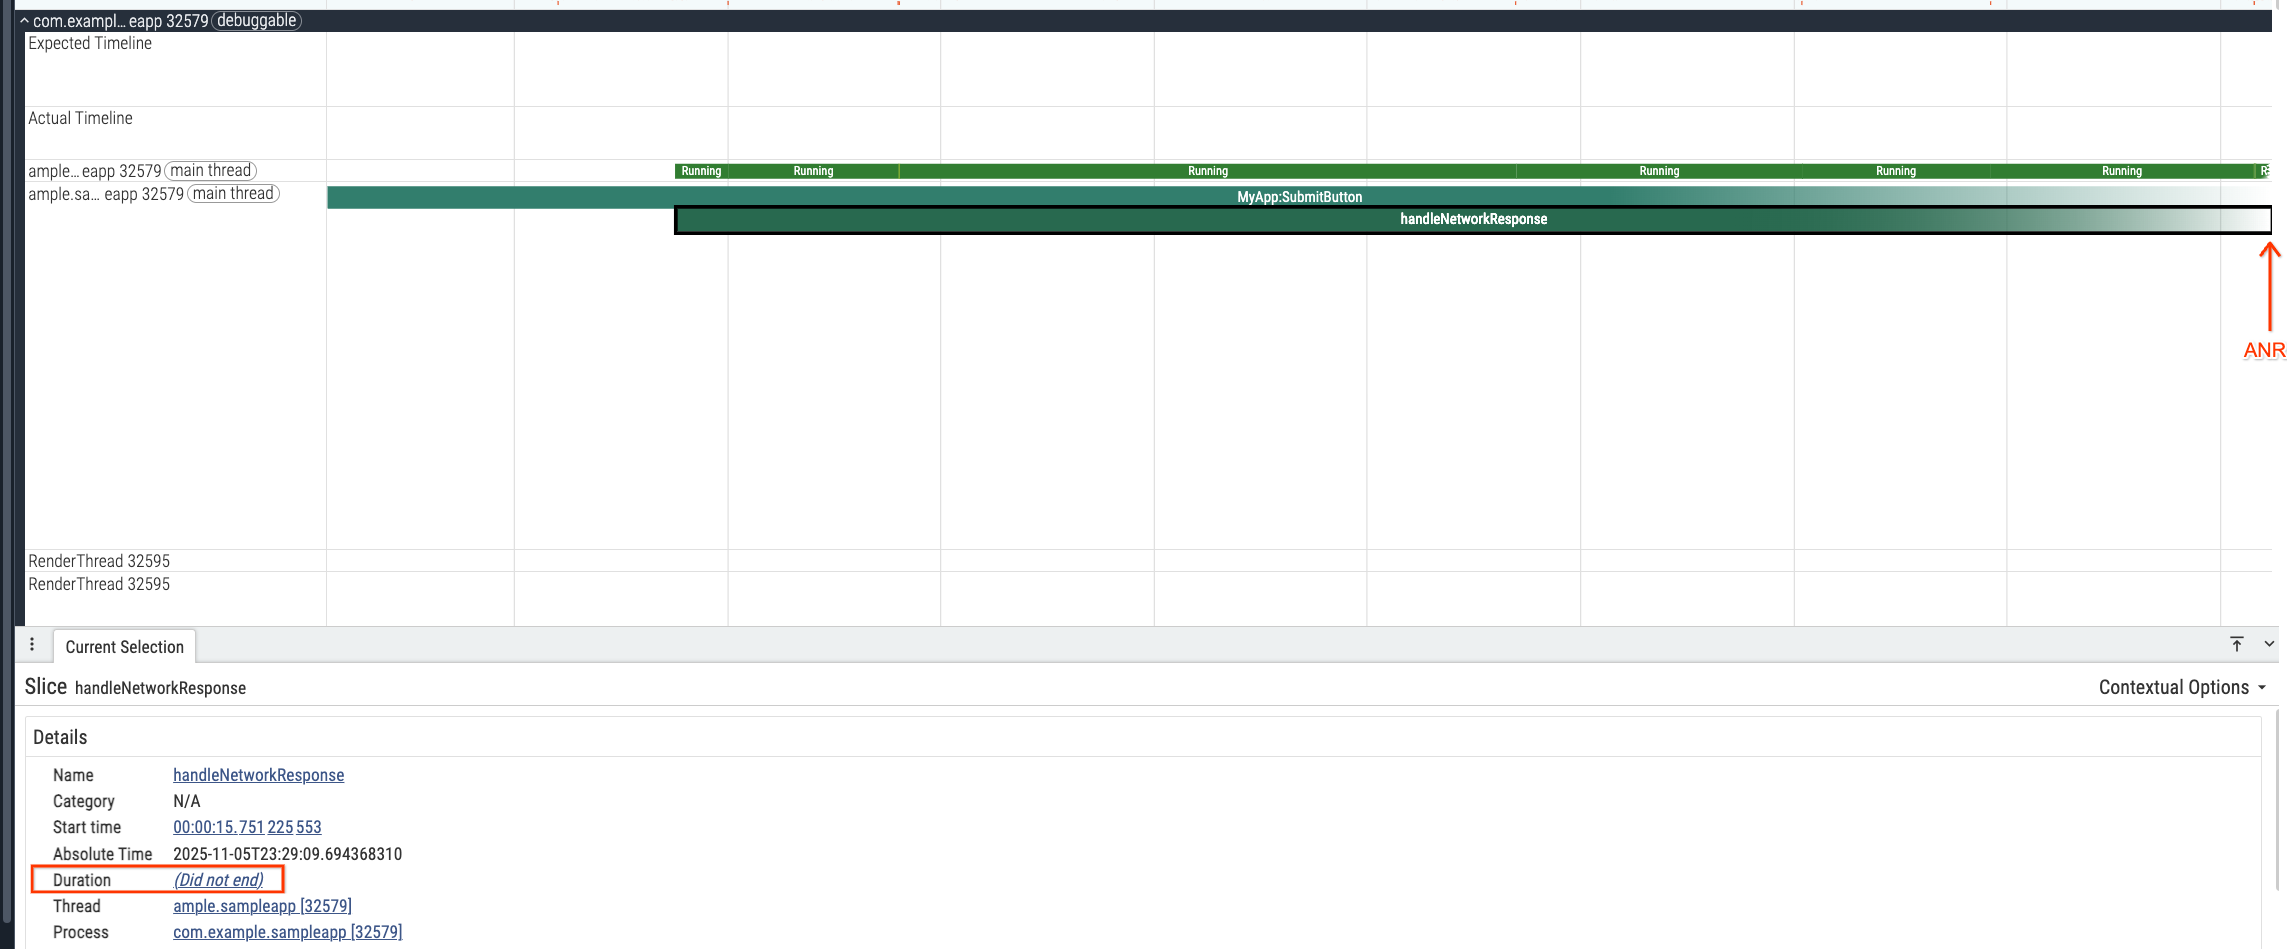
The trace also shows operations the app was running when the ANR occurred.
Specifically, the app ran code in the handleNetworkResponse trace slice. This
slice was inside the MyApp:SubmitButton slice. It used 1.48 seconds of CPU
time (Figure 3).
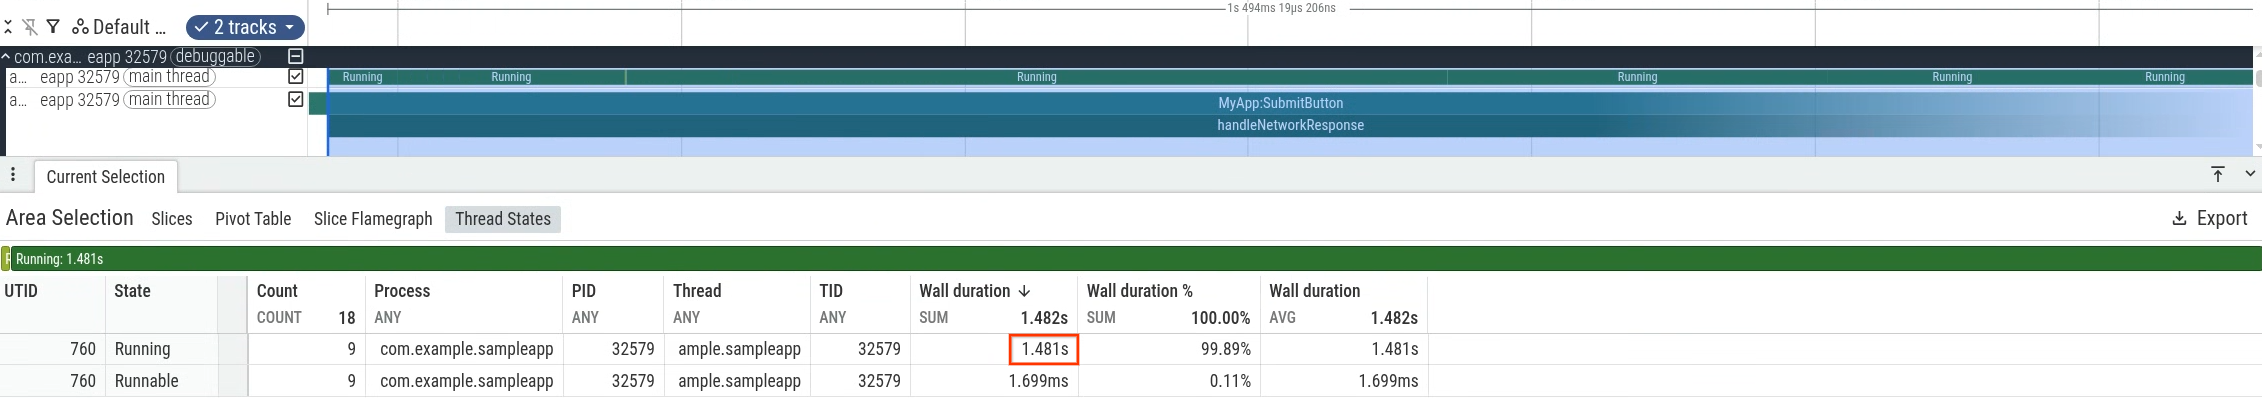
If you rely solely on stack traces at the moment of the ANR for debugging, you
might wrongly attribute the ANR entirely to the code running within
handleNetworkResponse trace slice which had not ended when the profile
finished recording. However,
1.48 seconds is insufficient to trigger an ANR on its own, even though it is an
expensive operation. You need to look further back in time to understand what
blocked the main thread before this method.
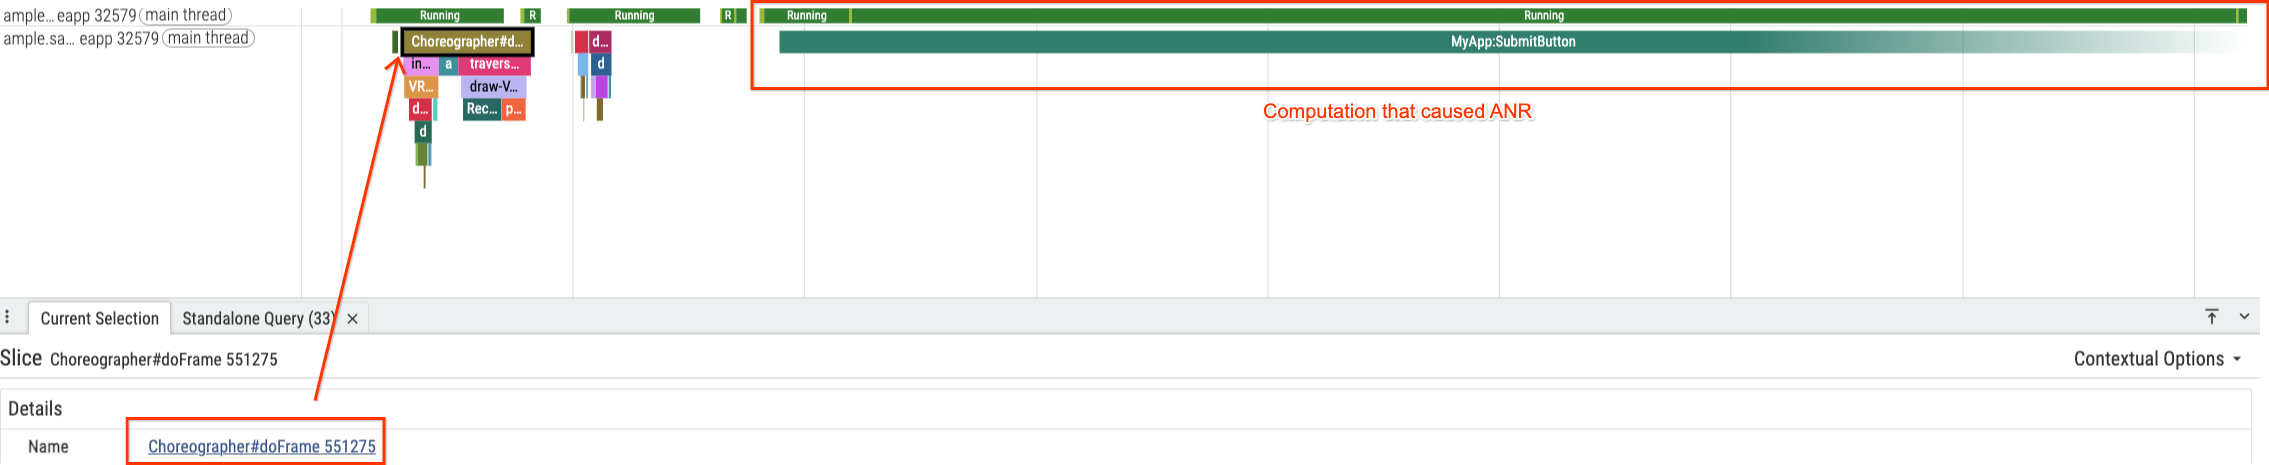
To grab a starting point to look for the cause for the ANR we start looking
after the last frame generated by the UI thread which corresponds to
Choreographer#doFrame 551275 slice and there aren't big sources of delay prior
to starting the MyApp:SubmitButton slice that ended in the ANR (Figure 4).
To understand the blockage, zoom out to inspect the full MyApp:SubmitButton
slice. You will notice a critical detail in the thread states, as shown in
Figure 4: the thread spent 75% of the time (6.7 seconds) in Sleeping state
and only 24% of the time in Running state.
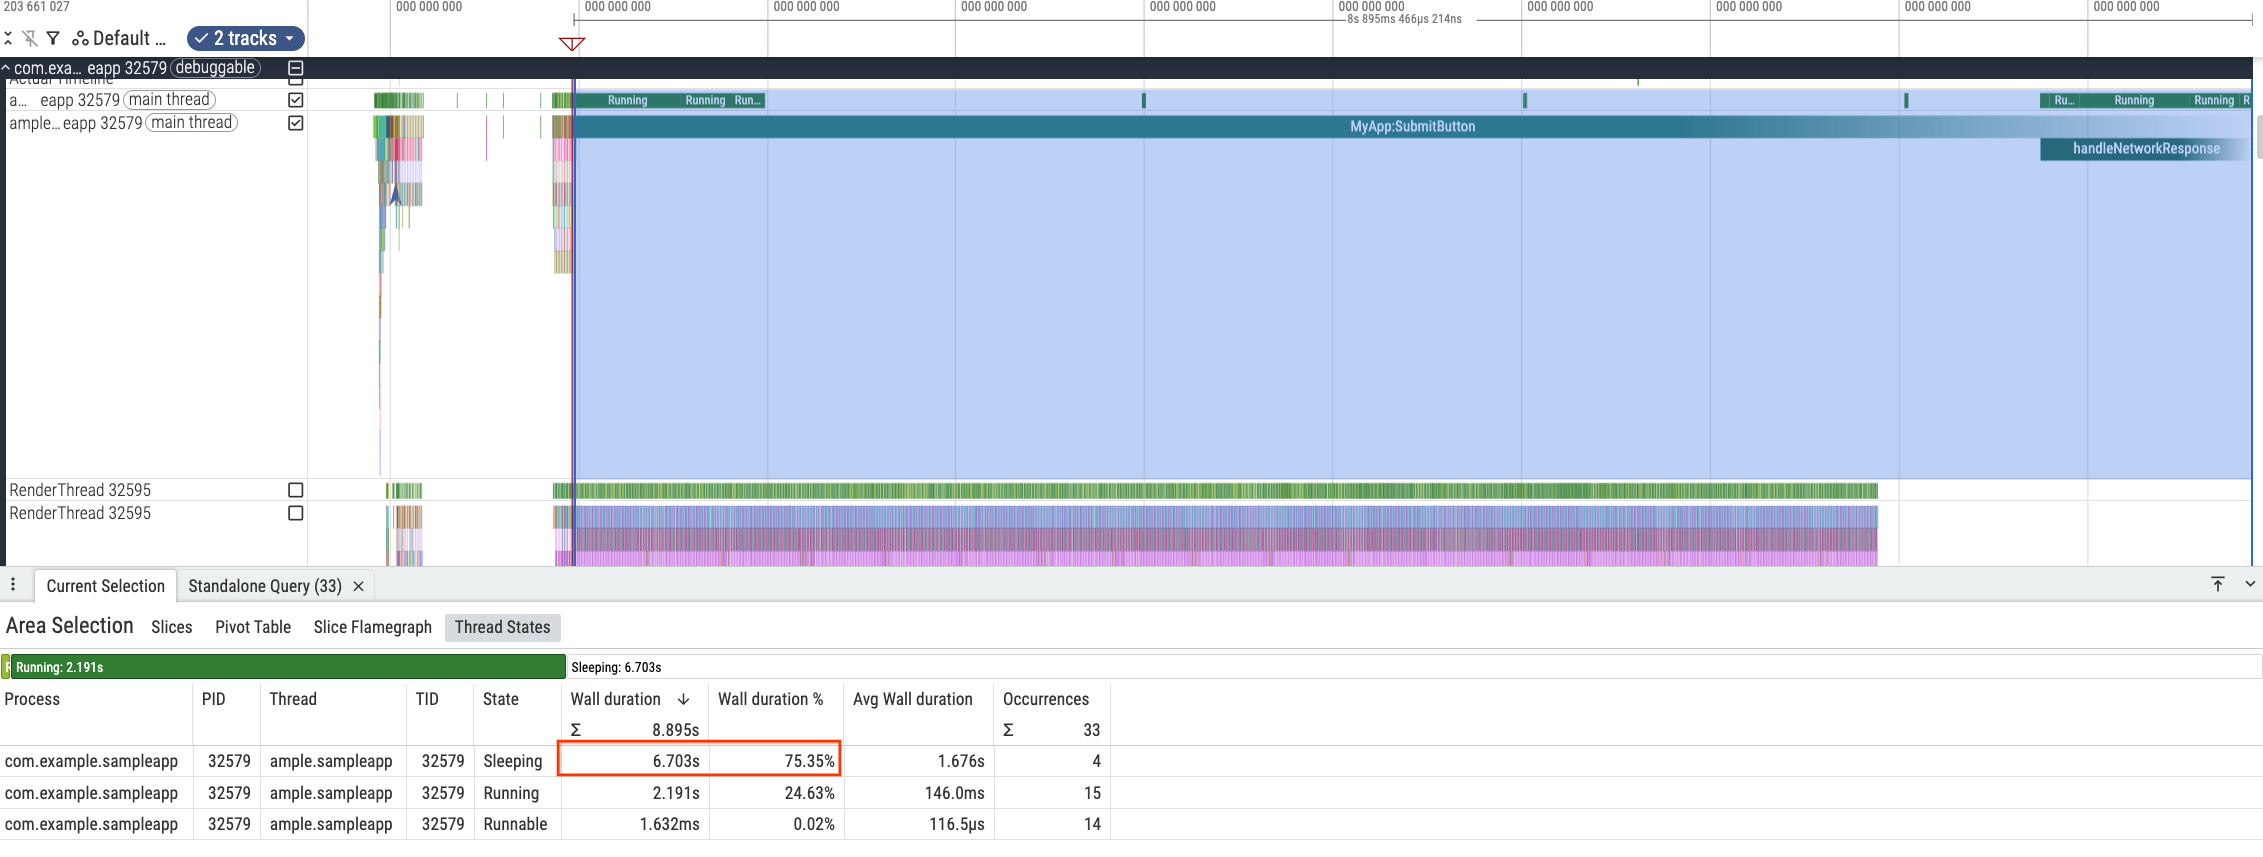
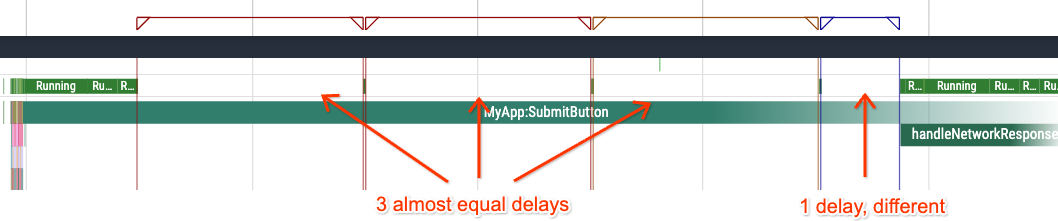
This indicates that the primary cause of the ANR was waiting, not computation. Examine the individual sleep occurrences to find a pattern.
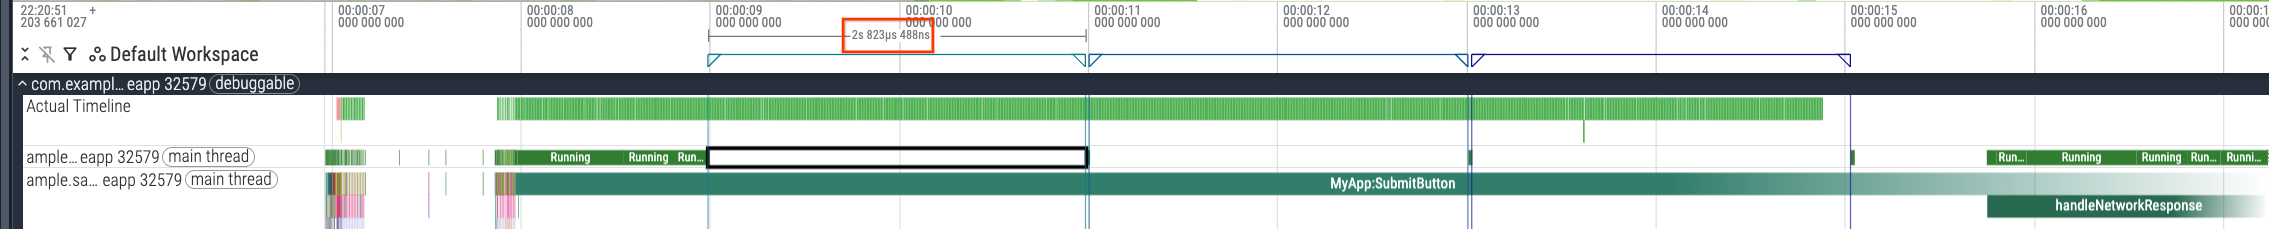
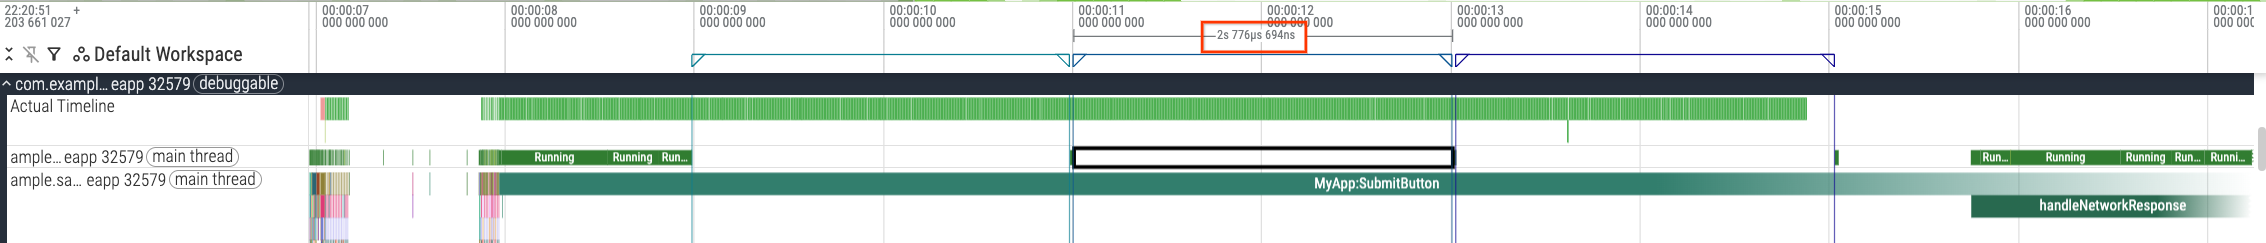
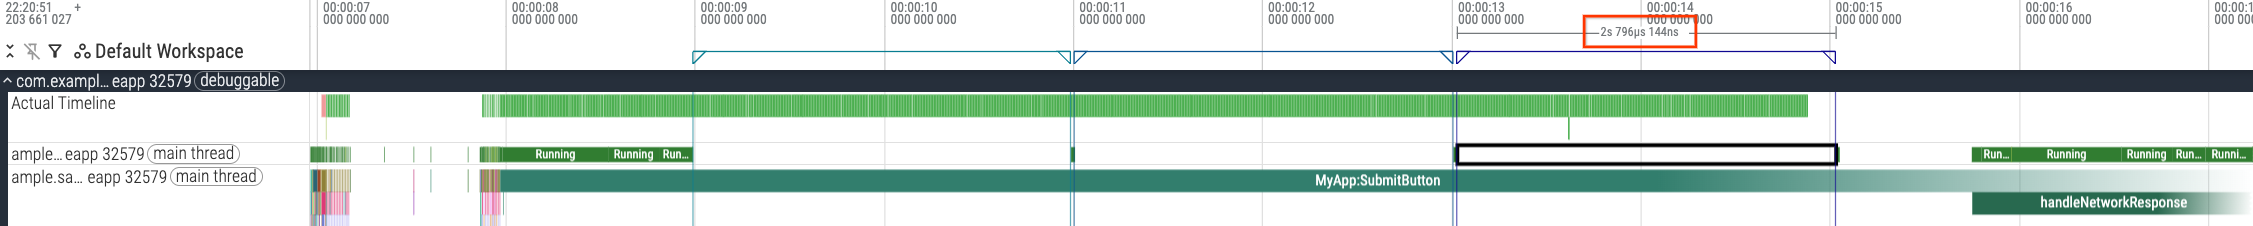
The first three sleep intervals (Figures 6–8) are nearly identical, approximately 2 seconds each. An outlier fourth sleep (Figure 9) is 0.7 seconds. A duration of exactly 2 seconds is rarely a coincidence in a computing environment. This strongly suggests a programmed timeout rather than random resource contention. The last sleep might be caused by the thread finishing its wait because the operation it was waiting on succeeded.
This hypothesis is that the app was hitting a user-defined timeout of 2 seconds multiple times and eventually succeeding, causing enough delay to trigger an ANR.
To verify this, inspect the code associated with the MyApp:SubmitButton trace
section:
private static final int NETWORK_TIMEOUT_MILLISECS = 2000; public void setupButtonCallback() { findViewById(R.id.submit).setOnClickListener(submitButtonView -> { Trace.beginSection("MyApp:SubmitButton"); onClickSubmit(); Trace.endSection(); }); } public void onClickSubmit() { prepareNetworkRequest(); boolean networkRequestSuccess = false; int maxAttempts = 10; while (!networkRequestSuccess && maxAttempts > 0) { networkRequestSuccess = performNetworkRequest(NETWORK_TIMEOUT_MILLISECS); maxAttempts--; } if (networkRequestSuccess) { handleNetworkResponse(); } } boolean performNetworkRequest(int timeoutMiliseconds) { // ... } void prepareNetworkRequest() { // ... } public void handleNetworkResponse() { Trace.beginSection("handleNetworkResponse"); // ... Trace.endSection(); }
The code confirms this hypothesis. The onClickSubmit method executes a network
request on the UI thread with a hardcoded NETWORK_TIMEOUT_MILLISECS of 2000ms.
Crucially, it runs inside a while loop that retries up to 10 times.
In this specific trace, the user likely had poor network connectivity. The first
three attempts failed, causing three 2-second timeouts (a total of 6 seconds).
The fourth attempt succeeded after 0.7 seconds, allowing the code to proceed to
handleNetworkResponse. However, the accumulated wait time already triggered
the ANR.
Avoid this type of ANR by putting network-related operations that have varying latencies into a background thread instead of executing them in the main thread. This allows the UI to remain responsive even with poor connectivity, completely eliminating this class of ANRs.