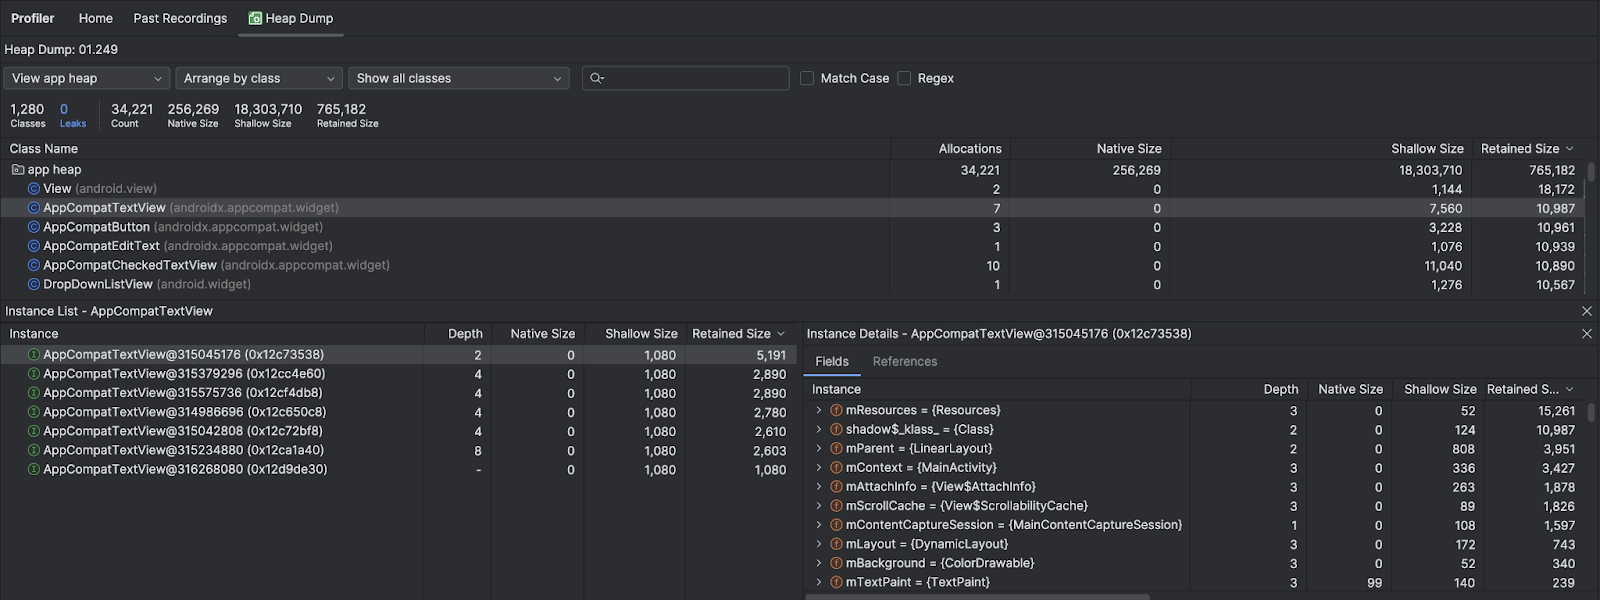
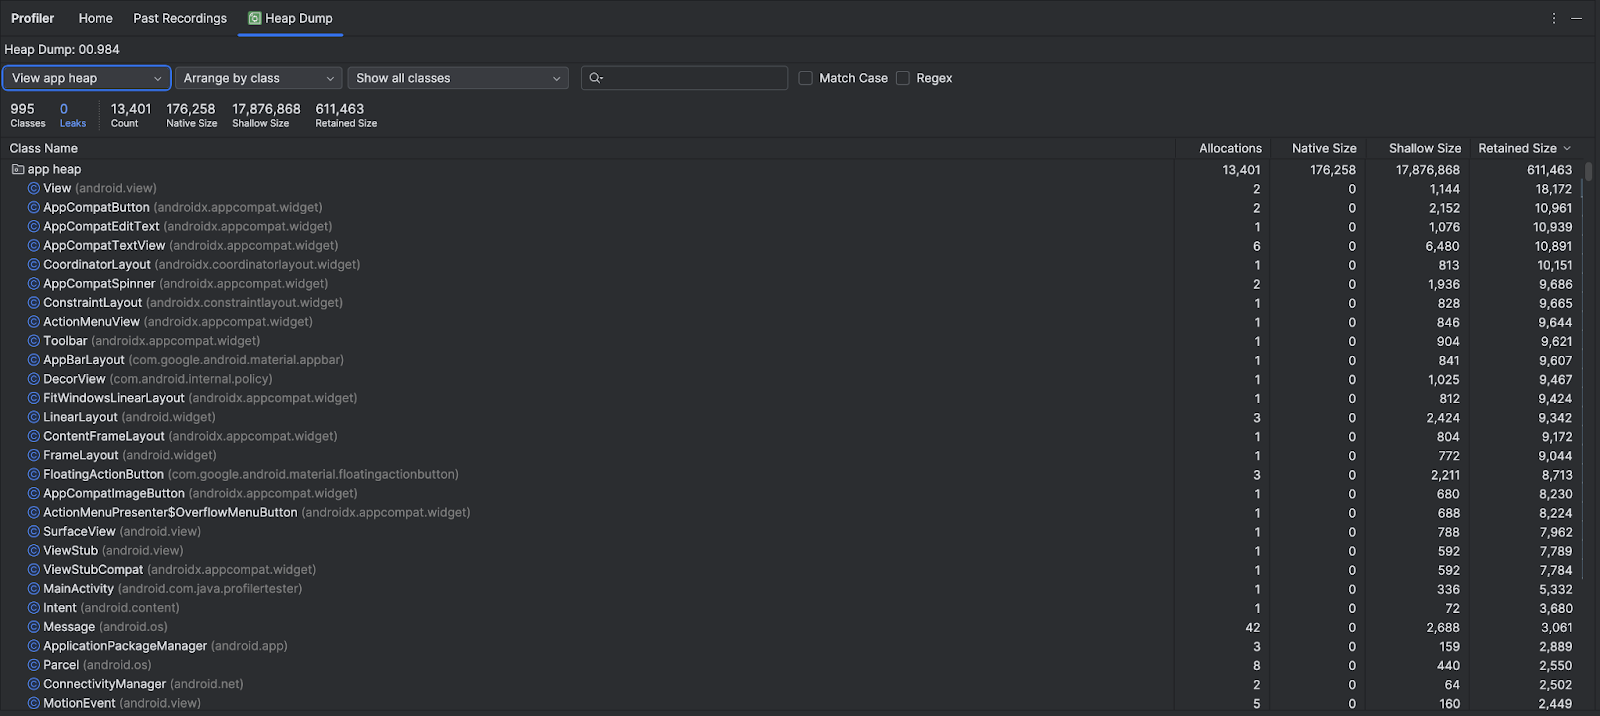
[null,null,["最后更新时间 (UTC):2025-07-27。"],[],[],null,["# Capture a heap dump to see which objects in your app are using up memory at the\ntime of the capture and identify *memory leaks*, or memory allocation behavior\nthat leads to stutter, freezes, and even app crashes. It's especially helpful to\ntake heap dumps after an extended user session, when it could show objects still\nin memory that should no longer be there.\n\nThis page describes the tooling that Android Studio provides to collect and\nanalyze heap dumps. Alternatively, you can inspect your app memory from the\ncommand line with [`dumpsys`](/studio/command-line/dumpsys) and also [see\ngarbage collection (GC) events in Logcat](/studio/debug/logcat).\n\nWhy you should profile your app memory\n--------------------------------------\n\nAndroid provides a [managed memory\nenvironment](/topic/performance/memory-overview)---when Android determines that\nyour app is no longer using some objects, the garbage collector releases the\nunused memory back to the heap. How Android goes about finding unused memory is\nconstantly being improved, but at some point on all Android versions, the system\nmust briefly pause your code. Most of the time, the pauses are imperceivable.\nHowever, if your app allocates memory faster than the system can collect it,\nyour app might be delayed while the collector frees enough memory to satisfy\nyour allocations. The delay could cause your app to skip frames and cause\nvisible slowness.\n\nEven if your app doesn't exhibit slowness, if it leaks memory, it can retain\nthat memory even while it's in the background. This behavior can slow the rest\nof the system's memory performance by forcing unnecessary garbage collection\nevents. Eventually, the system is forced to kill your app process to reclaim the\nmemory. Then when the user returns to your app, the app process must restart\ncompletely.\n\nFor information about programming practices that can reduce your app's memory\nuse, read [Manage your app's memory](/topic/performance/memory).\n\nHeap dump overview\n------------------\n\nTo capture a heap dump,\n[select the **Analyze Memory Usage (Heap Dump)** task](/studio/profile#start-profiling)\n(use **Profiler: run 'app' as debuggable (complete data)**) to capture a heap\ndump. While dumping the heap, the amount of Java memory might increase\ntemporarily. This is normal because the heap dump occurs in the same process as\nyour app and requires some memory to collect the data. After you capture the\nheap dump, you see the following:\n| **Note:** If you need to be more precise about when the dump is created, you can create a heap dump at the critical point in your app code by calling [`dumpHprofData()`](/reference/android/os/Debug#dumpHprofData(java.lang.String)).\n\nThe list of classes shows the following info:\n\n- **Allocations**: Number of allocations in the heap.\n- **Native Size** : Total amount of native memory used by this object type (in\n bytes). You will see memory here for some objects allocated in Java because\n Android uses native memory for some framework classes, such as\n [`Bitmap`](/reference/android/graphics/Bitmap).\n\n | **Note:** The **Native Size** column isn't available for devices running OS versions lower than Android 7.0.\n- **Shallow Size**: Total amount of Java memory used by this object type (in\n bytes).\n\n- **Retained Size**: Total size of memory being retained due to all instances of\n this class (in bytes).\n\nUse the heap menu to filter to certain heaps:\n\n- **App heap (default)**: The primary heap on which your app allocates memory.\n- **Image heap**: The system boot image, containing classes that are preloaded during boot time. Allocations here never move or go away.\n- **Zygote heap**: The copy-on-write heap where an app process is forked from in the Android system.\n\nUse the arrangement drop-down to choose how to arrange the allocations:\n\n- **Arrange by class (default)**: Groups all allocations based on class name.\n- **Arrange by package**: Groups all allocations based on package name.\n\nUse the class drop-down to filter to groups of classes:\n\n- **All classes (default)**: Shows all classes, including those from libraries and dependencies.\n- **Show activity/fragment leaks**: Shows classes that are causing memory leaks.\n- **Show project classes**: shows only classes defined by your project.\n\nClick a class name to open the **Instance** pane. Each instance listed includes\nthe following:\n\n- **Depth**: The shortest number of hops from any GC root to the selected instance.\n- **Native Size**: Size of this instance in native memory. This column is visible only for Android 7.0 and higher.\n- **Shallow Size**: Size of this instance in Java memory.\n- **Retained Size** : Size of memory that this instance dominates (as per the [dominator tree](https://en.wikipedia.org/wiki/Dominator_(graph_theory))).\n\nClick an instance to show the **Instance Details** , including its **Fields**\nand **References** . Common field and reference types are structured types\n,\narrays\n,\nand primitive data types\n\nin Java. Right-click on a field or reference to go to the associated instance or\nline in the source code.\n\n- **Fields**: Shows all the fields in this instance.\n- **References** : Shows every reference to the object highlighted in the **Instance** tab.\n\nFind memory leaks\n-----------------\n\nTo quickly filter to classes that might be associated with memory leaks, open\nthe class drop-down and select **Show activity/fragment leaks** . Android Studio\nshows classes that it thinks indicate memory leaks for\n[`Activity`](/reference/android/app/Activity) and\n[`Fragment`](/reference/android/app/Fragment) instances in your app. The types\nof data that the filter shows include the following:\n\n- `Activity` instances that have been destroyed but are still being referenced.\n- `Fragment` instances that don't have a valid [`FragmentManager`](/reference/android/app/FragmentManager) but are still being referenced.\n\nBe aware that the filter might yield false positives in the following\nsituations:\n\n- A `Fragment` is created but has not yet been used.\n- A `Fragment` is being cached but not as part of a [`FragmentTransaction`](/reference/android/app/FragmentTransaction).\n\nTo look for memory leaks more manually, browse the class and instance lists to\nfind objects with large **Retained Size**. Look for memory leaks caused by any\nof the following:\n\n- Long-lived references to [`Activity`](/reference/android/app/Activity), [`Context`](/reference/android/content/Context), [`View`](/reference/android/view/View), [`Drawable`](/reference/android/graphics/drawable/Drawable), and other objects that might hold a reference to the `Activity` or `Context` container.\n- Non-static inner classes, such as a [`Runnable`](/reference/java/lang/Runnable), that can hold an `Activity` instance.\n- Caches that hold objects longer than necessary.\n\nWhen you find potential memory leaks, use the **Fields** and **References** tabs\nin **Instance Details** to jump to the instance or source code line of interest.\n\n### Trigger memory leaks for testing\n\nTo analyze memory usage, you should stress your app code and try forcing memory\nleaks. One way to provoke memory leaks in your app is to let it run for a while\nbefore inspecting the heap. Leaks might trickle up to the top of the allocations\nin the heap. However, the smaller the leak, the longer you need to run the app\nin order to see it.\n\nYou can also trigger a memory leak in one of the following ways:\n\n- Rotate the device from portrait to landscape and back again multiple times while in different activity states. Rotating the device can often cause an app to leak an [`Activity`](/reference/android/app/Activity), [`Context`](/reference/android/content/Context), or [`View`](/reference/android/view/View) object because the system recreates the `Activity`, and if your app holds a reference to one of those objects somewhere else, the system can't garbage collect it.\n- Switch between your app and another app while in different activity states. For example, navigate to the home screen, then return to your app.\n\n| **Tip:** You can also conduct UI testing using [App Crawler](/studio/test/other-testing-tools/app-crawler) or [UI Automator](/training/testing/other-components/ui-automator).\n\nExport and import a heap dump recording\n---------------------------------------\n\nYou can\n[export and import](/studio/profile#compare-export-import-traces) a heap dump\nfile from the **Past Recordings** tab in the profiler. Android Studio saves the\nrecording as an `.hprof` file.\n\nAlternatively, to use a different `.hprof` file analyzer like\n[jhat](https://docs.oracle.com/javase/8/docs/technotes/tools/unix/jhat.html),\nyou need to convert the `.hprof` file from Android format to the Java SE\n`.hprof` file format. To convert the file format, use the `hprof-conv` tool\nprovided in the `{android_sdk}/platform-tools/` directory. Run the `hprof-conv`\ncommand with two arguments: the original `.hprof` filename and the location to\nwrite the converted `.hprof` file, including the new `.hprof` filename. For\nexample: \n\n hprof-conv heap-original.hprof heap-converted.hprof"]]

 、数组
、数组  和基元数据类型
  。右键点击某个字段或引用以转到关联的实例,或者
代码行。
。右键点击某个字段或引用以转到关联的实例,或者
代码行。