
您可以直接在 Android Studio 中查看 Firebase Crashlytics 和 Android Vitals 提供的应用崩溃数据并采取措施。这项集成功能会将堆栈轨迹数据和崩溃统计信息从 Crashlytics 和 Google Play 提取到 Studio IDE 中的 App Quality Insights 工具窗口内,因此您无需在浏览器和 IDE 之间来回切换。开发团队可以受益于以下关键功能:
- 在代码行有相关的 Crashlytics 事件数据时,查看突出显示的代码行。
- 查看主要崩溃的堆栈轨迹,然后点击堆栈轨迹以跳转到代码中的相关行。
- 查看有关主要崩溃和非严重事件的摘要统计信息,例如按设备制造商和 Android 版本分组的信息。
- 按严重性、时间和应用版本等属性过滤事件。
- 获取一个浏览器链接,用于打开 Crashlytics 信息中心,其中包含有关该事件的更多详细信息。
- 获取有助于您更轻松地了解和解决某些问题的根本原因的分析洞见。
所有发布到 Google Play 的应用都可以使用 Android Vitals 报告。如果您尚未使用 Crashlytics,但想要详细了解其功能,请参阅 Firebase Crashlytics。
开始使用
如要在 Android Studio 中查看 Crashlytics 数据,您需要在应用项目中设置 Firebase 和 Crashlytics。具体方法如下:在 Android Studio 中,通过依次点击 Tools > Firebase 打开 Firebase Assistant,点击 Crashlytics,然后按照教程为您的项目添加 Firebase 和 Crashlytics。如需详细了解 Firebase Assistant 工作流,请参阅适用于 Android 的 Firebase 入门指南。
如果您已经将 Firebase 和 Crashlytics 添加到您的应用,请点击头像图标 ![]() ,在 IDE 中登录您的开发者账号。
登录后,点击 App Quality Insights 工具窗口
,在 IDE 中登录您的开发者账号。
登录后,点击 App Quality Insights 工具窗口 ![]() 。您应该会看到面板填充了 Crashlytics 中的报告。
。您应该会看到面板填充了 Crashlytics 中的报告。
分析 Android Vitals
App Quality Insights 包含 Android Vitals 数据。这样,您就可以更轻松地访问 Google Play 收集的核心指标并提升用户体验。您可以使用 Android Vitals 解决与应用稳定性相关的问题,以帮助提升应用在 Google Play 中展示的质量。
您可以在 App Quality Insights 工具窗口中集中查看 Android Vitals 问题、过滤问题,以及从堆栈轨迹跳转到代码。如要开始使用,请按以下步骤操作:
- 在 Android Studio 中,通过工具栏末尾的个人资料图标
 登录您的开发者账号。
 - 点击 Android Studio 中的工具窗口或依次点击 View > Tool Windows > App Quality Insights 以打开 App Quality Insights。
- 点击 App Quality Insights 中的 Android Vitals 标签页。
可选:如需将版本控制集成用于可调试的 build,请将最新的 Firebase Crashlytics SDK(或 Firebase Android 物料清单)添加到您的应用中。然后,将以下代码添加到模块级
build.gradle.kts或build.gradle文件中。发布(不可调试)build 默认启用该标志。
Kotlin
android {
  buildTypes {
    getByName("debug") {
      vcsInfo {
        include = true
      }
    }
  }
}
Groovy
android {
  buildTypes {
    debug {
      vcsInfo {
        include true
      }
    }
  }
}
在 Android Studio 中分析 Crashlytics 数据
App Quality Insights 工具窗口包含丰富的数据,可让您深入了解用户遇到的事件,并提供可快速前往查看事件来源的链接。
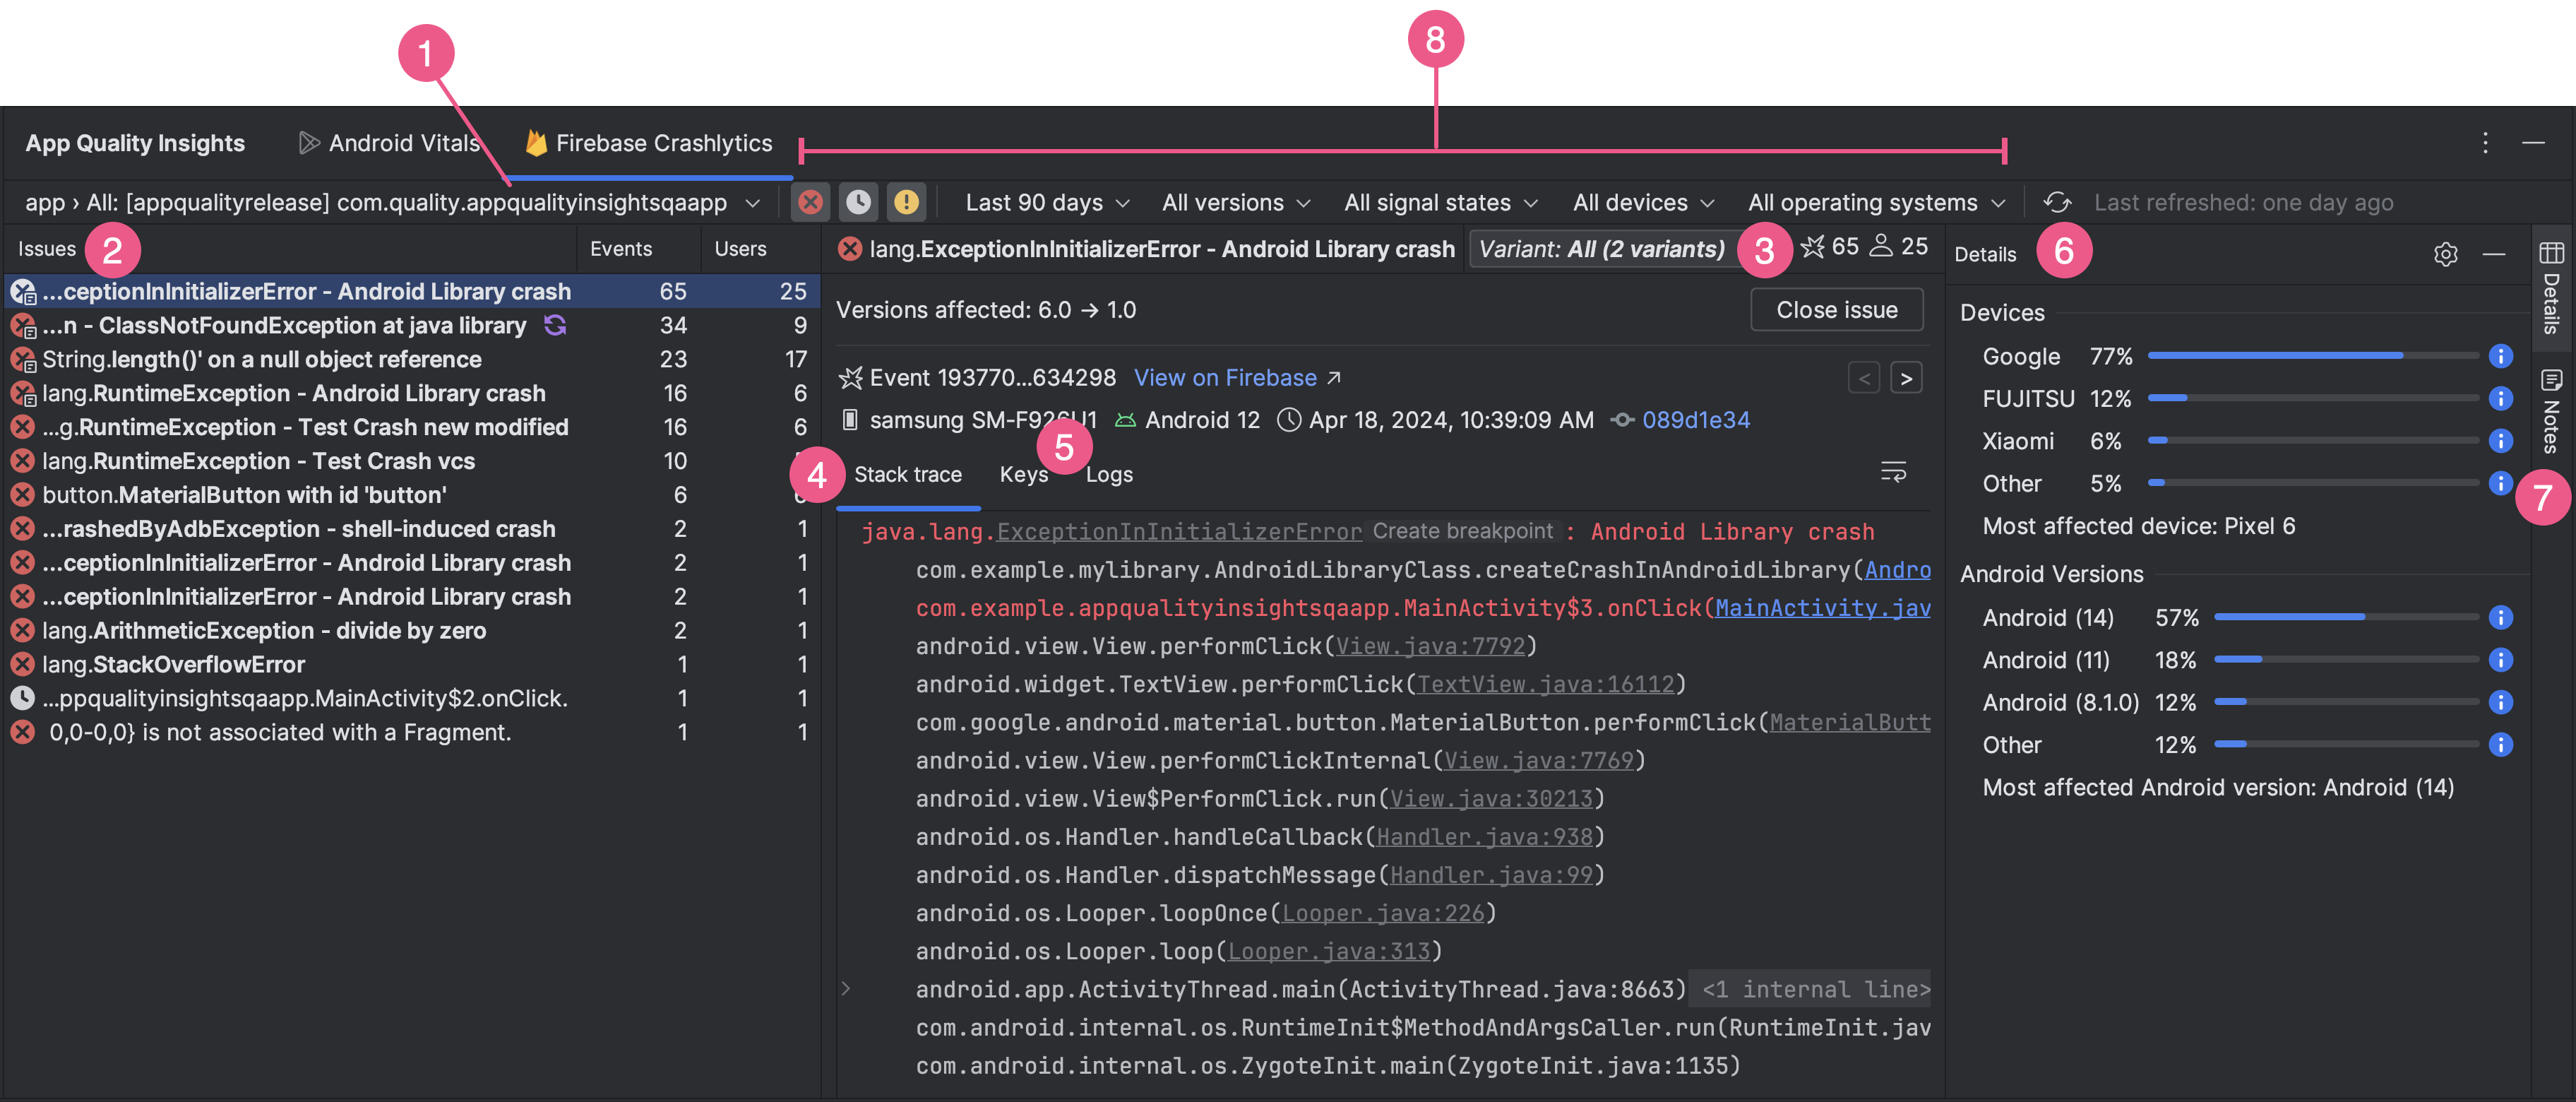
- 使用应用 ID 下拉菜单选择要分析的应用 ID。例如,虽然您可以在 IDE 中处理应用的调试版本,但还可能想要查看用户所安装的正式版应用的事件数据。
- Issues 面板会显示 Crashlytics 中的数据对应的热门事件,并按崩溃的影响程度从大到小排序。
- 按变体(即具有相似堆栈轨迹的事件组)查看事件。按变体分析事件有助于您找出崩溃的根本原因。
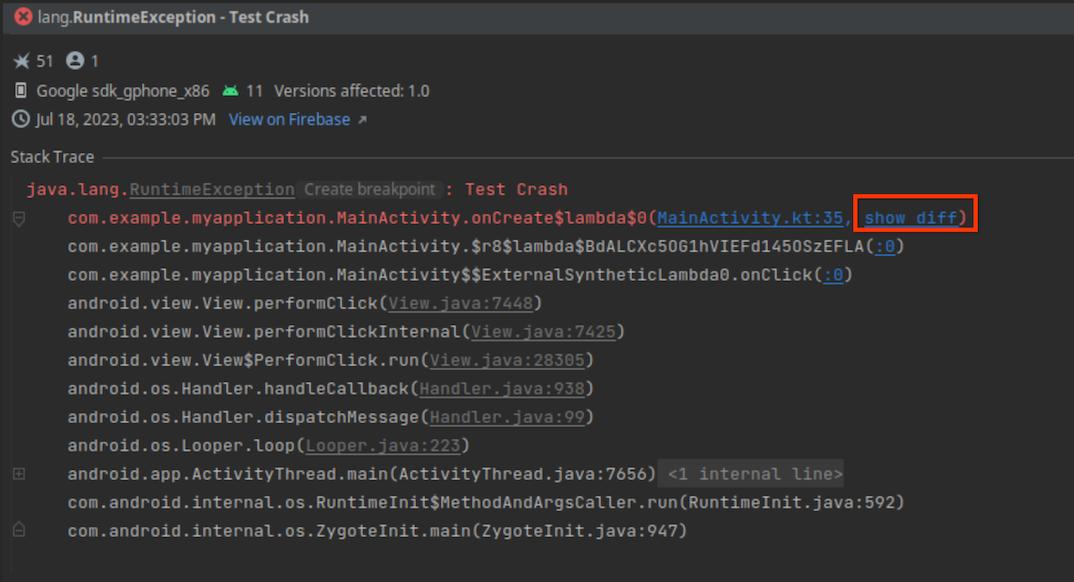
堆栈轨迹标签页显示您在问题面板中点击的事件最近一次发生的情况,提供其详细信息。您可以查看事件的堆栈轨迹,然后点击堆栈轨迹跳转到代码库中的相关行。如果自崩溃发生以来您的代码发生了更改,请点击堆栈轨迹中错误旁边的显示差异,以查看当前代码与导致崩溃的代码库版本之间的差异。
此外,该面板还会显示受影响的设备类型、其 Android 版本、事件发生的时间,并提供指向 Firebase Crashlytics 信息中心内该事件所在位置的链接。如需浏览群组中多个活动的信息,请使用向左和向右箭头。点击关闭问题可直接从面板中关闭问题。
- 键和日志标签页会显示每个 Crashlytics 报告的自定义键值对和日志。
- Details 面板会按设备类型和 Android 版本对崩溃次数进行细分,让您可以确定哪些用户群组受影响最大。该面板还会显示遇到崩溃问题的应用版本以及受影响的用户数量。
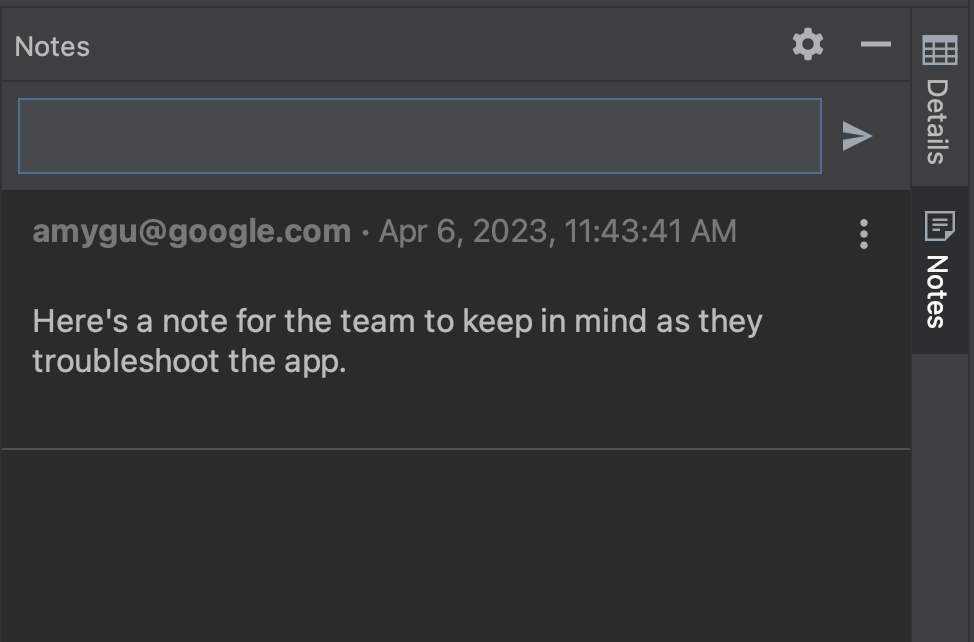
- 阅读问题备注并将其附加到问题中,以便团队成员能够在 Firebase 控制台中看到这些信息。如需撰写有关问题的备注,请选择相应问题并打开 Notes 面板。您必须拥有对 Crashlytics 项目的写入权限,才能写入备注。包含备注的问题会在 Issues 面板中出现“Notes”图标
 。
。
- 使用各种过滤条件可过滤出部分事件。您可以选择或取消选择“Fatal”
 、“Non-Fatal”
 和 ANR
和 ANR
 事件,还可以按时间、应用版本、Crashlytics Signal、设备品牌和型号以及 Android 平台版本过滤事件。请注意,就 Crashlytics Signal 状态而言,如果某个问题在过去已关闭,并再次出现在新版应用中,则会被视为“回归”问题。
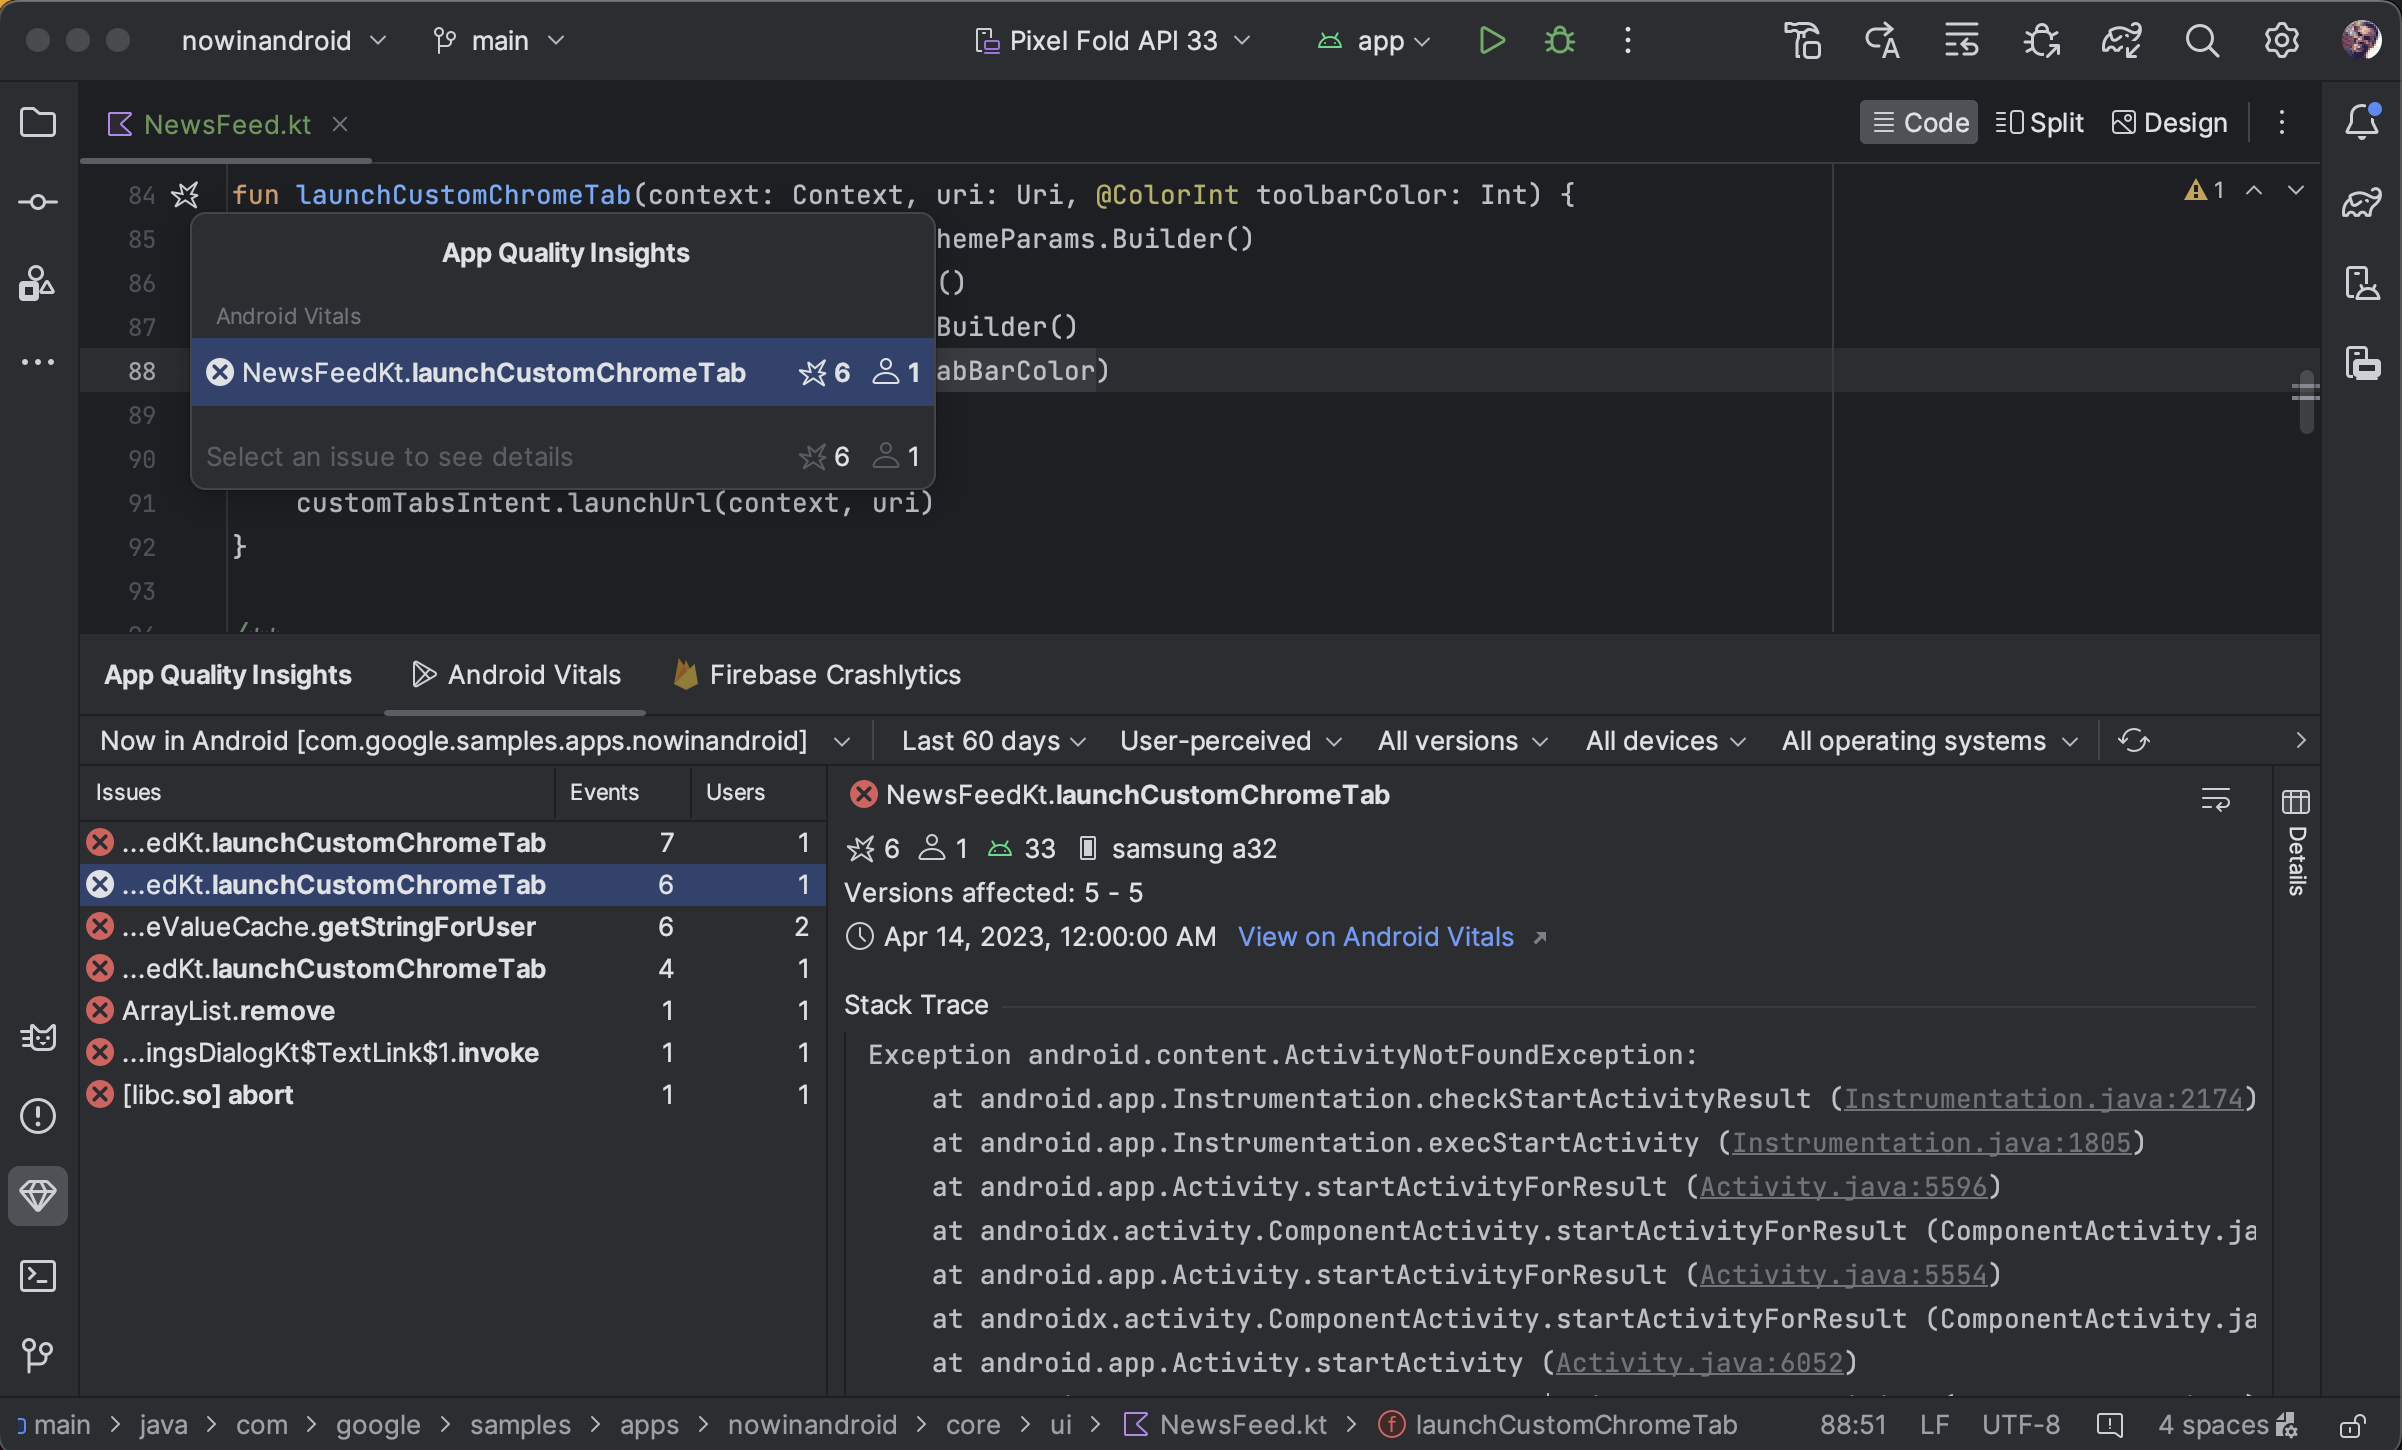
您不仅可以从堆栈轨迹跳转到代码,也可以从代码跳转到堆栈轨迹:Android Studio 现在使用表示崩溃的边栏图标 ![]() 标出与崩溃相关的代码行,以便您轻松发现和调试它们。
标出与崩溃相关的代码行,以便您轻松发现和调试它们。
将鼠标指针悬停在崩溃图标上,系统会弹出一个窗口,其中显示涉及相应代码行的事件数量以及事件发生的频率。
![]()
点击崩溃图标即可查看更详细的事件列表,包括特定事件的发生频率及其影响的用户数量。点击特定事件,即可跳转到 App Quality Insights 工具窗口中的事件详情。
![]()
Android Vitals 和 Crashlytics 中的数据有所不同
请注意,Android Vitals 和 Crashlytics 可能会针对与同一崩溃问题关联的用户数和事件数报告不同的值。之所以出现这些差异,是因为 Play 和 Crashlytics 可以在不同的时间针对不同的用户捕获崩溃问题。以下是导致 Play 计数和 Crashlytics 计数出现差异的几个原因:
- Play 在启动开始时捕获崩溃问题,而 Crashlytics 捕获 Crashlytics SDK 初始化后发生的崩溃问题。
- 如果用户在使用新手机时选择停用崩溃报告,则系统不会向 Play 报告这些崩溃问题;不过,Crashlytics 会根据应用自己的隐私权政策捕获崩溃问题。
在离线状态下利用有限功能进行调查
如果您发出了新请求(例如点击 Refresh),而 Android Studio 无法与 Crashlytics 通信,则您可以通过 App Quality Insights 窗口进入离线模式。
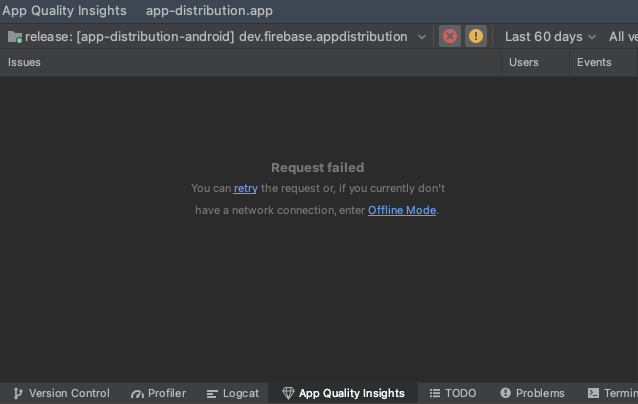
在这种模式下,您可以继续根据缓存数据调查问题和最新事件。某些功能(如更改某些过滤选项或关闭问题)不可用。如需重新尝试连接到 Crashlytics 并返回到在线状态,请点击重新连接图标 ![]() 。
。
权限
请参阅服务权限。