The Logcat window in Android Studio helps you debug your app by
displaying logs from your device in real time—for example, messages that you
added to your app with the Log class, messages
from services that run on Android, or system messages, such as when a garbage
collection occurs. When an app throws an exception, Logcat shows a message
followed by the associated stack trace containing links to the line of code.
Get started with the Logcat window
To view the log messages for your app, do the following.
- In Android Studio, build and run your app on a physical device or emulator.
- Select View > Tool Windows > Logcat from the menu bar.
By default, Logcat scrolls to the end. Clicking in the Logcat view or scrolling
up using your mouse wheel turns this feature off. To turn it back on, click
Scroll to the End  from the toolbar. You can also use the toolbar to clear, pause, or restart
Logcat.

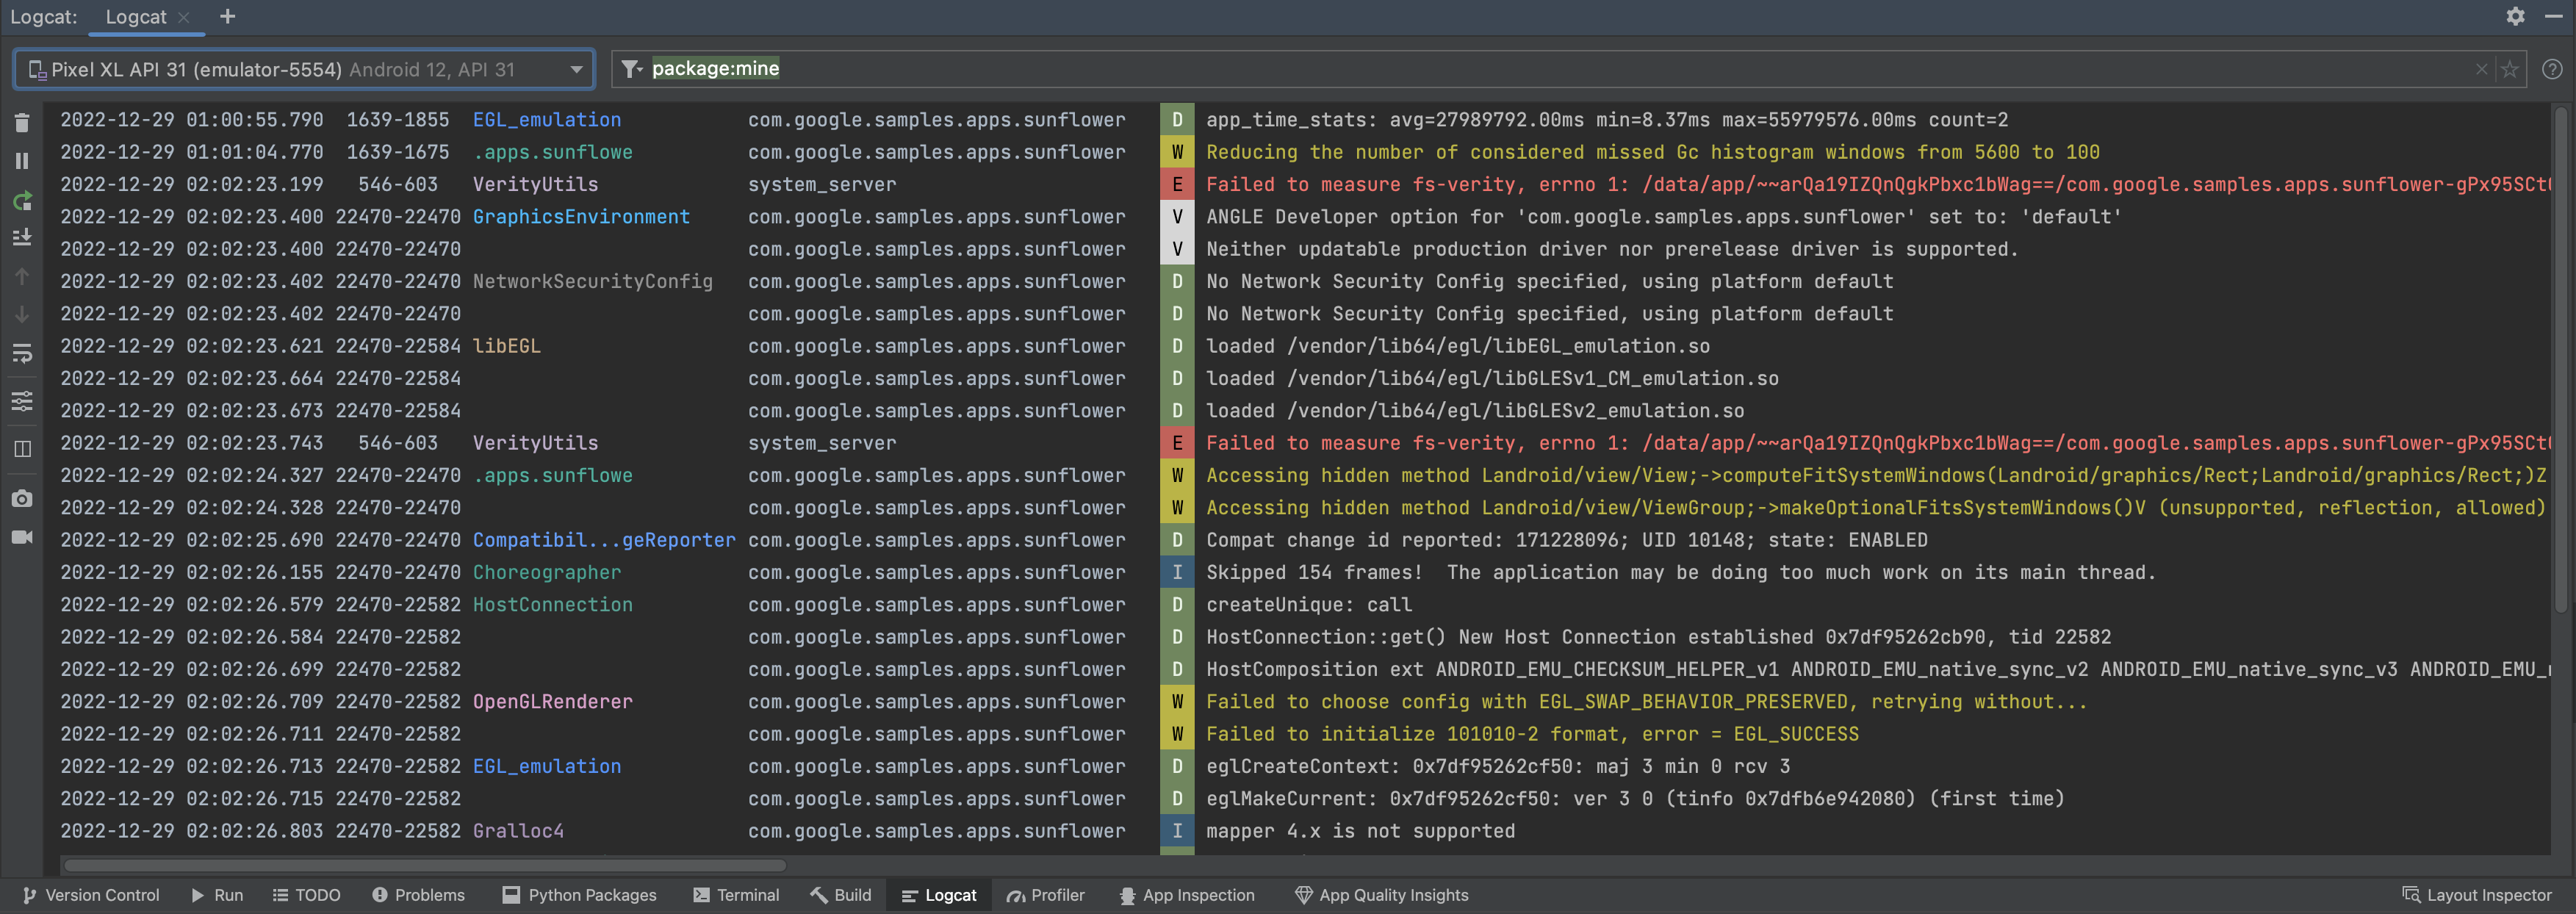
Figure 1. Logcat formats logs to make it easier to scan useful information, such as tags and messages, and identify different types of logs, such as warnings and errors.
How to read logs
Each log has a date, timestamp, process and thread ID, tag, package name,
priority, and message associated with it. Different tags have a unique color
that helps identify the type of log. Each log entry has a priority of FATAL,
ERROR, WARNING, INFO, DEBUG, or VERBOSE.
For example, the following log message has a priority of DEBUG and a tag of
ProfileInstaller:
2022-12-29 04:00:18.823 30249-30321 ProfileInstaller com.google.samples.apps.sunflower D Installing profile for com.google.samples.apps.sunflower
Configure the log view
The standard log view displays each log's date, time process and thread ID, tag,
package name, priority, and the message associated with it. By default, message
lines are not wrapped in the log view but you can use the
Soft-Wrap  option from the Logcat toolbar.
You can switch to Compact view, which has less default display information,
by clicking
Configure Logcat Formatting Options  from the Logcat toolbar.
To further configure how much information you want displayed, select Modify Views, and choose whether you want to see the timestamp, tags, process IDs, or package names displayed.
Change the color scheme
To change the color scheme, navigate to Android Studio > Settings > Editor > Color Scheme. To change the color scheme of your log view, select Android Logcat. To change the color scheme of your filter, select Logcat Filter.
Additional configuration options
For additional configuration options, navigate to Android Studio > Settings > Tools > Logcat. From here, you can choose the Logcat cycle buffer size, the default filter for new Logcat windows, and whether you want to add filters from history to autocomplete.
Use Logcat in multiple windows
Tabs help you easily switch between different devices or queries. You can create
multiple Logcat tabs by clicking
New Tab  .
Right-clicking a tab lets you rename and rearrange it.
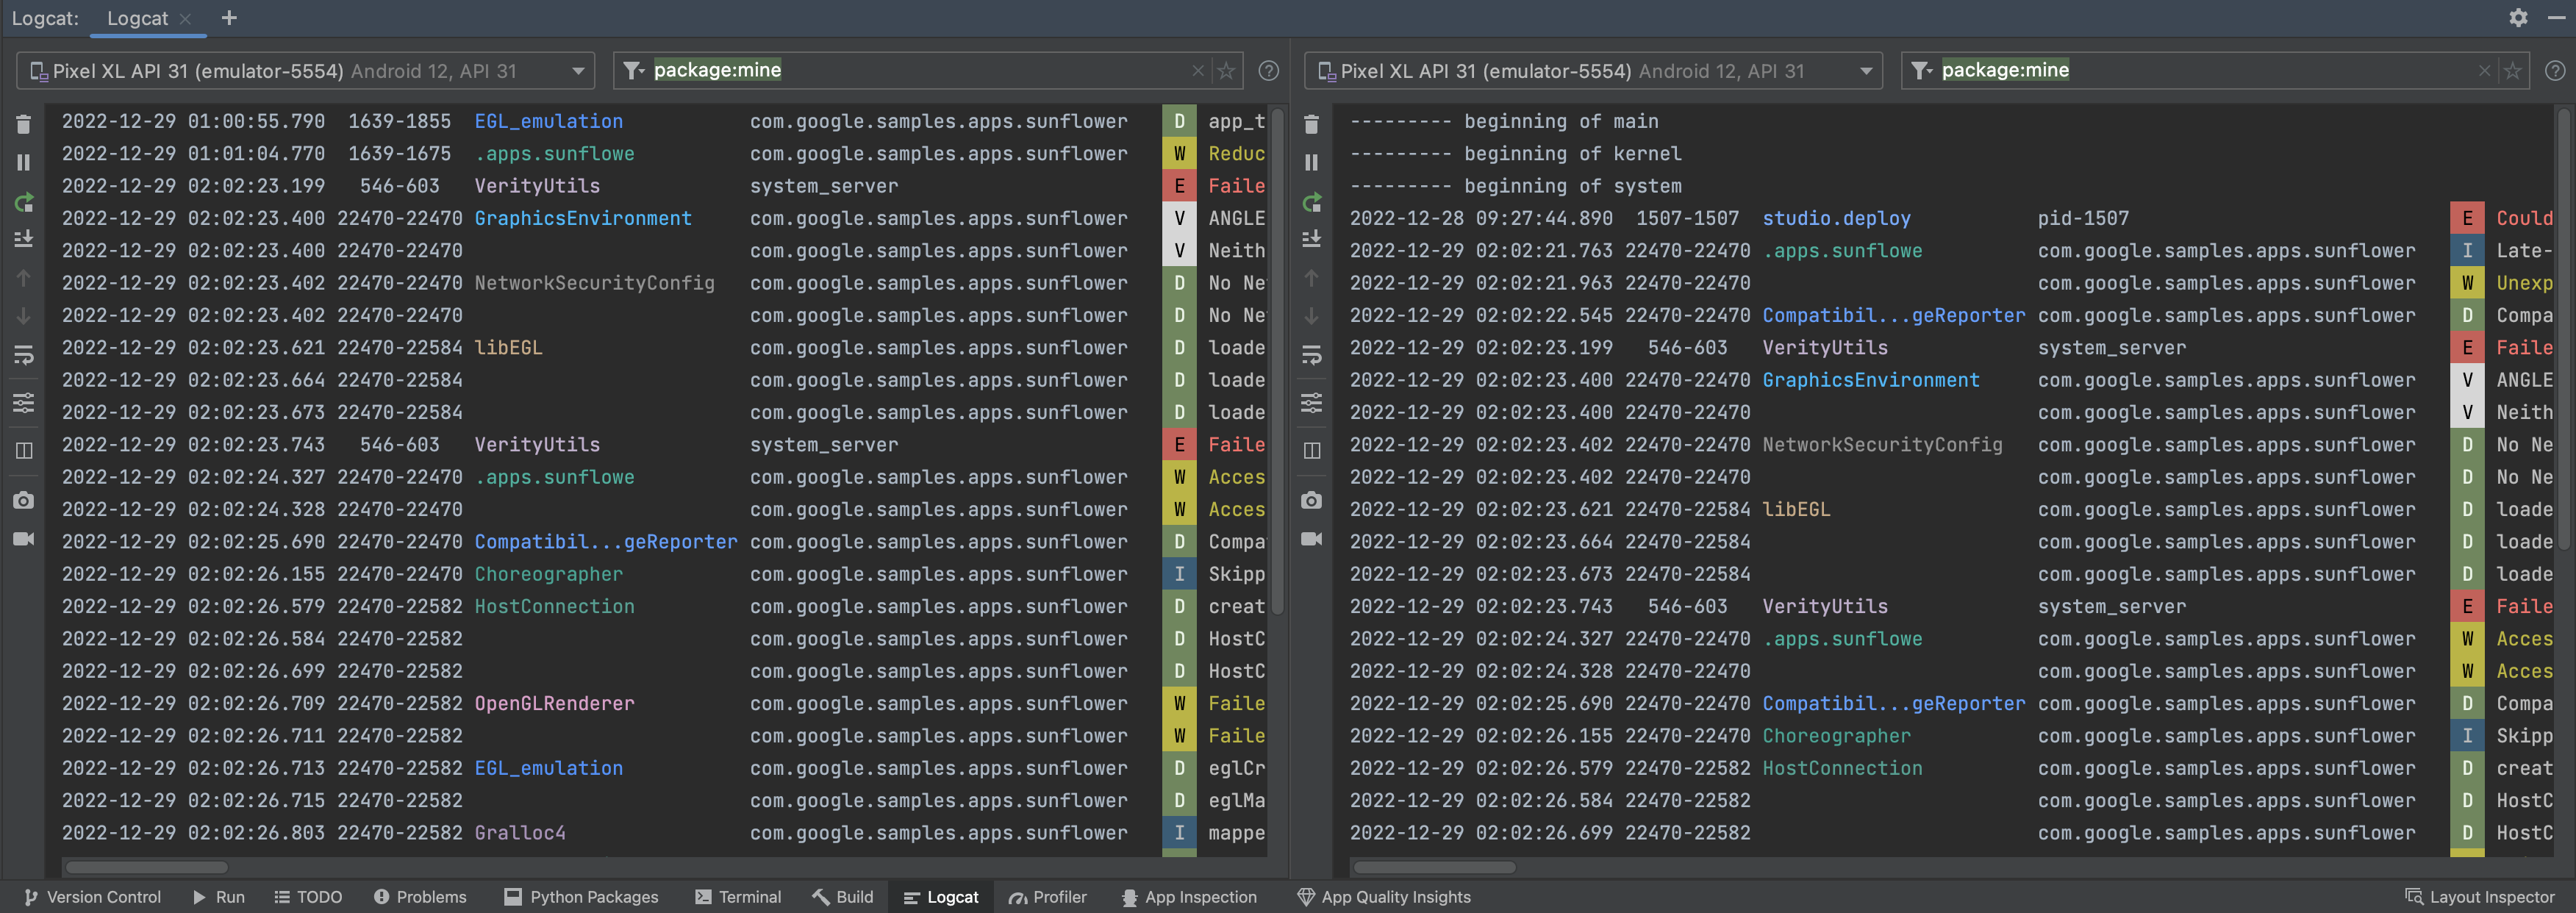
Additionally, you can split the view within a tab to help you more easily compare between two sets of logs. To create a split, either right-click in the log view or click the Split Panels option from the toolbar, and select Split Right or Split Down. To close a split, right-click and select Close. Each split allows you to set its own device connection, view options, and query.
 Figure 2. Split Logcat windows in Android Studio.
From the Logcat toolbar, you can either scroll to the end of the logs, or you can click on a particular line to keep that line visible.
Query logs using key-value search
In Android Studio, you can generate key-value searches right from the
main query field. This query system provides accuracy of what you want to
query and also exclude logs based on key-values. While you have the option to
use regular expressions, you don't have to rely on them for queries. To see
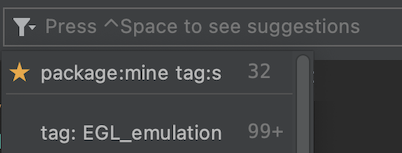
suggestions, press Ctrl + Space in the query field.
 Figure 3. Press
 Ctrl + Space in the query field to see a list of
suggested queries.
The following are some examples of keys you can use in your query:
tag: Matches against thetagfield of the log entry.package: Matches against the package name of the logging app.process: Matches against the process name of the logging app.message: Matches against the message part of the log entry.level: Matches the specified or higher severe log level–for example,DEBUG.age: Matches if the entry timestamp is recent. Values are specified as a number followed by a letter specifying the time unit:sfor seconds,mfor minutes,hfor hours anddfor days. For example,age: 5mfilters only messages that were logged in the last 5 minutes.
Negation and regular expressions
The following fields support negation and regular expression matching: tag,
package, message, and line.
Negation is expressed by prepending a - to the field name. For example,
-tag:MyTag matches log entries whose tag doesn't contain the string
MyTag.
Regular expression matching is expressed by appending a ~ to the field name.
For example, tag~:My.*Tag.
Negation and regular expression modifiers can be combined. For example,
-tag~:My.*Tag.
Logical operators and parentheses
The query language supports the AND and OR operators expressed by & and
| and parentheses. For example:
(tag:foo | level:ERROR) & package:mine
Note that normal operator precedence is enforced, so the following:
tag:foo | level:ERROR & package:mine
Is evaluated as:
tag:foo | (level:ERROR & package:mine)
Implicit logical operators
If logical operators are not applied, the query language automatically
evaluates multiple non-negated key-value filter terms with the same key as an
OR, and everything else with an AND.
For example:
tag:foo tag:bar package:myapp
Is evaluated as:
(tag:foo | tag:bar) & package:myapp
But:
tag:foo -tag:bar package:myapp
Is evaluated as:
tag:foo & -tag:bar & package:myapp
If multiple query terms are separated by whitespace without a logical operator,
they are treated as an AND with a low precedence. For example, the term
foo bar tag:bar1 | tag:bar2 is equivalent to
'foo bar' & (tag: bar1 | tag: bar2).
Special queries
package:mine
The package key supports a special value mine. This special value matches any
package names that are contained in the open project.
level
The level query matches against the log level of the Logcat message, where the
log entry level is greater or equal to the query level.
For example, level:INFO matches any log entry with a log level of INFO,
WARN, ERROR or ASSERT. The level is not case sensitive. Valid levels are:
VERBOSE, DEBUG, INFO, WARN, ERROR and ASSERT.
age
The age query matches entries based on their timestamp, and is formatted as
age:<number><unit>, where
<number>is an integer<unit>is one ofs,m,h, andd(seconds, minutes, hours, and days).
Given the following list, the age query matches log messages that have a
timestamp in the range described by the value. For example: the query age:5m
matches entries with a timestamp no earlier than 5 minutes ago.
age:30s
age:5m
age:3h
age:1d
Note that the timestamp is compared against the timestamp of the host, not the connected device. If the time of the device is not set correctly, this query may not work as expected.
is key
You can use the is key as follows:
is:crashmatches log entries that represent an application crash (either native or Java).is:stacktracematches log entries that represent anything that looks like a Java stacktrace, regardless of the log level.
name key
The name key lets you provide a unique name for a saved filter so that it's
easily identifiable in the filter history dropdown. Although you don't get an
error for specifying name more than once, the IDE uses only the last
specified value for name in the query.
View query history
You can view your query history by clicking
Show history ![]() next to the query field. To favorite a query so that it stays at the top of the
list across all your studio projects, click the star next to it. You can also
use the
next to the query field. To favorite a query so that it stays at the top of the
list across all your studio projects, click the star next to it. You can also
use the name: key to make favorite queries more easy to recognize. For more
information, see Special queries.

Figure 4. Favorite a query by clicking the star next to it.
Track logs across app crashes and restarts
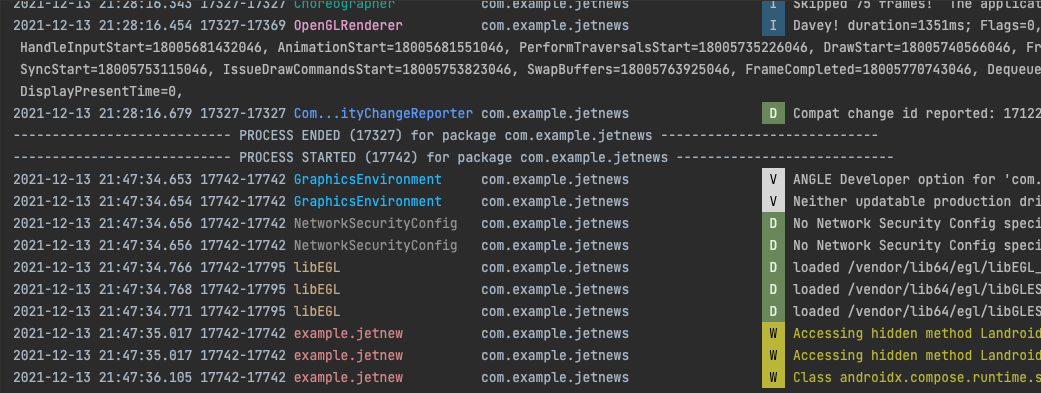
When Logcat notices that your app process has stopped and restarted, it displays
a message in the output, such as PROCESS ENDED and PROCESS STARTED.
Restarting Logcat preserves your session configuration, such as tab splits,
filters, and view options, so that you can continue your session easily.

Figure 5. When your app process restarts, Logcat prints a message that the process has ended and then started.
