火焰图
使用集合让一切井井有条
根据您的偏好保存内容并对其进行分类。
Flame Chart 标签页提供一个倒置的调用图表,用来汇总完全相同的调用堆栈。也就是说,将具有相同调用方顺序的完全相同的方法或函数收集起来,并在火焰图中将它们表示为一个较长的横条(而不是将它们显示为多个较短的横条,如调用图表中所示)。这样更方便您查看哪些方法或函数消耗的时间最多。不过,这也意味着,横轴不代表时间轴,而是表示执行每个方法或函数所需的相对时间。
为帮助说明此概念,不妨考虑图 1 中的调用图表。请注意,方法 D 多次调用 B(B1、B2 和 B3),其中一些对 B 的调用也调用了 C(C1 和 C3)。
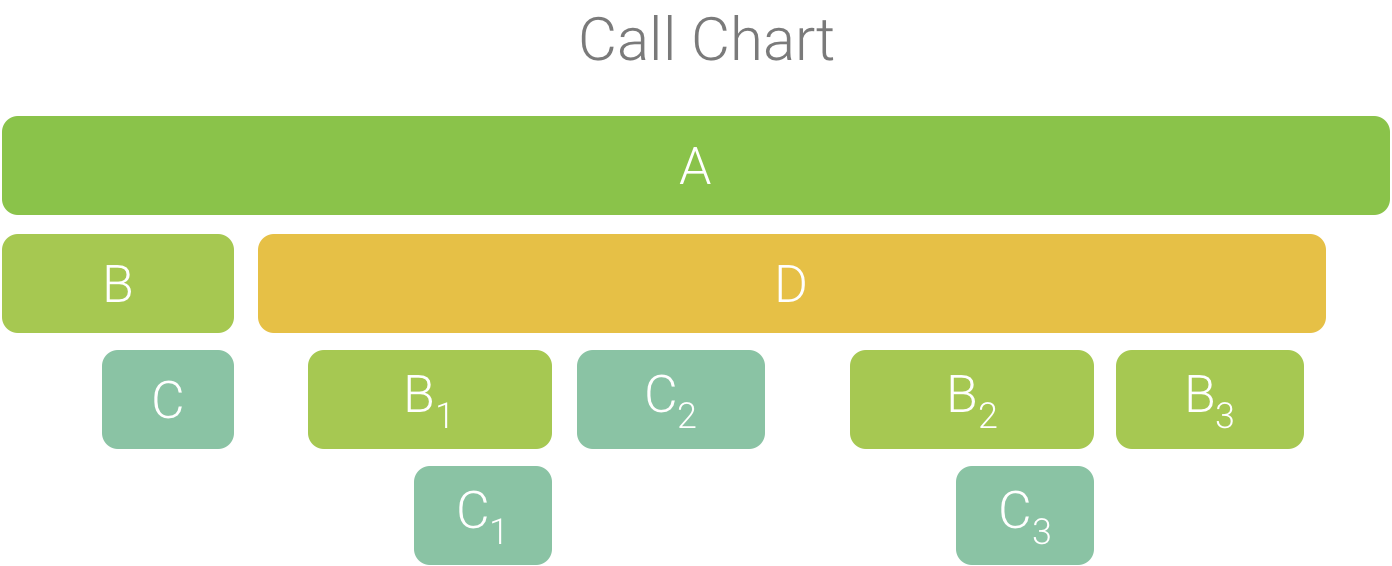
图 1. 一个调用图表,其中的多个方法调用具有相同的调用方顺序。
由于 B1、B2 和 B3 具有相同的调用方顺序 (A → D → B),因此系统将它们汇总在一起,如图 2 所示。同样,C1 和 C3 也汇总在一起,因为它们也具有相同的调用方顺序 (A → D → B → C)。请注意,C2 不包括在内,因为它具有不同的调用方顺序 (A → D → C)。
图 2. 汇总具有相同调用堆栈的相同方法。
汇总的调用用于创建火焰图,如图 3 所示。
请注意,对于火焰图中的任何给定调用,占用最多 CPU 时间的被调用方会最先显示。
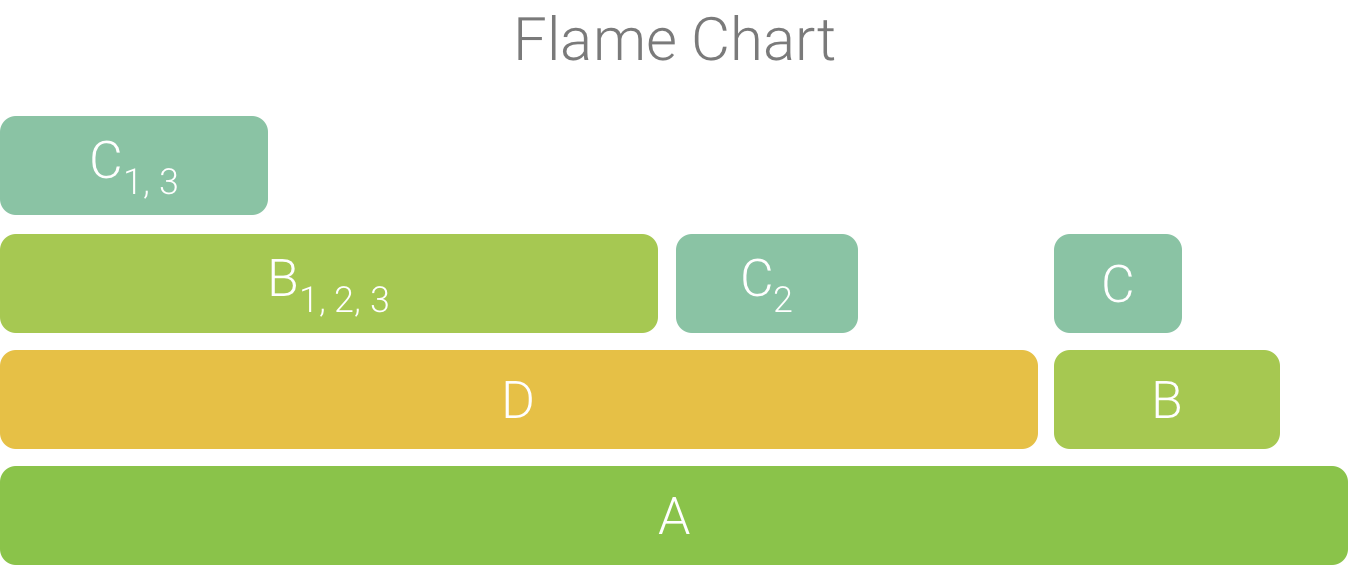
图 3. 图 5 中所示调用图表的火焰图表示形式。
本页面上的内容和代码示例受内容许可部分所述许可的限制。Java 和 OpenJDK 是 Oracle 和/或其关联公司的注册商标。
最后更新时间 (UTC):2025-07-27。
[null,null,["最后更新时间 (UTC):2025-07-27。"],[],[],null,["# Flame chart\n\nThe **Flame Chart** tab provides an inverted call chart that aggregates\nidentical call stacks. That is, identical methods or functions that share the\nsame sequence of callers are collected and represented as one longer bar in a\nflame chart (rather than displaying them as multiple shorter bars, as shown in a\ncall chart). This makes it easier to see which methods or functions consume the\nmost time. However, this also means that the horizontal axis doesn't represent a\ntimeline; instead, it indicates the relative amount of time each method or\nfunction takes to execute.\n\nTo help illustrate this concept, consider the call chart in Figure 1. Note\nthat method D makes multiple calls to B (B~1~, B~2~, and\nB~3~), and some of those calls to B make a call to C (C~1~ and\nC~3~).\n\n\n**Figure 1.** A call chart with multiple method calls\nthat share a common sequence of callers.\n\n\u003cbr /\u003e\n\nBecause B~1~, B~2~, and B~3~ share the same sequence\nof callers (A → D → B) they are aggregated, as shown in Figure 2. Similarly,\nC~1~ and C~3~ are aggregated because they share the same\nsequence of callers (A → D → B → C); note that C~2~ is not included\nbecause it has a different sequence of callers (A → D → C).\n\n\n**Figure 2.** Aggregating identical methods that share\nthe same call stack.\n\n\u003cbr /\u003e\n\nThe aggregated calls are used to create the flame chart, as shown in Figure 3.\nNote that, for any given call in a flame chart, the callees that consume the\nmost CPU time appear first.\n\n\n**Figure 3.** A flame chart representation of the call\nchart shown in figure 5.\n\n\u003cbr /\u003e"]]