“Top Down”和“Bottom Up”图表
使用集合让一切井井有条
根据您的偏好保存内容并对其进行分类。
Top Down 标签页显示一个调用列表,在该列表中展开方法或函数节点会显示它的被调用方。图 2 显示了以下调用图表的自上而下图。图中的每个箭头都从调用方指向被调用方。
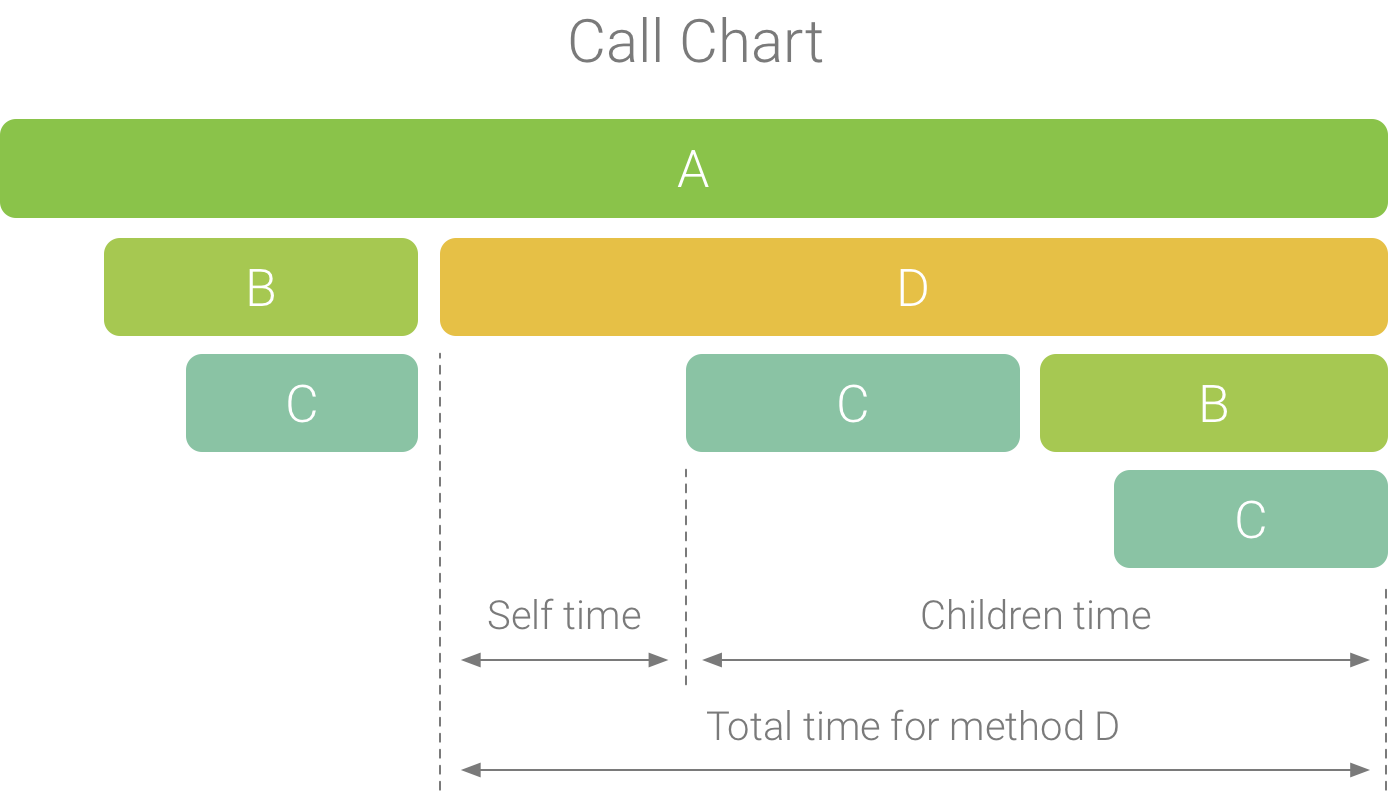
图 1. 一个调用图表示例,展示了方法 D 的 Self 时间、Children 时间和 Total 时间。
如图 2 所示,在 Top Down 标签页中展开方法 A 的节点会显示它的被调用方,即方法 B 和 D。在此之后,展开方法 D 的节点会显示它的被调用方,例如方法 B 和 C。与 Flame chart 标签页类似,“Top Down”树也汇总了具有相同调用堆栈的完全相同的方法的轨迹信息。也就是说,Flame chart 标签页提供了 Top Down 标签页的图形表示方式。
Top Down 标签页提供以下信息来帮助说明在每个调用上所花的 CPU 时间(时间也可表示为在选定范围内占线程总时间的百分比):
- Self:方法或函数调用在执行自己的代码(而非被调用方的代码)上所花的时间,如图 1 中的方法 D 所示。
- Children:方法或函数调用在执行它的被调用方(而非自己的代码)上所花的时间,如图 1 中的方法 D 所示。
- Total:方法的 Self 时间和 Children 时间的总和。这表示应用在执行调用时所用的总时间,如图 1 中的方法 D 所示。
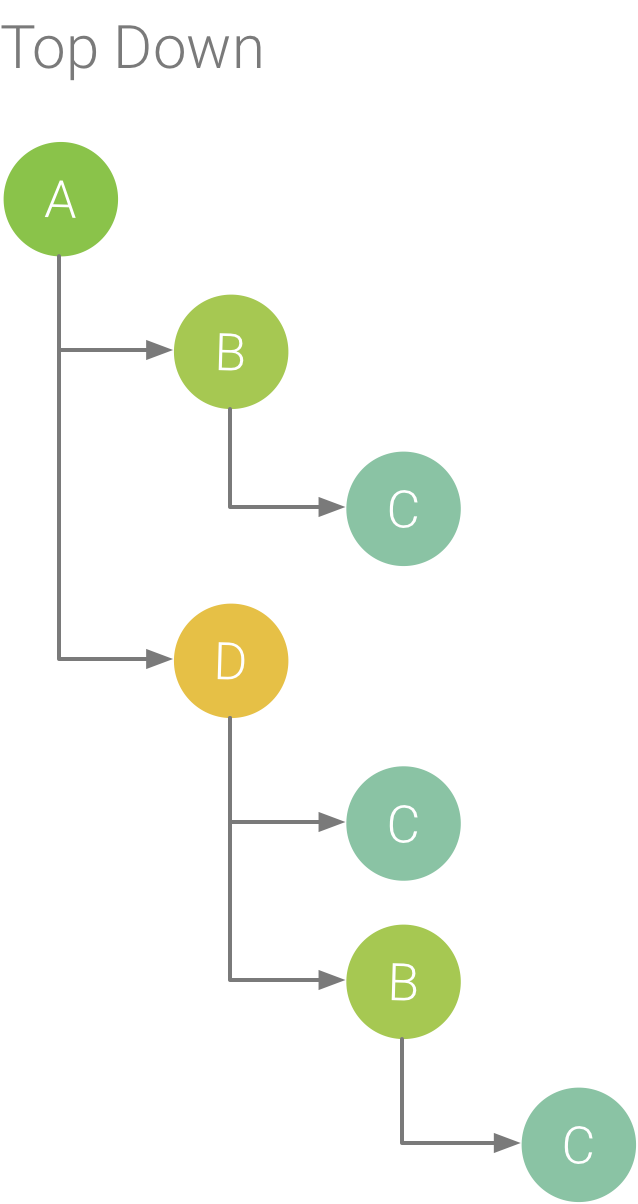
图 2. 一个“Top Down”树。
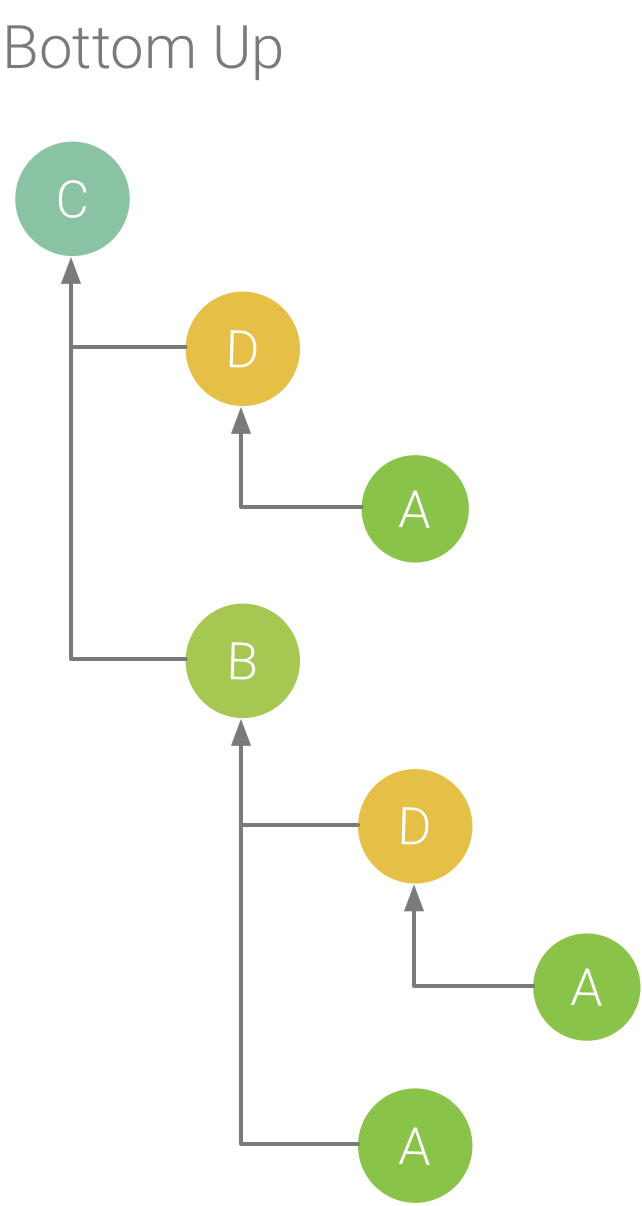
图 3. 图 5 中方法 C 的 Bottom Up 树。
Bottom Up 标签页显示一个调用列表,在该列表中展开函数或方法的节点会显示它的调用方。沿用图 2 中所示的轨迹示例,图 3 提供了方法 C 的 Bottom Up 树。在该 Bottom Up 树中打开方法 C 的节点会显示它独有的两个调用方,即方法 B 和 D。请注意,尽管 B 调用 C 两次,但在“Bottom Up”树中展开方法 C 的节点时,B 仅显示一次。在此之后,展开 B 的节点会显示它的调用方,即方法 A 和 D。
Bottom Up 标签页用于按照占用的 CPU 时间由多到少(或由少到多)的顺序对方法或函数排序。您可以检查每个节点以确定哪些调用方在调用这些方法或函数上所花的 CPU 时间最多。与“Top Down”树相比,“Bottom Up”树中每个方法或函数的时间信息参照的是每个树顶部的方法(顶部节点)。CPU 时间也可表示为在该记录期间占线程总时间的百分比。下表说明了如何解读顶部节点及其调用方(子节点)的时间信息。
|
Self |
Children |
Total |
“Bottom Up”树顶部的方法或函数(顶部节点) |
表示方法或函数在执行自己的代码(而非被调用方的代码)上所花的总时间。与“Top Down”树相比,此时间信息表示在记录的持续时间内对此方法或函数的所有调用时间的总和。
|
表示方法或函数在执行它的被调用方(而非自己的代码)上所花的总时间。与“Top Down”树相比,此时间信息表示在记录的持续时间内对此方法或函数的被调用方的所有调用时间的总和。
|
Self 时间和 Children 时间的总和。
|
调用方(子节点) |
表示被调用方在由调用方调用时的总 Self 时间。以图 6 中的 Bottom Up 树为例,方法 B 的 Self 时间将等于每次执行由方法 B 调用的方法 C 所用的 Self 时间的总和。
|
表示被调用方在由调用方调用时的总 Children 时间。以图 6 中的 Bottom Up 树为例,方法 B 的 Children 时间将等于每次执行由方法 B 调用的方法 C 所用的 Children 时间的总和。
|
Self 时间和 Children 时间的总和。
|
注意:对于给定的记录,当性能分析器达到文件大小限制时,Android Studio 会停止收集新数据(但不会停止记录)。在执行检测轨迹时,这种情况通常发生得更快,因为与采样轨迹相比,此类轨迹会在更短的时间内收集更多的数据。如果您将检查时间范围延长至达到限制后的记录时段,则轨迹窗格中的时间数据不会发生变化(因为没有新数据可用)。此外,当您仅选择没有可用数据的那部分记录时,对于时间信息,轨迹窗格将显示 NaN。
本页面上的内容和代码示例受内容许可部分所述许可的限制。Java 和 OpenJDK 是 Oracle 和/或其关联公司的注册商标。
最后更新时间 (UTC):2025-07-27。
[null,null,["最后更新时间 (UTC):2025-07-27。"],[],[],null,["# Top down and bottom up charts\n\nThe **Top Down** tab displays a list of calls in which expanding a method or\nfunction node displays its callees. Figure 2 shows a top down graph for the\nfollowing call chart. Each arrow in the graph points from a caller to a callee.\n\n\n**Figure 1.** An example call chart that illustrates\nself, children, and total time for method D.\n\n\u003cbr /\u003e\n\nAs shown in Figure 2, expanding the node for method A in the **Top Down** tab\ndisplays its callees, methods B and D. After that, expanding the node for method\nD exposes its callees, such as methods B and C. Similar to the\n[**Flame chart**](/studio/profile/chart-glossary/flame-chart) tab, the top down\ntree aggregates trace information for identical methods that share the same call\nstack. That is, the **Flame chart** tab provides a graphical representation of\nthe **Top Down** tab.\n\nThe **Top Down** tab provides the following information to help describe CPU\ntime spent on each call (times are also represented as a percentage of the\nthread's total time over the selected range):\n\n- **Self:** the time the method or function call spent executing its own code and not that of its callees, as illustrated in Figure 1 for method D.\n- **Children:** the time the method or function call spent executing its callees and not its own code, as illustrated in Figure 1 for method D.\n- **Total:** the sum of the method's **Self** and **Children** time. This represents the total time the app spent executing a call, as illustrated in Figure 1 for method D.\n\n**Figure 2.** A Top Down tree.\n\n\u003cbr /\u003e\n\n**Figure 3.** A Bottom Up tree for method C from\nFigure 5.\n\n\u003cbr /\u003e\n\nThe **Bottom Up** tab displays a list of calls in which expanding a function or\nmethod's node displays its callers. Using the example trace shown in Figure 2,\nfigure 3 provides a bottom up tree for method C. Opening the node for method C\nin the bottom up tree displays each of its unique callers, methods B and D. Note\nthat, although B calls C twice, B appears only once when expanding the node for\nmethod C in the bottom up tree. After that, expanding the node for B displays\nits caller, methods A and D.\n\nThe **Bottom Up** tab is useful for sorting methods or functions by those that\nconsume the most (or least) CPU time. You can inspect each node to determine\nwhich callers spend the most CPU time invoking those methods or functions.\nCompared to the top down tree, timing info for each method or function in a\nbottom up tree is in reference to the method at the top of each tree (top node).\nCPU time is also represented as a percentage of the thread's total time during\nthat recording. The following table helps explain how to interpret timing\ninformation for the top node and its callers (sub-nodes).\n\n| | Self | Children | Total |\n| Method or function at the top of the bottom up tree (top node) | Represents the total time the method or function spent executing its own code and not that of its callees. Compared to the top down tree, this timing information represents a sum of all calls to this method or function over the duration of the recording. | Represents the total time the method or function spent executing its callees and not its own code. Compared to the top down tree, this timing information represents the sum of all calls to this method or function's callees over the duration of the recording. | The sum of the self time and children time. |\n| Callers (sub-nodes) | Represents the total self time of the callee when being called by the caller. Using the bottom up tree in Figure 6 as an example, the self time for method B would equal the sum of the self times for each execution of method C when called by B. | Represents the total children time of the callee when being invoked by the caller. Using the bottom up tree in Figure 6 as an example, the children time for method B would equal the sum of the children times for each execution of method C when called by B. | The sum of the self time and children time. |\n|----------------------------------------------------------------|----------------------------------------------------------------------------------------------------------------------------------------------------------------------------------------------------------------------------------------------------------------|--------------------------------------------------------------------------------------------------------------------------------------------------------------------------------------------------------------------------------------------------------------------|---------------------------------------------|\n\n\n**Note:** For a given recording, Android Studio stops collecting new data\nwhen the profiler reaches the file size limit (however, this does not stop the\nrecording). This typically happens much more quickly when performing\ninstrumented traces because this type of tracing collects more data in a shorter\ntime, compared to a sampled trace. If you extend the inspection time into a\nperiod of the recording that occurred after reaching the limit, timing data in\nthe trace pane does not change (because no new data is available). Additionally,\nthe trace pane displays **NaN** for timing information when you select only\nthe portion of a recording that has no data available."]]