
如需生成应用执行的方法跟踪,您可以使用 Debug 类进行应用插桩。通过这种方式检测您的应用,可让您更精确地控制设备何时开始和停止记录跟踪信息。此外,设备还能使用您指定的名称保存跟踪日志,便于您日后轻松识别各个日志文件。您随后可以使用 Android Studio 的 CPU 性能剖析器查看各个跟踪日志。
此外,您还可以在 CPU 性能剖析器中开始和停止跟踪,无需对应用的代码进行插桩。
在开始生成跟踪日志之前,请确保您的应用已添加逻辑,以将跟踪日志保存到应用专属目录中。
检测您的应用
如需创建跟踪日志,请在您希望系统开始记录跟踪数据的位置调用 startMethodTracing()。
在调用中,您可以指定 .trace 文件的名称,系统会将它保存到一个特定于软件包的目录中。该目录专门用于保存目标设备上的永久性应用数据,与 getExternalFilesDir() 返回的目录相同,在大多数设备上都位于 ~/sdcard/ 目录中。此文件包含二进制方法跟踪数据,以及一个包含线程和方法名称的映射表。如需停止跟踪,请调用 stopMethodTracing()。
以下示例所示为开始和停止记录名为 sample.trace 的跟踪日志:
Kotlin
// Starts recording a trace log with the name you provide. For example, the
// following code tells the system to start recording a .trace file to the
// device with the name "sample.trace".
Debug.startMethodTracing("sample")

// The system begins buffering the generated trace data, until your
// application calls <code><a href="/reference/android/os/Debug.html#stopMethodTracing()">stopMethodTracing()</a></code>, at which time it writes
// the buffered data to the output file.
Debug.stopMethodTracing()
Java
// Starts recording a trace log with the name you provide. For example, the
// following code tells the system to start recording a .trace file to the
// device with the name "sample.trace".
Debug.startMethodTracing("sample");
...
// The system begins buffering the generated trace data, until your
// application calls <code><a href="/reference/android/os/Debug.html#stopMethodTracing()">stopMethodTracing()</a></code>, at which time it writes
// the buffered data to the output file.
Debug.stopMethodTracing();
请注意,如果应用在未更改跟踪日志名称的情况下再次调用 startMethodTracing(),系统会覆盖已保存至设备的现有日志。如需了解如何动态更改各个跟踪日志的名称,请转到有关保存多个日志的部分。
如果系统在您调用 stopMethodTracing() 之前达到缓冲区空间上限,则会停止跟踪并向控制台发送通知。开始和停止跟踪的方法在您的整个应用进程内均有效。也就是说,您可以在 Activity 的 onCreate(Bundle) 方法中调用 startMethodTracing(),在 Activity 的 onDestroy() 方法中调用 stopMethodTracing()。
请注意,启用剖析功能后,应用的运行速度会减慢。也就是说,您不应使用剖析数据确定绝对时间(例如“运行 foo() 方法需要 2.5 秒”)。跟踪日志中的时间信息只有在将其与先前的跟踪日志进行比较时才有用,通过比较您就能看出最近的更改是加快还是减慢了应用的运行速度。
部署到搭载 Android 5.0(API 级别 21)及更高版本的设备时,您可以使用基于示例的剖析方式进行剖析,以减小剖析对运行时性能的影响。如需启用示例剖析,请调用带有指定采样间隔时间的 startMethodTracingSampling()(而不是调用 startMethodTracing())。系统会定期收集示例,直至您的应用调用 stopMethodTracing()。
保存多个日志
如果您的应用在未指定新的跟踪日志名称的情况下多次开始和停止方法跟踪,设备将用新的跟踪日志覆盖旧的跟踪日志,即只会保留最近的跟踪日志。如需将多个跟踪日志保存到您的设备,应在您的应用每次调用 startMethodTracing() 时动态地对跟踪日志进行重命名。以下示例使用 SimpleDateFormat 类在对每个跟踪日志进行命名时添加当前的日期和时间:
Kotlin
// Uses the <code><a href="/reference/java/text/SimpleDateFormat.html">SimpleDateFormat</a></code> class to create a String with
// the current date and time.
val dateFormat: DateFormat = SimpleDateFormat("dd_MM_yyyy_hh_mm_ss", Locale.getDefault())
val logDate: String = dateFormat.format(Date())
// Applies the date and time to the name of the trace log.
Debug.startMethodTracing("sample-$logDate")
Java
// Uses the <code><a href="/reference/java/text/SimpleDateFormat.html">SimpleDateFormat</a></code> class to create a String with
// the current date and time.
SimpleDateFormat dateFormat =
        new SimpleDateFormat("dd_MM_yyyy_hh_mm_ss", Locale.getDefault());
String logDate = dateFormat.format(new Date());
// Applies the date and time to the name of the trace log.
Debug.startMethodTracing(
        "sample-" + logDate);
访问设备上的跟踪日志
系统在您的设备上创建轨迹日志后,您可以通过以下任一方式访问相应文件:
使用设备浏览器。如需打开设备浏览器,请依次点击 View > Tool Windows > Device Explorer(或点击工具窗口栏中的 Device Explorer
 按钮)。如图 1 所示,您可以导航至应用的软件包特定目录找到
 .trace文件。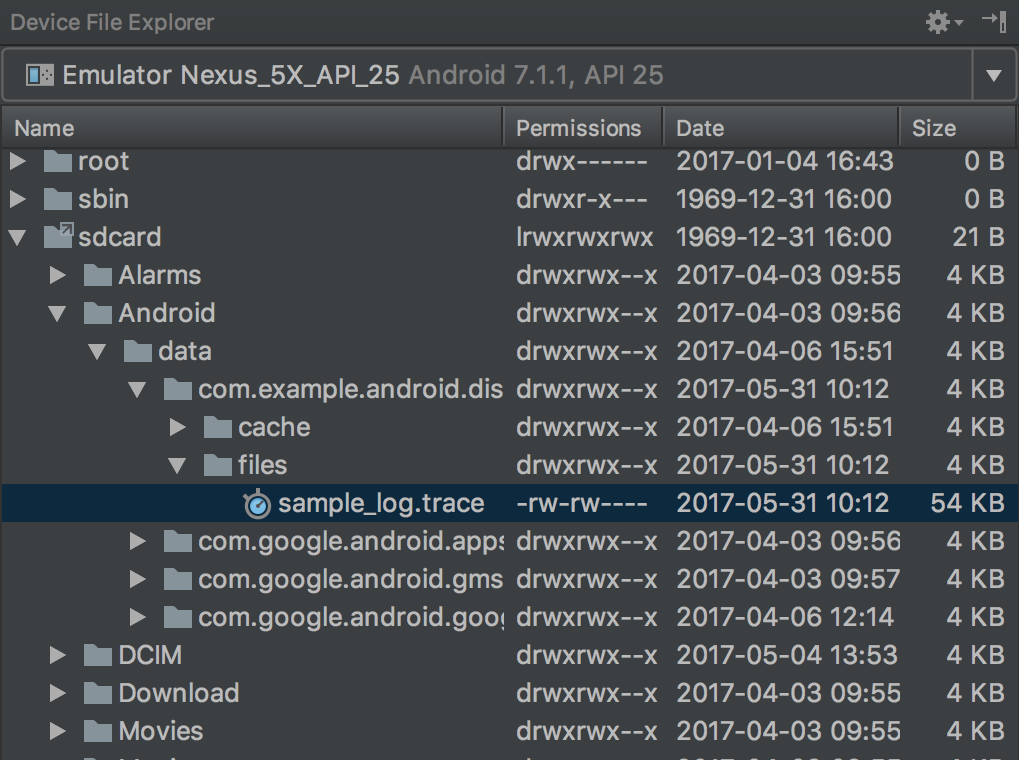
图 1. 使用设备浏览器找到轨迹日志。
使用
adb pull命令将文件复制到您的本地机器。以下命令可将名为sample.trace的跟踪日志从设备复制到本地计算机的~/Documents/trace-logs/目录。adb pull path-on-device/sample.trace ~/Documents/trace-logs/
然后,您可以 使用 CPU 性能分析器导入跟踪文件。