আপনার অ্যাপ লাইভ পরিদর্শন করুন
সেভ করা পৃষ্ঠা গুছিয়ে রাখতে 'সংগ্রহ' ব্যবহার করুন
আপনার পছন্দ অনুযায়ী কন্টেন্ট সেভ করুন ও সঠিক বিভাগে রাখুন।
আপনার অ্যাপ লাইভ পরিদর্শন করা আপনাকে ডিভাইসের CPU ব্যবহার, থ্রেড কার্যকলাপ এবং মেমরি ব্যবহারের একটি উচ্চ-স্তরের ওভারভিউ দেয়। আপনার অ্যাপের প্রোফাইলিং কোথা থেকে শুরু করবেন তা যদি আপনি জানেন না, তাহলে একটি অনুসন্ধানমূলক বিশ্লেষণ পরিচালনা করতে লাইভ ভিউ ব্যবহার করুন এবং তারপর যখন আপনি অপ্টিমাইজ করা যেতে পারে এমন আচরণ দেখেন তখন নির্দিষ্ট প্রোফাইলিং কাজগুলির সাথে গভীরভাবে খনন করুন৷
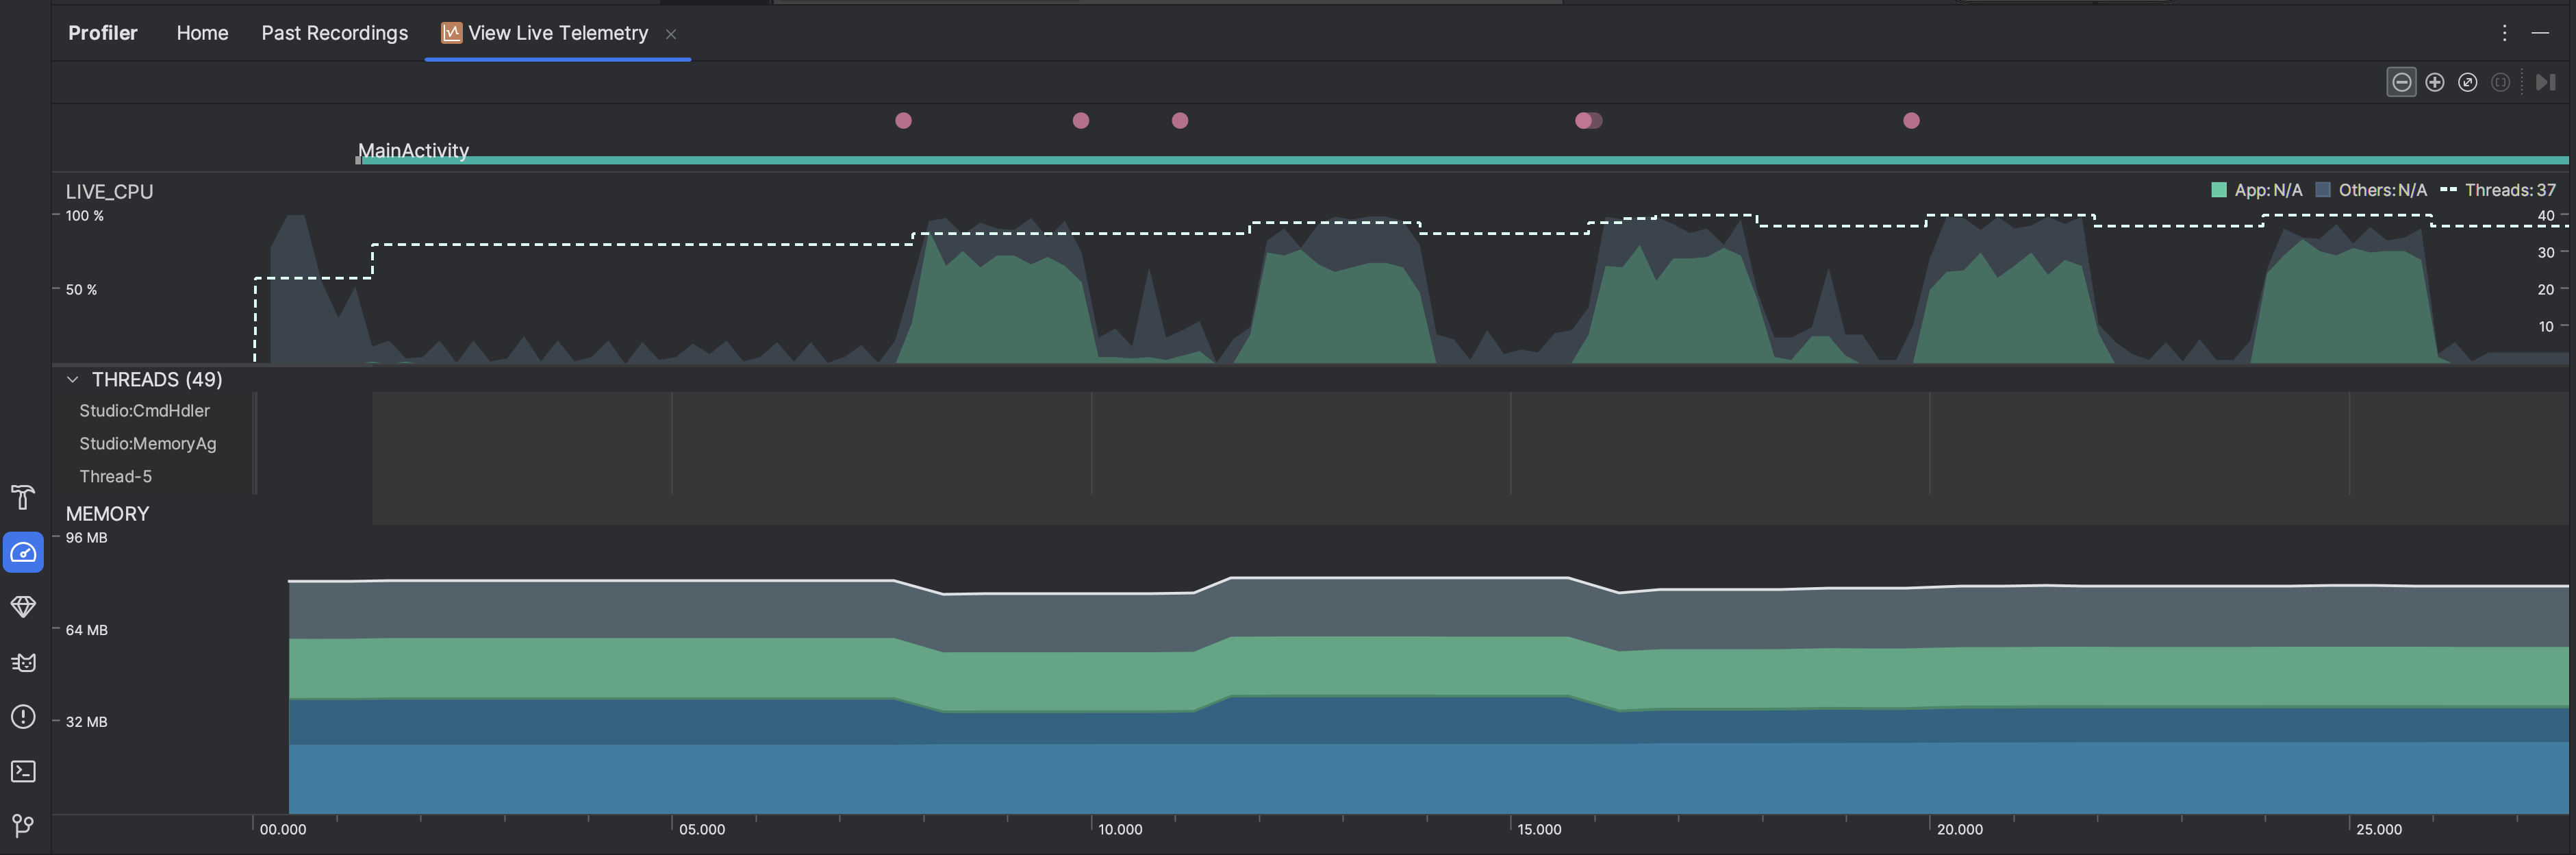
লাইভ ভিউ শুরু করতে, ভিউ লাইভ টেলিমেট্রি প্রোফাইলিং টাস্ক নির্বাচন করুন । যখন কাজটি শুরু হয়, এটি রিয়েল টাইমে নিম্নলিখিত ভিজ্যুয়ালাইজেশনগুলি প্রদর্শন করা শুরু করে:
- ইন্টারঅ্যাকশন: একটি টাইমলাইন বরাবর ব্যবহারকারীর ইন্টারঅ্যাকশন এবং অ্যাপ লাইফসাইকেল ইভেন্টগুলি দেখায় (একটি ডিবাগযোগ্য অ্যাপ প্রক্রিয়া এবং API স্তর 26 বা উচ্চতর চলমান একটি ডিভাইস প্রয়োজন)।
- CPU ব্যবহার: আপনার অ্যাপের রিয়েল-টাইম CPU ব্যবহার দেখায়—মোট উপলব্ধ CPU সময়ের শতাংশ হিসেবে—এবং আপনার অ্যাপ ব্যবহার করা মোট থ্রেডের সংখ্যা। টাইমলাইন অন্যান্য প্রসেসের (যেমন সিস্টেম প্রসেস বা অন্যান্য অ্যাপ) এর CPU ব্যবহারও দেখায়, তাই আপনি এটিকে আপনার অ্যাপের ব্যবহারের সাথে তুলনা করতে পারেন। আপনি টাইমলাইনের অনুভূমিক অক্ষ বরাবর আপনার মাউস সরানোর মাধ্যমে ঐতিহাসিক CPU ব্যবহার ডেটা পরিদর্শন করতে পারেন।
- থ্রেড: আপনার অ্যাপ প্রক্রিয়ার অন্তর্গত প্রতিটি থ্রেড তালিকাভুক্ত করে এবং নিম্নলিখিত রং ব্যবহার করে একটি টাইমলাইনে এর কার্যকলাপ নির্দেশ করে:
- সবুজ: থ্রেড সক্রিয় বা CPU ব্যবহার করার জন্য প্রস্তুত। অর্থাৎ, এটি একটি চলমান বা রানযোগ্য অবস্থায় রয়েছে।
- হলুদ: থ্রেডটি সক্রিয়, কিন্তু এটি কাজ শেষ করার আগে এটি একটি I/O অপারেশনের জন্য অপেক্ষা করছে (উদাহরণস্বরূপ, ডিস্ক বা নেটওয়ার্ক I/O)।
- ধূসর: থ্রেড ঘুমোচ্ছে এবং কোন CPU সময় গ্রাস করছে না। এটি কখনও কখনও ঘটে যখন থ্রেডের এমন একটি সংস্থান অ্যাক্সেসের প্রয়োজন হয় যা এখনও উপলব্ধ নয়। হয় থ্রেডটি স্বেচ্ছায় ঘুমের মধ্যে যায়, অথবা প্রয়োজনীয় সংস্থান উপলব্ধ না হওয়া পর্যন্ত কার্নেল থ্রেডটিকে ঘুমাতে রাখে।
- CPU প্রোফাইলার সেই থ্রেডগুলির CPU ব্যবহারেরও রিপোর্ট করে যা Android Studio এবং Android প্ল্যাটফর্ম আপনার অ্যাপ প্রক্রিয়ায় যোগ করে—যেমন
JDWP
, Profile Saver
, Studio:VMStats
, Studio:Perfa
, এবং Studio:Heartbeat
(যদিও, সঠিক নামগুলি থ্রেড কার্যকলাপের সময়রেখা পরিবর্তিত হতে পারে)। অ্যান্ড্রয়েড স্টুডিও এই ডেটা রিপোর্ট করে যাতে আপনি শনাক্ত করতে পারেন কখন থ্রেড অ্যাক্টিভিটি এবং সিপিইউ ব্যবহার আসলে আপনার অ্যাপের কোডের কারণে হয়।
- মেমরি: প্রতিটি মেমরি বিভাগ দ্বারা কত মেমরি ব্যবহার করা হচ্ছে তার একটি স্ট্যাক করা গ্রাফ দেখায়, বাম দিকের y-অক্ষ এবং উপরে রঙ কী দ্বারা নির্দেশিত।

এই পৃষ্ঠার কন্টেন্ট ও কোডের নমুনাগুলি Content License-এ বর্ণিত লাইসেন্সের অধীনস্থ। Java এবং OpenJDK হল Oracle এবং/অথবা তার অ্যাফিলিয়েট সংস্থার রেজিস্টার্ড ট্রেডমার্ক।
2025-07-29 UTC-তে শেষবার আপডেট করা হয়েছে।
[null,null,["2025-07-29 UTC-তে শেষবার আপডেট করা হয়েছে।"],[],[],null,["# Inspect your app live\n\nInspecting your app live gives you a high-level overview of the device's CPU\nusage, thread activity, and memory usage. If you don't know where to start with\nprofiling your app, use live view to conduct an exploratory analysis, and then\ndig deeper with the specific profiling tasks when you see behavior that can be\noptimized.\n\nTo start live view,\n[select the **View Live Telemetry** profiling task](/studio/profile#start-profiling).\nWhen the task starts, it starts displaying the following visualizations in real\ntime:\n\n- Interactions: Shows user interaction and app lifecycle events along a timeline (requires a [debuggable](/studio/profile#profileable-v-debuggable) app process and a device running API level 26 or higher).\n- CPU usage: Shows real-time CPU usage of your app---as a percentage of total available CPU time---and the total number of threads your app is using. The timeline also shows the CPU usage of other processes (such as system processes or other apps), so you can compare it to your app's usage. You can inspect historical CPU usage data by moving your mouse along the horizontal axis of the timeline.\n- Threads: Lists each thread that belongs to your app process and indicates its activity along a timeline using the following colors:\n - Green: The thread is active or is ready to use the CPU. That is, it's in a running or runnable state.\n - Yellow: The thread is active, but it's waiting on an I/O operation (for example, disk or network I/O) before it can complete its work.\n - Gray: The thread is sleeping and is not consuming any CPU time. This sometimes occurs when the thread requires access to a resource that is not yet available. Either the thread goes into voluntary sleep, or the kernel puts the thread to sleep until the required resource becomes available.\n - The CPU Profiler also reports CPU usage of threads that Android Studio and the Android platform add to your app process---such as `JDWP`, `Profile\n Saver`, `Studio:VMStats`, `Studio:Perfa`, and `Studio:Heartbeat` (although, the exact names displayed in the thread activity timeline might vary). Android Studio reports this data so that you can identify when thread activity and CPU usage are actually caused by your app's code.\n- Memory: Shows a stacked graph of how much memory is being used by each memory category, as indicated by the y-axis on the left and the color key at the top."]]