实时检查应用
使用集合让一切井井有条
根据您的偏好保存内容并对其进行分类。
通过实时检查应用,您可以大致了解设备的 CPU 使用情况、线程活动和内存使用情况。如果您不知道从何处着手分析应用,请使用实时视图进行探索性分析,然后在发现可优化的行为时,通过特定的分析任务深入了解。
如需开始实时查看,请选择 View Live Telemetry 分析任务。
任务开始后,系统会开始实时显示以下可视化图表:
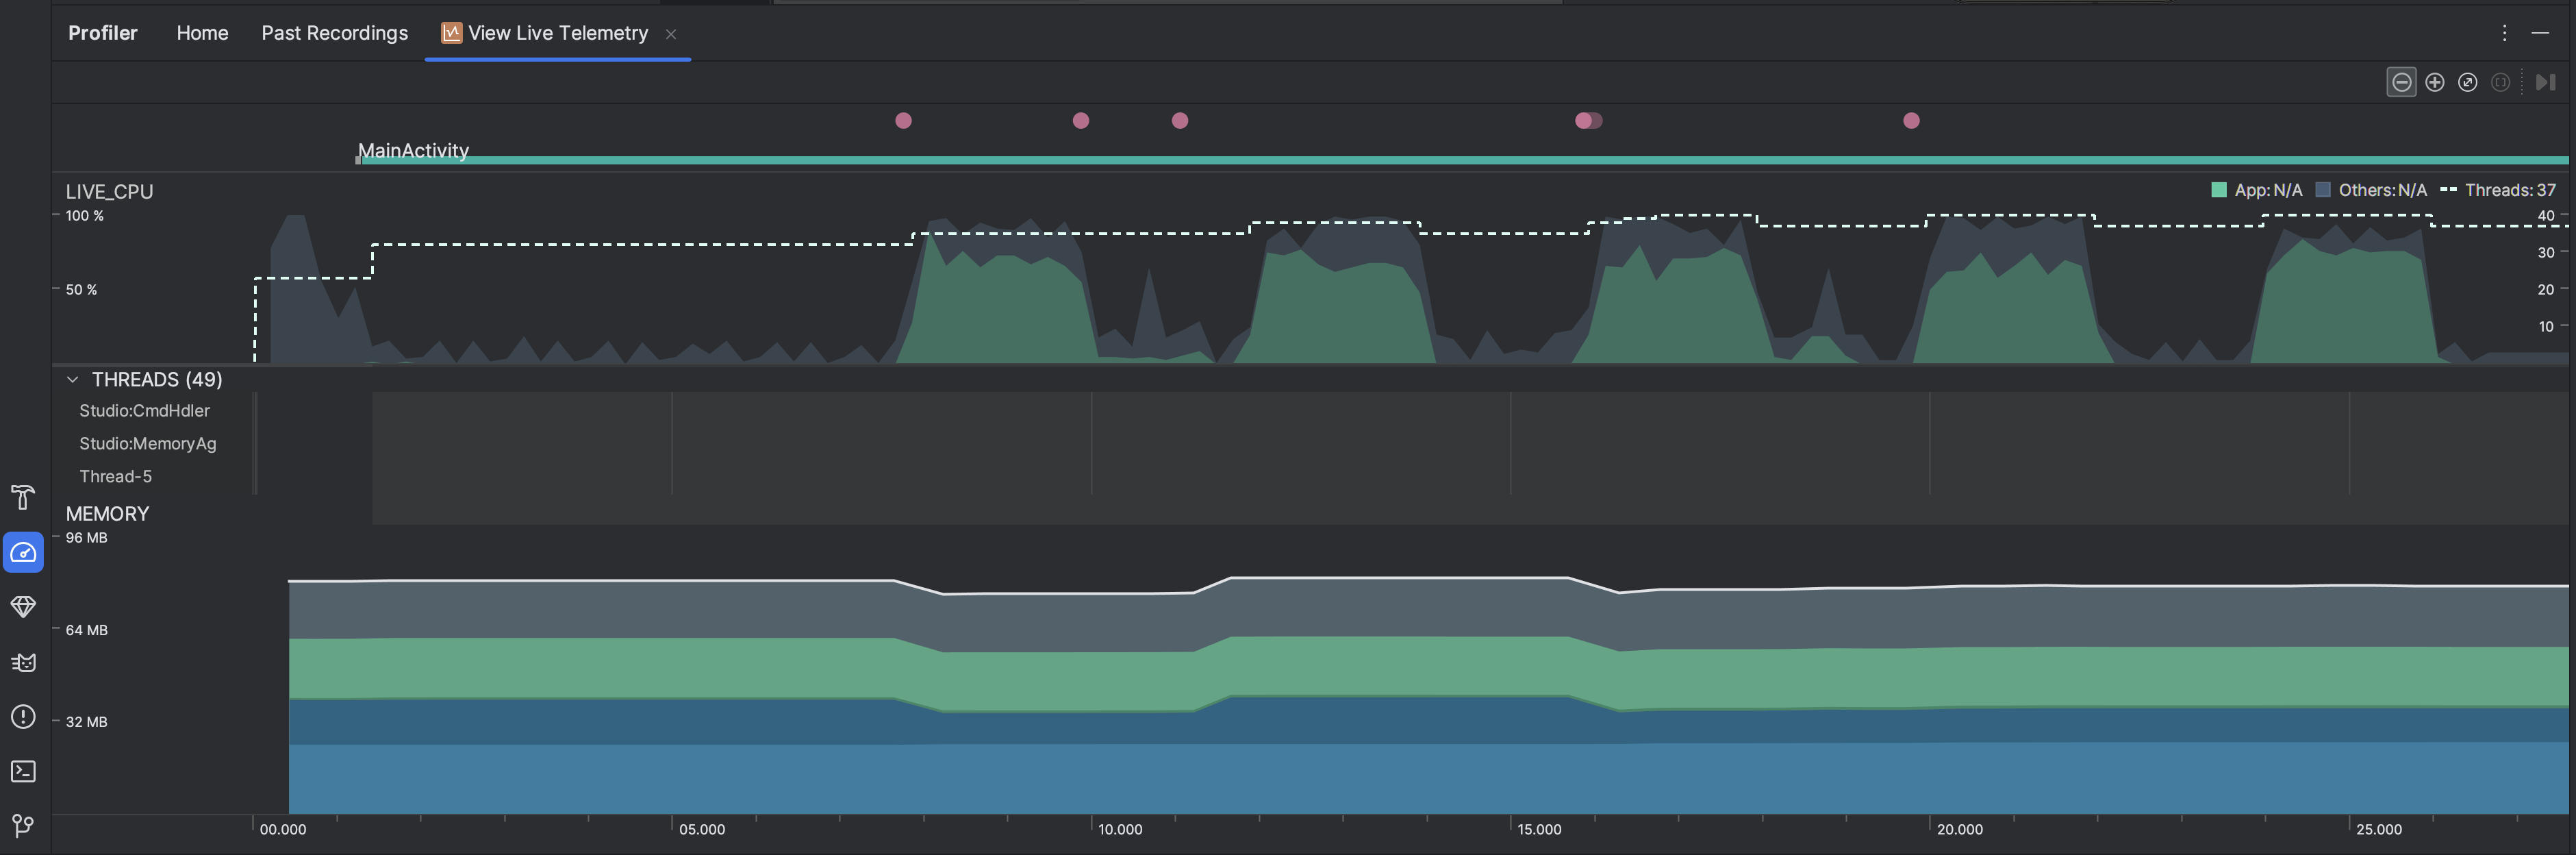
- 互动:沿着时间轴显示用户互动和应用生命周期事件(需要可调试的应用进程和搭载 API 级别 26 或更高版本的设备)。
- CPU 使用率:显示应用的实时 CPU 使用率(以占总可用 CPU 时间的百分比表示)以及应用当前使用的线程总数。此时间轴还会显示其他进程(如系统进程或其他应用)的 CPU 使用率,以便您可以将其与您应用的 CPU 使用率进行对比。您可以通过沿时间轴的横轴方向移动鼠标来检查历史 CPU 使用率数据。
- 线程:列出属于应用进程的每个线程,并使用以下颜色在时间轴上指示它们的活动:
- 绿色:表示线程处于活跃状态或准备使用 CPU。也就是说,线程处于正在运行或可运行状态。
- 黄色:表示线程处于活跃状态,但它正在等待一项 I/O 操作(如磁盘或网络 I/O),然后才能完成它的工作。
- 灰色:表示线程正在休眠且没有消耗任何 CPU 时间。当线程需要访问尚不可用的资源时,就会出现这种情况。在这种情况下,要么线程主动进入休眠状态,要么内核将线程置于休眠状态,直到所需的资源可用。
- CPU 性能分析器还会报告 Android Studio 和 Android 平台添加到应用进程的线程的 CPU 使用率,这些线程包括
JDWP
、Profile
Saver
、Studio:VMStats
、Studio:Perfa
和 Studio:Heartbeat
等(不过,它们在线程活动时间轴上显示的确切名称可能有所不同)。Android Studio 报告此数据是为了方便您确定线程活动和 CPU 使用率实际什么时候由应用的代码引发。
- 内存:显示一个堆叠图表,其中显示了每个内存类别当前使用多少内存,如左侧的 y 轴以及顶部的彩色键所示。

本页面上的内容和代码示例受内容许可部分所述许可的限制。Java 和 OpenJDK 是 Oracle 和/或其关联公司的注册商标。
最后更新时间 (UTC):2025-07-27。
[null,null,["最后更新时间 (UTC):2025-07-27。"],[],[],null,["# Inspect your app live\n\nInspecting your app live gives you a high-level overview of the device's CPU\nusage, thread activity, and memory usage. If you don't know where to start with\nprofiling your app, use live view to conduct an exploratory analysis, and then\ndig deeper with the specific profiling tasks when you see behavior that can be\noptimized.\n\nTo start live view,\n[select the **View Live Telemetry** profiling task](/studio/profile#start-profiling).\nWhen the task starts, it starts displaying the following visualizations in real\ntime:\n\n- Interactions: Shows user interaction and app lifecycle events along a timeline (requires a [debuggable](/studio/profile#profileable-v-debuggable) app process and a device running API level 26 or higher).\n- CPU usage: Shows real-time CPU usage of your app---as a percentage of total available CPU time---and the total number of threads your app is using. The timeline also shows the CPU usage of other processes (such as system processes or other apps), so you can compare it to your app's usage. You can inspect historical CPU usage data by moving your mouse along the horizontal axis of the timeline.\n- Threads: Lists each thread that belongs to your app process and indicates its activity along a timeline using the following colors:\n - Green: The thread is active or is ready to use the CPU. That is, it's in a running or runnable state.\n - Yellow: The thread is active, but it's waiting on an I/O operation (for example, disk or network I/O) before it can complete its work.\n - Gray: The thread is sleeping and is not consuming any CPU time. This sometimes occurs when the thread requires access to a resource that is not yet available. Either the thread goes into voluntary sleep, or the kernel puts the thread to sleep until the required resource becomes available.\n - The CPU Profiler also reports CPU usage of threads that Android Studio and the Android platform add to your app process---such as `JDWP`, `Profile\n Saver`, `Studio:VMStats`, `Studio:Perfa`, and `Studio:Heartbeat` (although, the exact names displayed in the thread activity timeline might vary). Android Studio reports this data so that you can identify when thread activity and CPU usage are actually caused by your app's code.\n- Memory: Shows a stacked graph of how much memory is being used by each memory category, as indicated by the y-axis on the left and the color key at the top."]]