CPU Profiler のトレースビューでは、記録したトレースの情報を確認する方法がいくつかあります。
メソッド トレースと関数トレースの場合は、[Call Chart] を [Threads] タイムラインに直接表示し、[Analysis] ペインの [Flame Chart] タブ、[Top Down] タブ、[Bottom Up] タブ、[Events] タブを表示できます。コールスタック フレームの場合は、コードの実行された部分と、それが呼び出された理由を表示できます。システム トレースの場合は、[Trace Events] を [Threads] タイムラインに直接表示し、[Analysis] ペインの [Flame Chart] タブ、[Top Down] タブ、[Bottom Up] タブ、[Events] タブを表示できます。
マウスとキーボード ショートカットを使用すると、[Call Chart] または [Trace Events] での移動が簡単になります。
Call Chart を使用してトレースを検証する
[Call Chart] にはメソッド トレースまたは関数トレースがグラフィックで表示されます。呼び出しの期間とタイミングが横軸で、呼び出し先が縦軸で示されます。システム API へのメソッド呼び出しはオレンジで、アプリのメソッドへの呼び出しは緑で、サードパーティの API(Java 言語 API を含む)への呼び出しは青で示されます。図 4 は呼び出しチャートの例です。セルフ時間、子時間、特定のメソッドまたは関数の合計時間の概念を示しています。これらの概念については、Top Down タブと Bottom Up タブを使用してトレースを検証する方法のセクションで説明します。
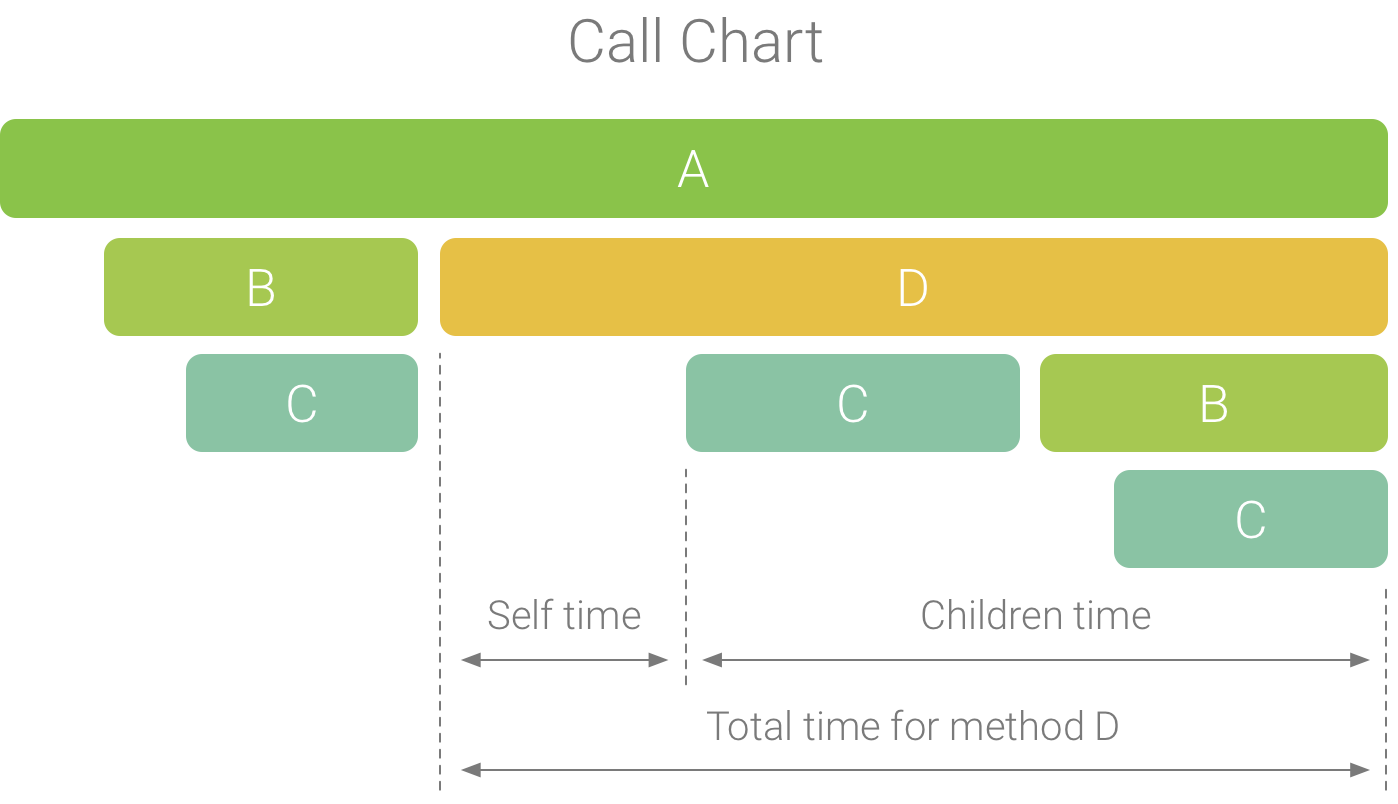
図 1. セルフ時間、子時間、メソッド D の合計時間を示した呼び出しチャートの例。
ヒント: メソッドまたは関数のソースコードにジャンプするには、メソッドまたは関数を右クリックして [Jump to Source] を選択します。この操作は、[Analysis] ペインのすべてのタブで行えます。
Flame Chart タブを使用してトレースを検証する
[Flame Chart] タブには、同一のコールスタックが集約される反転された呼び出しチャートが表示されます。つまり、同じシーケンスの呼び出し元を共有する同一のメソッドまたは関数が集められ、(呼び出しチャートのようにメソッドまたは関数を複数の短いバーで表示せずに)フレーム チャートに 1 つの長いバーとして表されます。これにより、最も時間を消費しているメソッドまたは関数がわかりやすくなります。ただし、この場合横軸はタイムラインを表さず、その代わりに各メソッドの実行にかかった相対的な時間が示されます。
この概念について、図 2 に示す呼び出しチャートを例に説明します。メソッド D が B に対して複数の呼び出し(B1、B2、B3)を行い、B に対するこれらの呼び出しの一部が C に対して呼び出し(C1 と C3)を行っていることに注意してください。
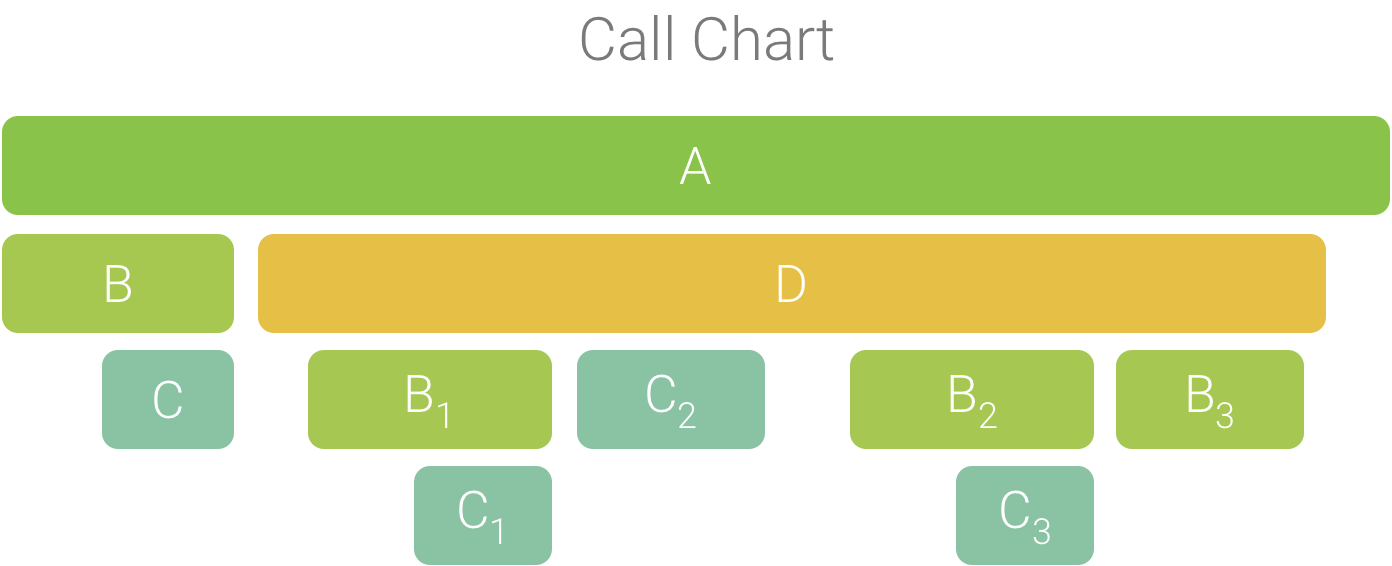
図 2. 共通のシーケンスの呼び出し元を共有している複数のメソッド呼び出しが含まれた呼び出しチャート。
B1、B2、B3 は、同じシーケンスの呼び出し元(A → D → B)を共有しているため、図 3 のように集約されます。同様に、同じシーケンスの呼び出し元(A → D → B → C)を共有している C1 と C3 も集約されます。C2 の呼び出し元のシーケンスは異なるため(A → D → C)、集約に含まれないことに注意してください。

図 3. 同じコールスタックを共有している同一のメソッドの集約。
集約された呼び出しは、図 4 に示すようにフレーム チャートの作成に使用されます。フレーム チャート内の特定の呼び出しについて、最も CPU 時間を消費する呼び出し先が最初に表示されることに注意してください。
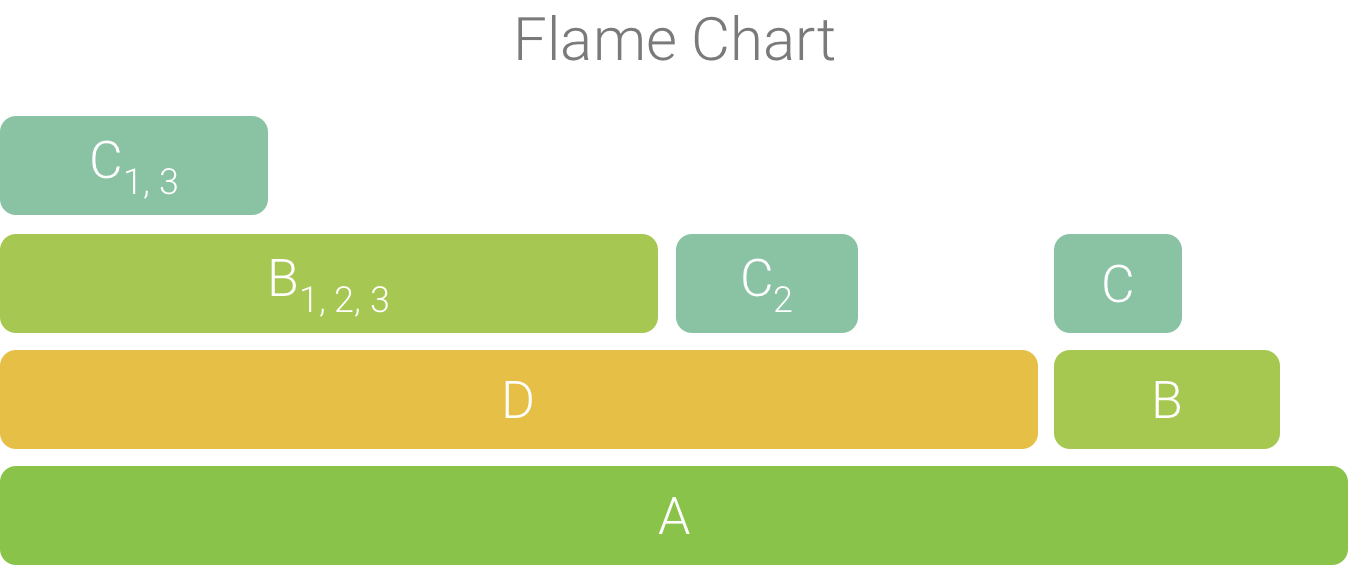
図 4. 図 5 の呼び出しチャートをフレーム チャートで表した図。
Top Down タブと Bottom Up タブを使用してトレースを検証する
[Top Down] タブには呼び出しの一覧が表示され、メソッドノードまたは関数ノードを展開すると呼び出し先が表示されます。図 5 は、図 1 の呼び出しチャートのトップダウン グラフを示しています。グラフ内の各矢印は、呼び出し元から呼び出し先を指しています。
図 5 に示すように、[Top Down] タブでメソッド A のノードを展開すると、その呼び出し先であるメソッド B とメソッド D が表示されます。さらに、メソッド D のノードを展開すると、その呼び出し先であるメソッド B とメソッド C が表示され、メソッド B でも同じように呼び出し先が表示されます。[Flame Chart] タブの場合と同じように、トップダウン ツリーでは同じコールスタックを共有している同一のメソッドのトレース情報が集約されます。つまり、[Flame Chart] タブの表示は [Top Down] タブをグラフィックで表示したものです。
[Top Down] タブには、各呼び出しに費やされた CPU 時間の把握に役立つ次の情報が表示されます(時間は、選択した範囲にあるスレッドの合計時間の割合としても表されます)。
- Self: 図 1 のメソッド D が示すように、メソッドまたは関数の呼び出しが自身のコードの実行に費やした時間であり、呼び出し先の実行に費やした時間ではありません。
- Children: 図 1 のメソッド D が示すように、メソッドまたは関数呼び出しがその呼び出し先の実行に費やした時間であり、自身のコードの実行に費やした時間ではありません。
- Total: メソッドの Self 時間と Children 時間の合計です。図 1 のメソッド D が示すように、アプリがメソッド呼び出しの実行に費やした合計時間を表します。
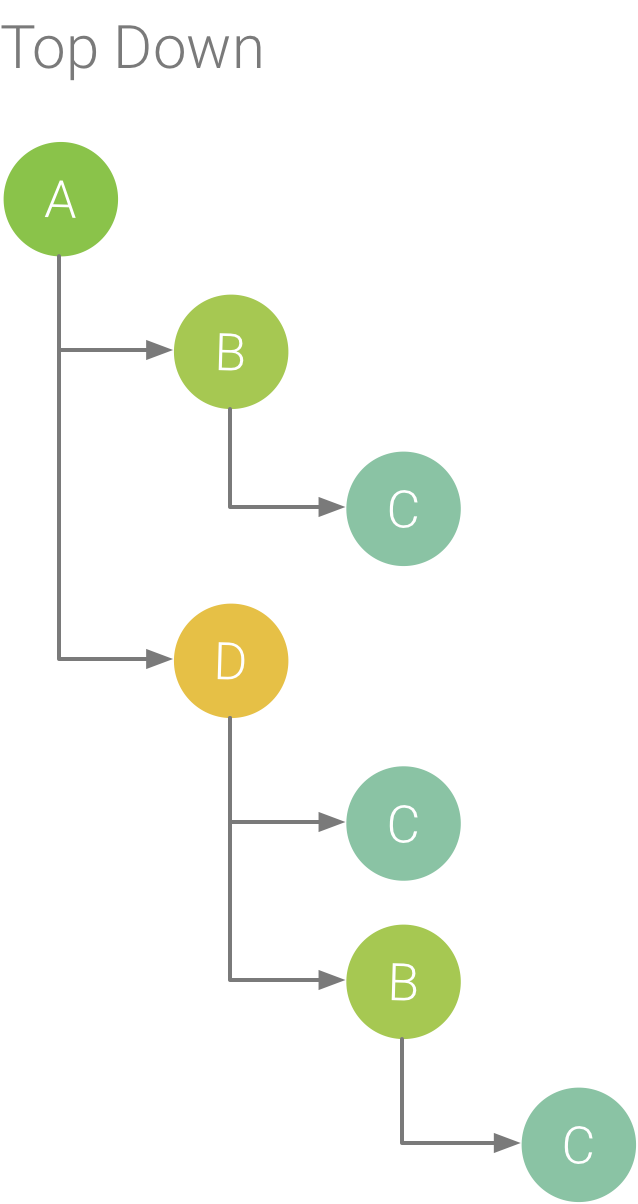
図 5. トップダウン ツリー。
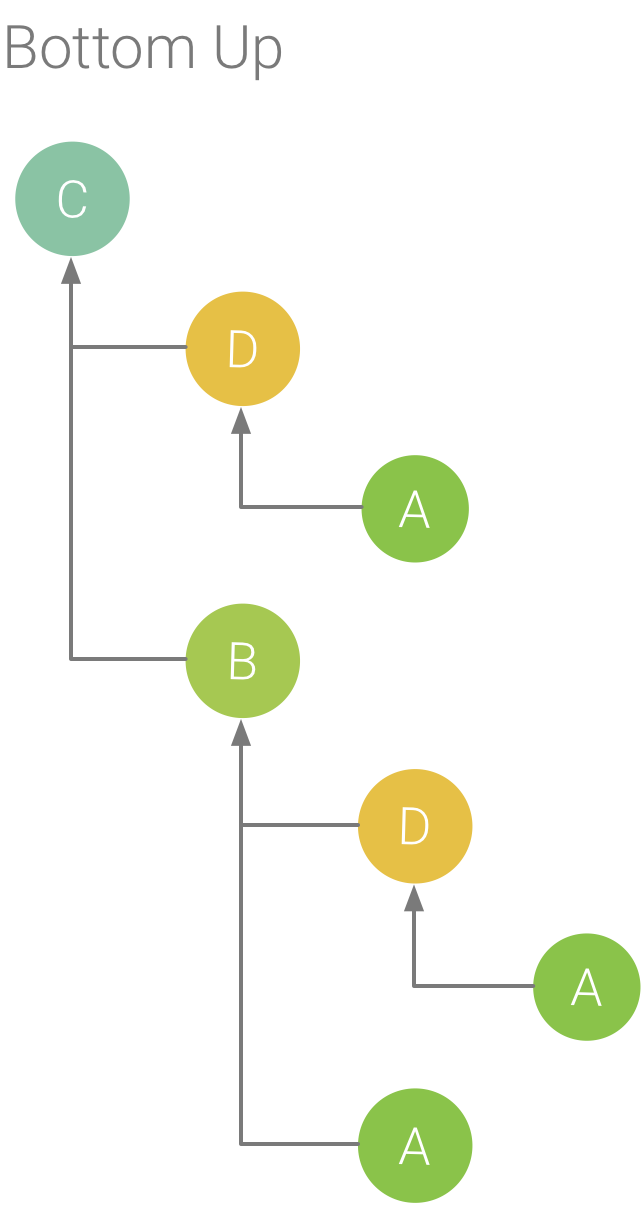
図 6. 図 5 のメソッド C のボトムアップ ツリー
[Bottom Up] タブには、呼び出しの一覧が表示され、メソッドまたは関数のノードを展開するとその呼び出し元が表示されます。図 6 では、図 5 で示すトレース例を使用してメソッド C のボトムアップ ツリーを示しています。ボトムアップ ツリーでメソッド C のノードを開くと、その一意の各呼び出し元であるメソッド B とメソッド D が表示されます。メソッド B はメソッド C を 2 回呼び出しますが、ボトムアップ ツリーでメソッド C のノードを展開すると、メソッド B が 1 つだけ表示されることに注意してください。さらに、メソッド B のノードを展開すると、その呼び出し元であるメソッド A とメソッド D が表示されます。
[Bottom Up] タブは、メソッドまたは関数を最も多くの(または最も少ない)CPU 時間を消費したスレッド順に並べ替える際に便利です。各ノードを調べると、これらのメソッドまたは関数を呼び出すときに最も多くの CPU 時間を消費した呼び出し元を特定できます。トップダウン ツリーとは異なり、ボトムアップ ツリーの各メソッドまたは関数の計時情報は、各ツリーの最上部のメソッド(トップノード)に関連しています。CPU 時間は、記録中のスレッドの合計時間の割合としても表されます。次の表は、トップノードとその呼び出し元(サブノード)の計時情報を解釈する方法を理解するために役立ちます。
| Self | Children | 合計 | |
|---|---|---|---|
| ボトムアップ ツリーの最上位のメソッドまたは関数(トップノード) | メソッドまたは関数がその呼び出し先ではなく自身のコードの実行に費やした合計時間。トップダウン ツリーとは異なり、この計時情報は、記録中におけるメソッドまたは関数へのすべての呼び出しの合計時間を表しています。 | メソッドまたは関数が自身のコードではなくその呼び出し先の実行に費やした合計時間。トップダウン ツリーとは異なり、この計時情報は、記録中におけるメソッドまたは関数の呼び出し先へのすべての呼び出しの合計時間を表しています。 | セルフ時間と子時間の合計。 |
| 呼び出し元(サブノード) | 呼び出し元から呼び出されたときの呼び出し先のセルフ時間の合計。図 6 のボトムアップ ツリーを例として説明すると、メソッド B のセルフ時間は、メソッド B から呼び出されるたびに実行されるメソッド C のセルフ時間の合計に等しくなります。 | 呼び出し元から呼び出されたときの呼び出し先の子時間の合計。図 6 のボトムアップ ツリーを例として説明すると、メソッド B の子時間は、メソッド B から呼び出されるたびに実行されるメソッド C の子時間の合計に等しくなります。 | セルフ時間と子時間の合計。 |
注: Android Studio は、特定の記録中にプロファイラがファイルサイズの制限に達すると、新しいデータの収集を停止します(ただし、記録は停止しません)。通常、インストルメント化されたトレースを実行すると、データの収集がより早く停止します。このタイプのトレースでは、サンプリング ベースのトレースよりも短い時間でより多くのデータを収集するからです。インスペクション タイムフレームを制限への到達後に発生した記録期間に拡張した場合、トレースペインのタイミング データは変化しません(新しいデータが利用できないため)。また、データが利用できない記録の部分のみを選択すると、トレースペインには計時情報として NaN が表示されます。
イベント テーブルを使用してトレースを検証する
イベント テーブルには、現在選択されているスレッドのすべての呼び出しが表示されます。並べ替えるには、列見出しをクリックします。テーブルの行を選択すると、選択した呼び出しの開始時間と終了時間まで、タイムラインを移動できます。これにより、タイムライン上のイベントを正確に特定できます。
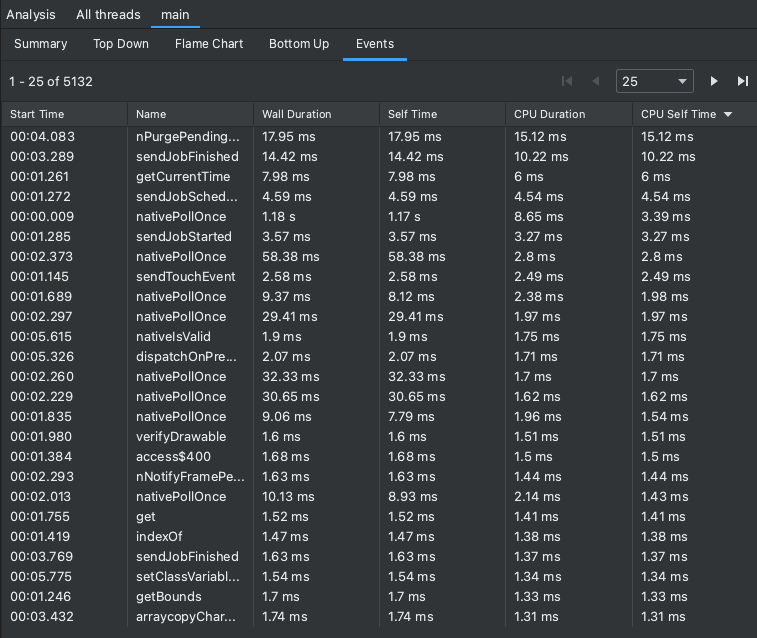
図 7. [Analysis] ペインの [Events] タブの表示。
コールスタック フレームを検証する
コールスタックは、コードの実行された部分と、それが呼び出された理由を把握するために役立ちます。Java / Kotlin プログラムについて Callstack Sample Recording を収集した場合、コールスタックには通常、Java / Kotlin コードだけでなく、JNI ネイティブ コード、Java 仮想マシン(例: android::AndroidRuntime::start)、システム カーネル([kernel.kallsyms]+offset)からのフレームも含まれます。これは、Java / Kotlin プログラムは通常、Java 仮想マシンを介して実行されるためです。ネイティブ コードは、プログラム自体を実行するために、また、プログラムがシステムやハードウェアと通信するために必要です。プロファイラは、これらのフレームを正確に提示します。ただし調べる内容によっては、こうした追加の呼び出しフレームが役立つ場合もあれば、そうでない場合もあります。プロファイラには、必要のないフレームを閉じ、調べる内容に関係のない情報を非表示にする機能があります。
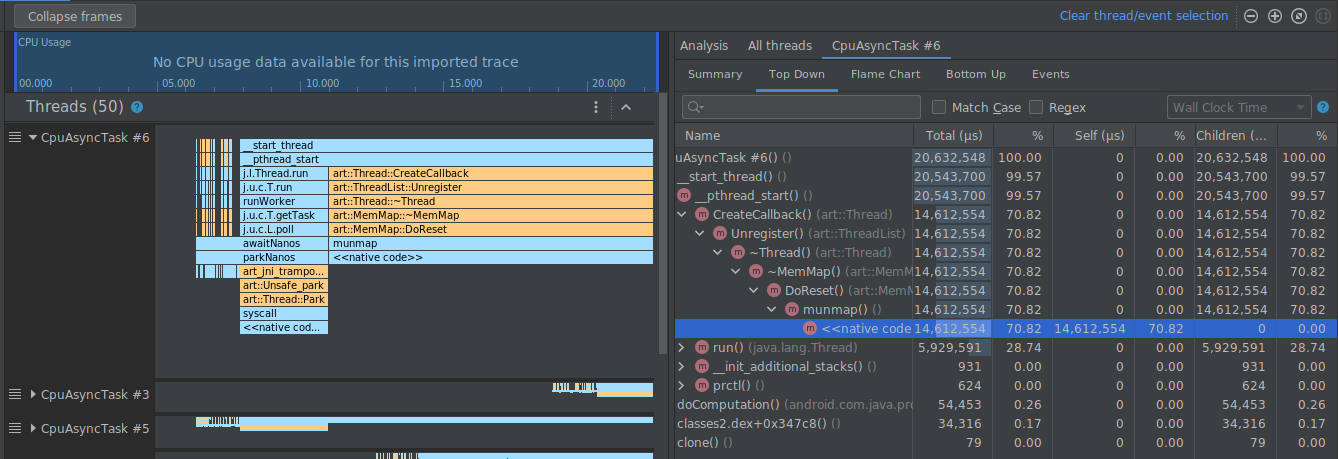
以下の例では、トレースに [kernel.kallsyms]+offset とラベル付けされたフレームが多数ありますが、これらは現時点では開発に役立ちません。
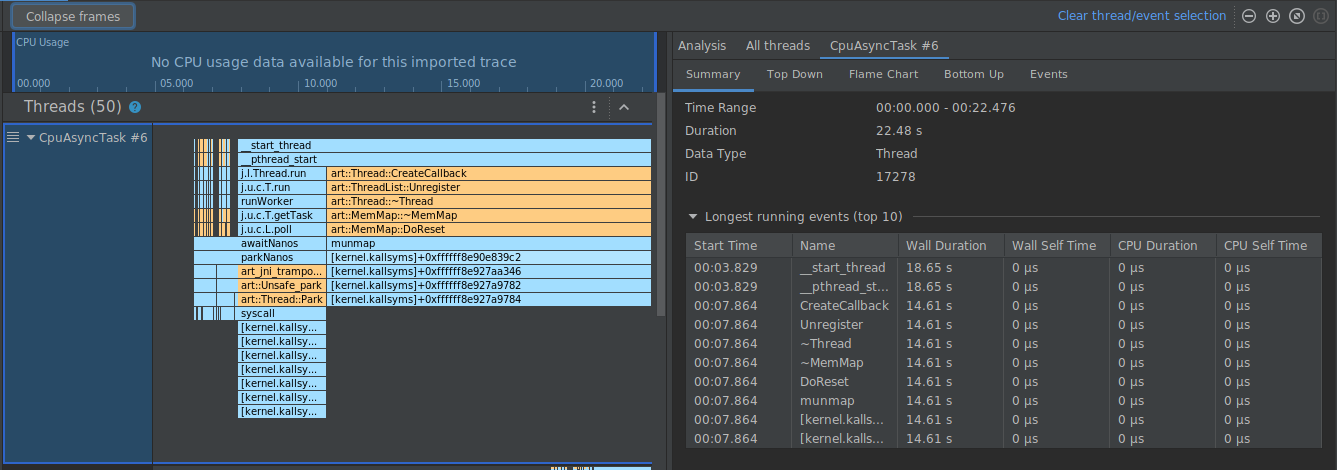
これらのフレームを閉じて 1 つにするには、ツールバーの [Collapse frames] ボタンを選択し、閉じるパスを選択して、[Apply] ボタンを選択します。これで変更が適用されます。この例では、パスは [kernel.kallsyms] です。
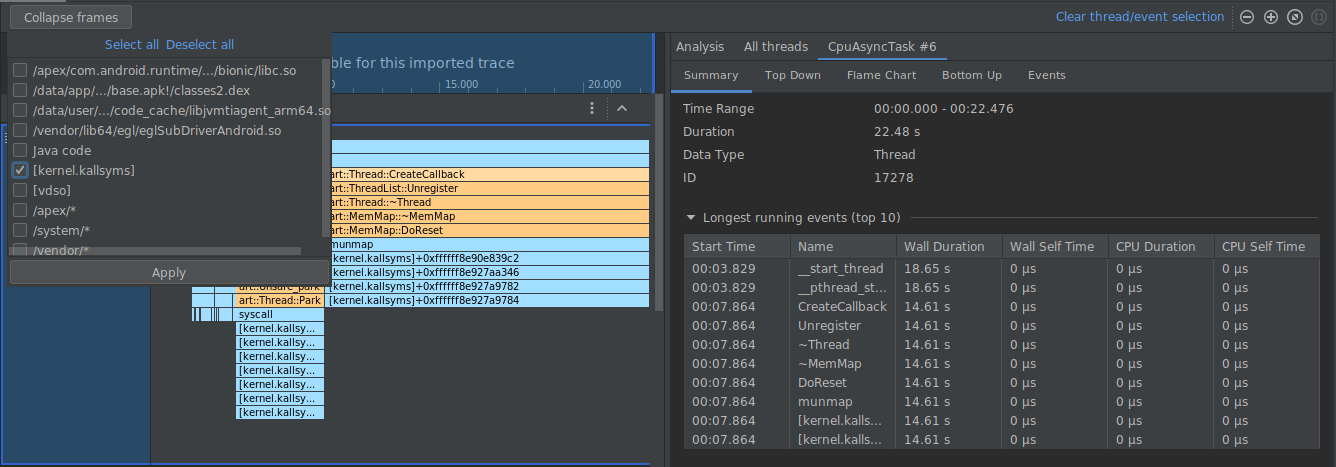
変更を適用すると下図のとおり、左右のパネルで、選択したパスに対応するフレームが閉じられます。
システム トレースを検証する
システム トレースを検証するとき、[Threads] タイムラインで [Trace Events] を調べて、各スレッドで発生するイベントの詳細を表示できます。イベントにマウスポインタを合わせると、イベントの名前と、各状況で費やした時間が表示されます。イベントをクリックすると、[Analysis] ペインに詳細が表示されます。
システム トレースを検証する: CPU コア
CPU スケジューリング データに加えて、システム トレースにはコアごとの CPU 周波数も含まれます。これにより、各コアのアクティビティの量が表示され、どのコアが最新のモバイル プロセッサの「ビッグ」コアまたは「リトル」コアであるかを把握するのに役立ちます。
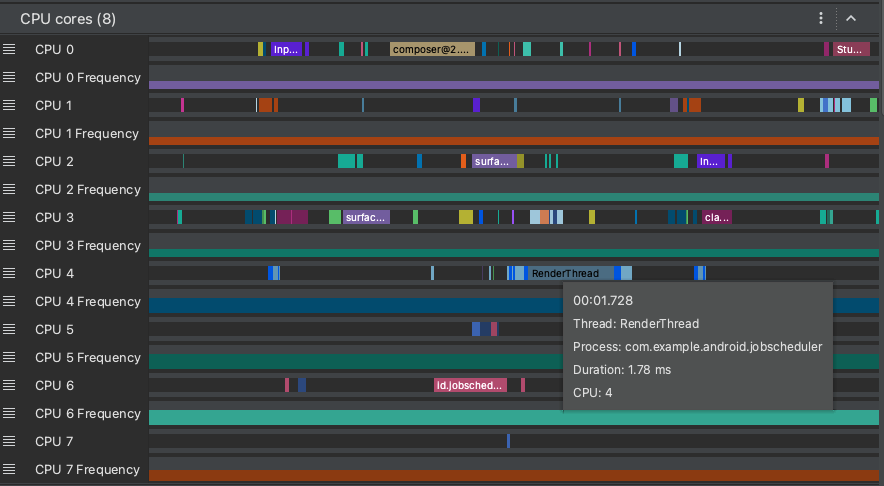
図 8. レンダリング スレッドの CPU アクティビティとトレース イベントの表示。
図 8 に示すように、[CPU Cores] ペインには、各コアでスケジュールされたスレッド アクティビティが表示されます。スレッド アクティビティにマウスポインタを合わせると、そのコアが動作しているスレッドを確認できます。
システム トレース情報の検査については、systrace ドキュメントの UI のパフォーマンスに関する問題を調査するセクションをご覧ください。
システム トレースを検証する: フレーム レンダリング タイムライン
メインスレッドと RenderThread で各フレームをレンダリングする際にかかる時間を調べて、UI ジャンクと低フレームレートの原因となるボトルネックを調査できます。システム トレースを使用して UI ジャンクを調査または減らす方法については、UI ジャンクの検出をご覧ください。
システム トレースを検証する: プロセスメモリ(RSS)
Android 9 以降を搭載したデバイスにデプロイされたアプリの場合、[Process Memory (RSS)] セクションには、アプリが現在使用している物理メモリの量が表示されます。

図 9. プロファイラの物理メモリの表示。
Total
プロセスが現在使用している物理メモリの合計量です。これは Unix ベースのシステムでは「Resident Set Size」と呼ばれ、匿名割り当て、ファイル マッピング、共有メモリ割り当てで使用される、すべてのメモリを合算したものです。
Resident Set Size は、Windows の Working Set Size と同等のものです。
Allocated
このカウンタは、プロセスの通常のメモリ割り当てで現在使用されている物理メモリの量を追跡します。割り当ては、匿名(特定のファイルによらない)と非公開(共有されていない)です。ほとんどのアプリでは、ヒープ割り当て(malloc または new)とスタックメモリで構成されます。物理メモリからスワップアウトされると、こうした割り当てはシステム スワップ ファイルに書き込まれます。
File Mappings
このカウンタは、プロセスがファイル マッピングに使用している物理メモリの量(メモリ マネージャーによってファイルからメモリ領域にマッピングされたメモリの量)を追跡します。
Shared
このカウンタは、このプロセスとシステム内の他のプロセスとの間でメモリを共有するために使用されている物理メモリの量を追跡します。

