
Android 通过从应用生成帧并将其显示在屏幕上来呈现界面。如果您的应用存在界面呈现缓慢的问题,系统会不得不跳过一些帧。发生这种情况时,用户会看到屏幕上不断闪烁,这种情况称为卡顿。
出现卡顿通常是因为界面线程(在大多数应用中是主线程)上存在一些减速或阻塞异步调用。您可以利用系统轨迹找出问题所在。
在 Android 12 及更高版本上检测卡顿情况
对于搭载 Android 12(API 级别 31)或更高版本的设备,CPU 性能分析器中 Display 窗格下的 Janky Frameworks 轨道中会显示捕获的轨迹。
如需检测卡顿情况,请按以下步骤操作:
在 Android Studio 中,依次选择 View > Tool Windows > Profiler,或点击工具栏中的 Profile 图标
 。
。如果 Select Deployment Target 对话框显示提示,请选择要将您的应用部署到哪个设备以进行性能分析。如果您已通过 USB 连接设备但系统未列出该设备,请确保您已启用 USB 调试。
点击 CPU 时间轴上的任意位置以打开 CPU 性能分析器。
从 CPU 性能分析器的配置菜单中选择 System Trace,然后点击 Record。完成与应用的交互后,点击 Stop。
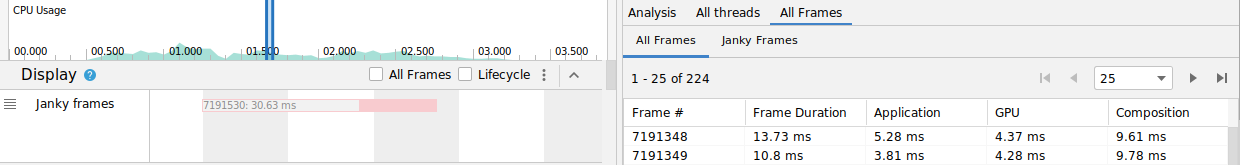
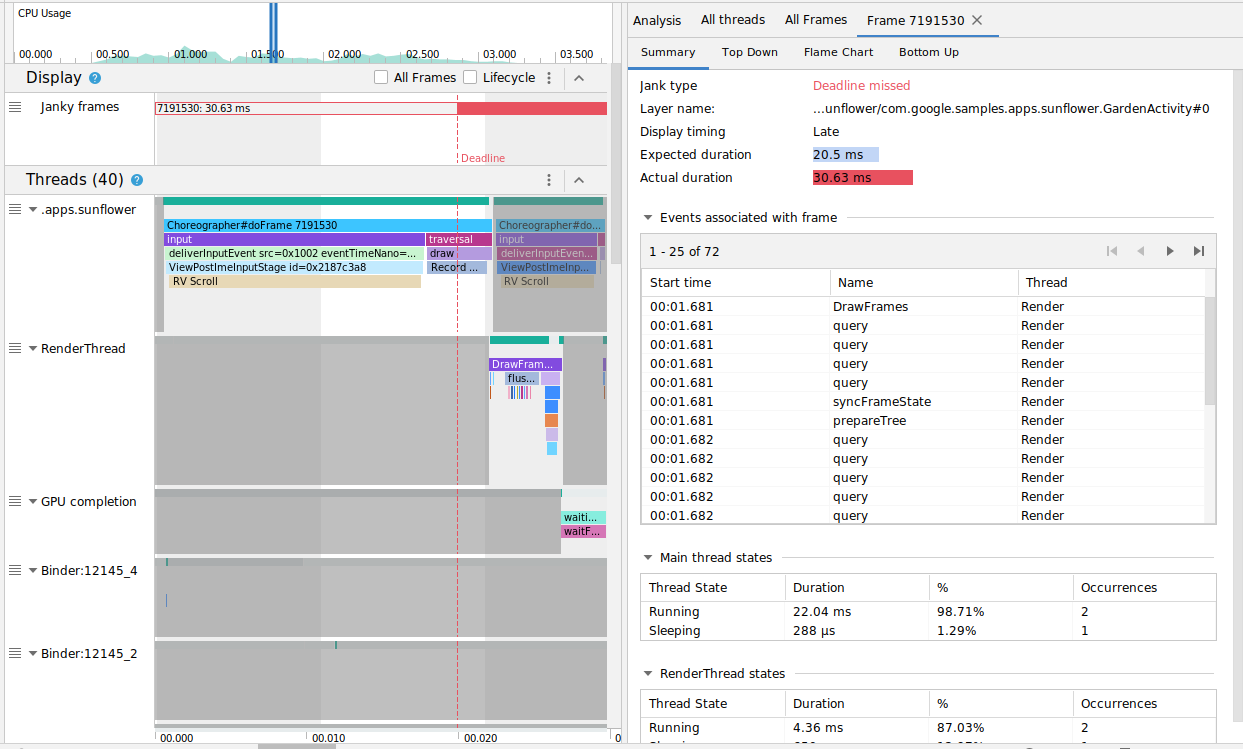
您应该会在 Display 下方看到 Janky frames 轨道。默认情况下,性能分析器只会将卡顿帧显示为有待调查的候选对象。在每个卡顿帧中,红色部分突出显示了相应帧超出其渲染截止时间的时长。
发现卡顿帧后,点击该帧;可根据需要按 M 键调整缩放程度以聚焦到所选帧。相关事件会在以下线程中突出显示:主线程、RenderThread 和 GPU completion。
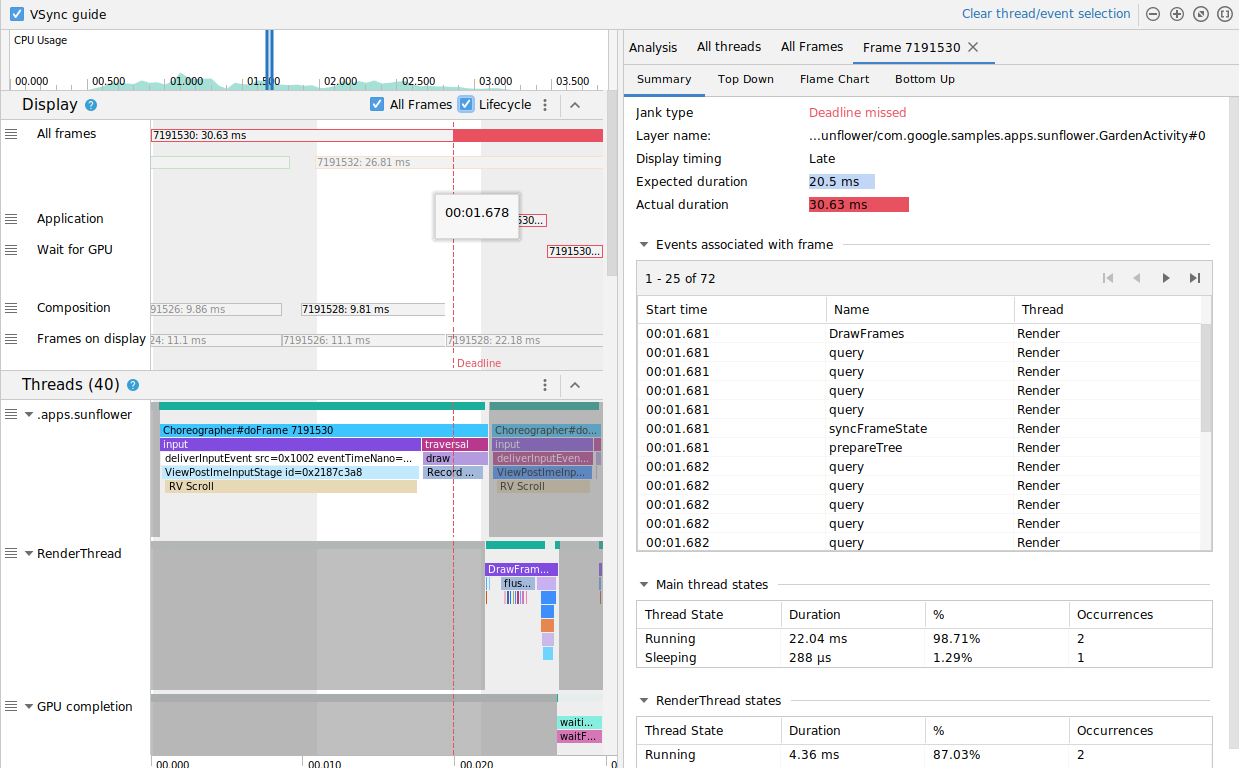
通过选中或取消选中 All Frames 和 Lifecycle 复选框,您可以根据需要查看所有帧或呈现时间的细分数据。
在 Android 11 上检测卡顿情况
对于搭载 Android 11(API 级别 30)的设备,CPU 性能分析器的 Frame Lifecycle 部分会显示捕获的轨迹。
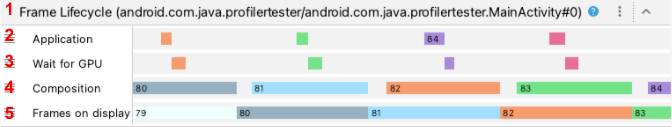
Frame Lifecycle 部分包含层名称和四个轨迹。每个轨迹分别代表帧呈现流水线中的一个阶段。Frame Lifecycle 元素如下:
- Frame Lifecycle (层名称):该部分的标题包含用括号括起来的层名称。层是单个组合单元。
- Application:此轨迹显示从缓冲区被应用移出队列到重新回到队列的时间。这通常对应于
RenderThread中的轨迹事件。 - Wait for GPU:此轨迹显示 GPU 拥有相应缓冲区的时长。该时长指的是,从相应缓冲区的内容被发送至 GPU,到 GPU 利用相应缓冲区的内容完成其工作,期间所经历的时间。这并不表示 GPU 在此期间仅使用相应缓冲区的内容工作。如需详细了解给定时间内 GPU 执行的工作,您可能需要使用 Android GPU 检查器。
- Composition:此轨迹显示,从 SurfaceFlinger 占有相应缓冲区并发送相应缓冲区的内容以进行合成,到相应缓冲区的内容被发送到显示屏,期间所经历的时间。
- Frames on display:此轨迹显示相应帧在屏幕上的时长。
Frame Lifecycle 部分说明了帧缓冲区在呈现流水线的不同阶段之间的切换方式。帧按帧号进行颜色编码,以便更轻松地跟踪特定帧。
Android Studio 还会在 All Frames 标签页中以表格格式显示轨迹中的所有帧。
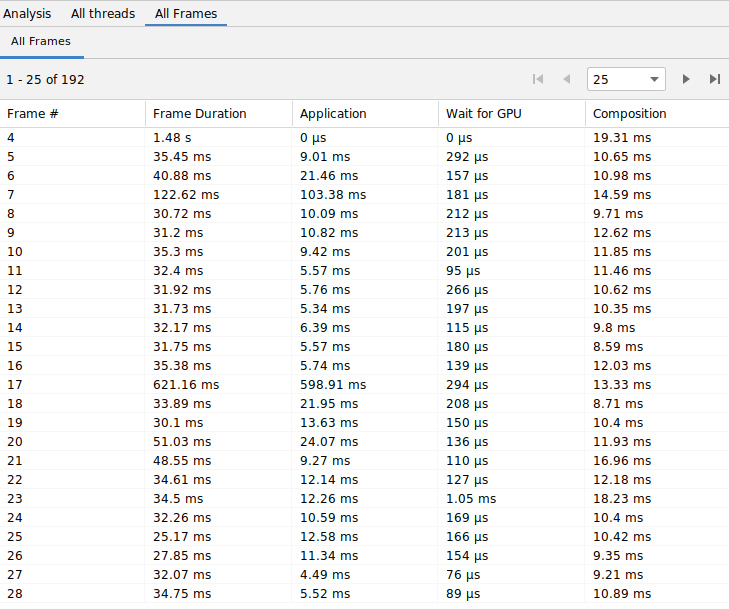
Frame #、Application、Wait for GPU 和 Composition 列表示的数据与上方 Frame Lifecycle 部分的轨迹表示的数据一样。Frame Duration 列表示从 Application 开始到 Frames on Display 开始所经历的时间。这本质上是端到端呈现帧的时长。
您可以按任意列对“Frames”表进行排序,以便快速找到最短或最长的帧。该表还支持分页控件,您可以借助这些控件浏览数以百计的帧。
如需在 Android 11 上检测和调查卡顿情况,请按以下步骤操作:
按 Application 列对 All Frames 表进行降序排序,使耗时最长的帧首先显示。
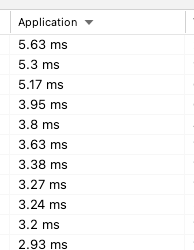
找到运行时间最长的帧,然后选择表中的一行。这会在左侧的时间轴视图中放大所选帧。
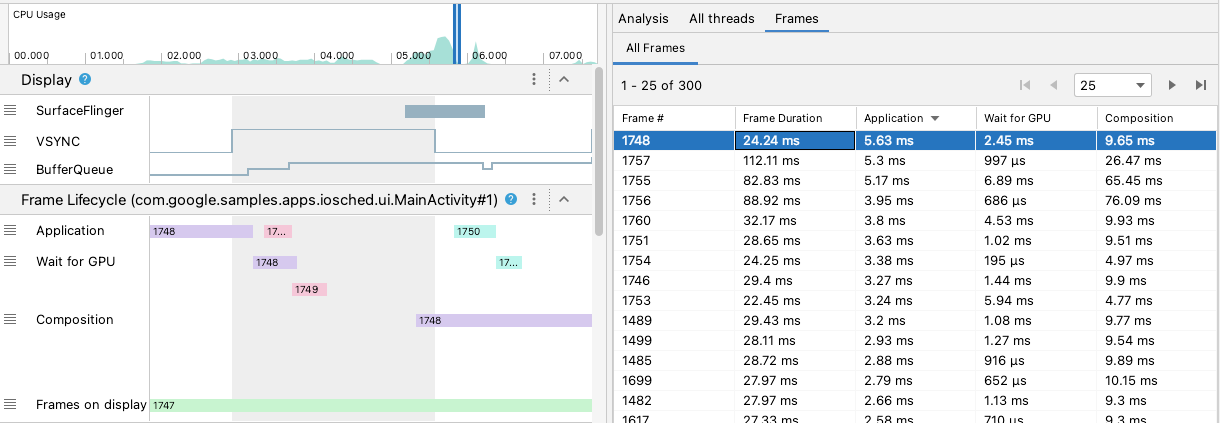
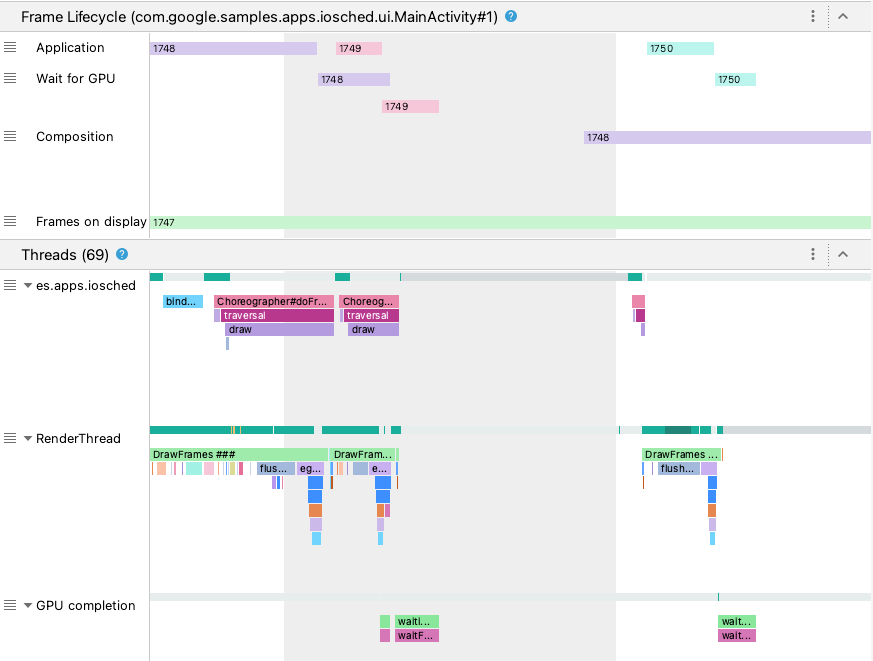
在 Frame Lifecycle 和 Threads 部分查找相关线程。
在 Android 10 及更低版本上检测卡顿情况
对于搭载 Android 10(API 级别 29)及更低版本的设备,相关的操作系统图形管道信息会显示在 CPU 性能分析器系统轨迹中的单个部分,称为 Display。
- Frames:此部分显示应用中的界面线程和
RenderThread轨迹事件。时长超过 16 毫秒的事件会以红色表示,以突出显示潜在的卡顿帧,因为它们超出了以 60 帧/秒 (fps) 的速度进行呈现的截止时间。 - SurfaceFlinger:此部分显示 SurfaceFlinger 处理帧缓冲区的时间。SurfaceFlinger 是负责将缓冲区内容发送到显示屏的系统进程。
- VSYNC:此部分显示 VSYNC,这是一个表示与显示流水线保持同步的信号。该轨迹会显示 VSYNC-app 信号,这个信号会在应用启动时间过晚时显示。通常情况下,发生这种情况是因为界面线程处于忙碌状态。在动画播放期间,它会导致屏幕上出现可见的闪烁,并且在动画或滚动完成之前,会持续带来额外的输入延迟。对于刷新率较高的显示屏,尤其要注意查看该轨迹,因为与刷新率为 60 次/秒或刷新率可变的显示屏相比,这种显示屏更容易出现此类问题。
- BufferQueue:此部分显示有多少帧缓冲区在排队等待 SurfaceFlinger 使用。对于部署到搭载 Android 9(API 级别 28)或更高版本的设备的应用,此轨道会显示应用 Surface BufferQueue(
0、1或2)的缓冲区计数。BufferQueue 可以帮助您了解图像缓冲区在 Android 图形组件之间移动时的状态。例如,值2表示应用当前处于三重缓冲状态,这会导致额外的输入延迟。
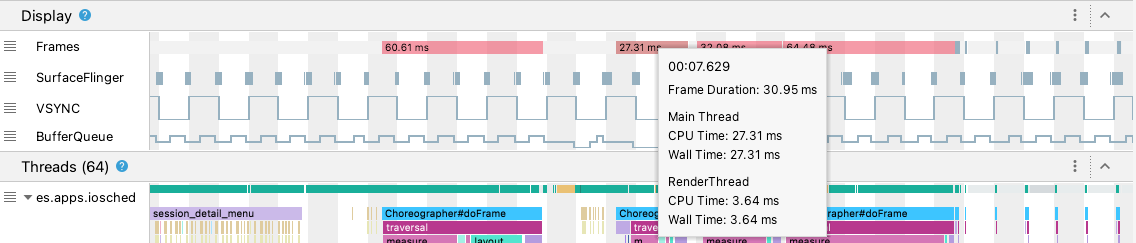
Display 部分会提供有助于检测潜在卡顿的实用信号,例如何时界面线程或 RenderThread 的用时超过 16 毫秒。若要调查导致卡顿的确切细节,您可以查看 Threads 部分,其中会显示与界面呈现有关的线程。
在上图中,Threads 部分显示了界面线程 (java.com.google.samples.apps.iosched)、RenderThread 和 GPU completion 线程。这些线程与界面呈现有关,可能是导致卡顿的原因。
如需在 Android 10 或更低版本上检测卡顿情况,请执行以下操作:
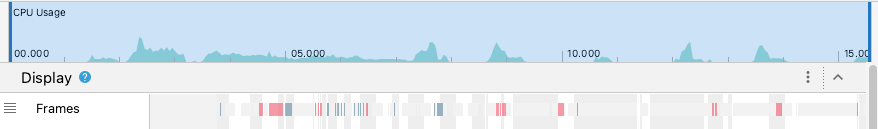
查看 Display 中的 Frames 轨迹。红色帧是要调查的候选对象。
发现可能存在卡顿的帧后,请按
W,或在按住 Control 键(在 macOS 设备上,则按住 Command 键)的同时滚动鼠标滚轮,以便进行放大。继续放大,直到您看到界面线程和RenderThread中的轨迹事件。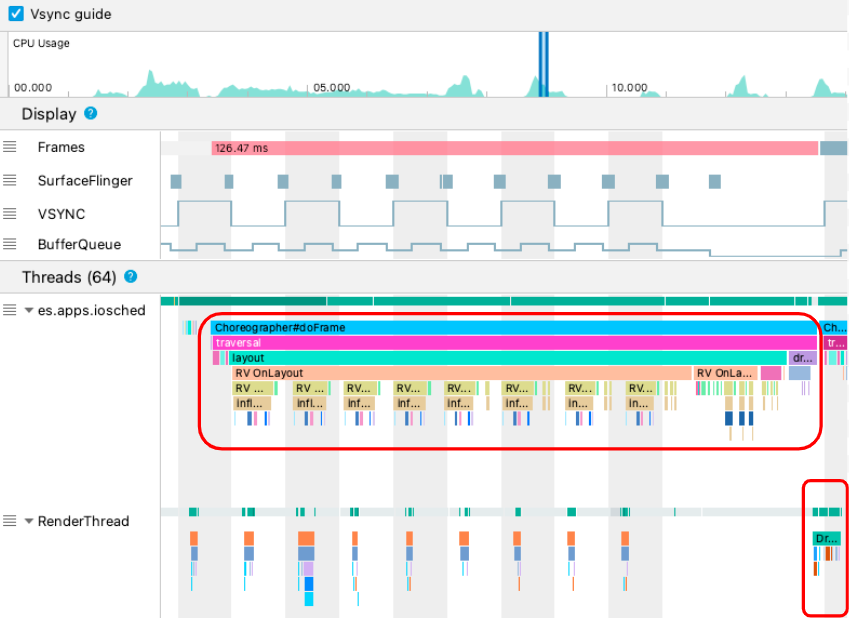
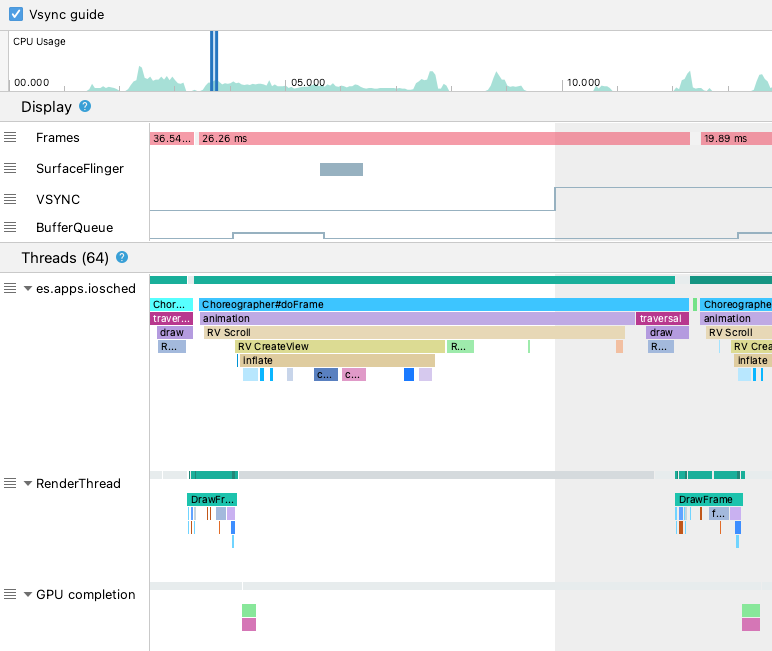
在上图中,
Choreographer#doFrame显示了界面线程何时调用Choreographer来协调动画、视图布局、图像绘制和相关进程。DrawFrames显示了RenderThread何时形成并向 GPU 发出实际绘制命令。如果您发现某个轨迹事件特别长,可以进一步放大,以便找出可能导致呈现速度缓慢的原因。上图显示了界面线程中的
inflate,这意味着应用正在花时间膨胀布局。当您放大其中一个inflate事件时,可以确切了解每个界面组件花费的时间,如下所示。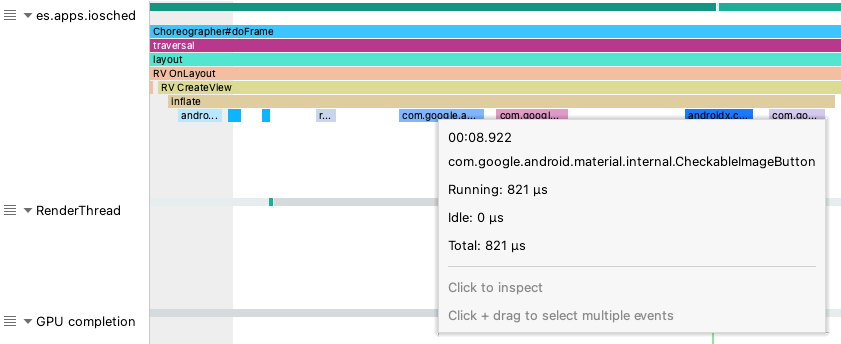
了解详情
如需详细了解如何减少卡顿,请参阅常见的卡顿来源。