
记录应用代码执行期间调用的 Java/Kotlin 方法,可让您查看给定时间的调用堆栈和 CPU 使用率,并过滤到 Java/Kotlin 方法。此数据有助于识别执行时间较长或占用大量系统资源的代码部分。如果您需要查看包含原生调用帧的完整 调用堆栈,请使用 调用堆栈采样 分析任务。
在记录 Java 或 Kotlin 方法时,Android Studio Profiler 使用运行时插桩来注入
在记录 Java 或 Kotlin 方法时,Android Studio Profiler 会使用运行时插桩在每次方法调用的入口点和退出点注入时间戳。然后,分析器会聚合并分析这些时间戳,以生成精确的方法跟踪数据和执行时间。当您需要确切了解特定方法调用时,请使用跟踪。由于运行时插桩会带来显著的开销,因此我们建议您将记录会话限制在不超过 5 秒的时间内。
Java/Kotlin 方法概览
运行 Find CPU Hotspots 任务 后,Android Studio Profiler 会提供以下信息:
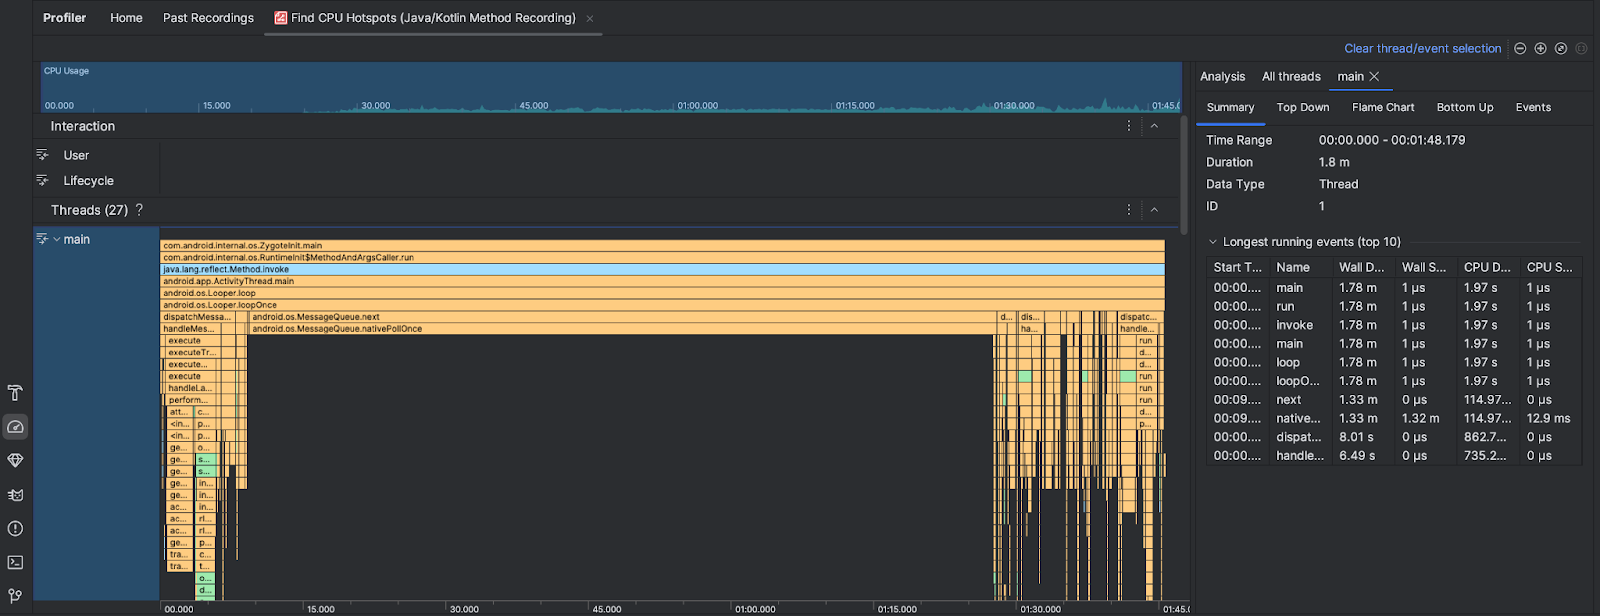
- CPU Usage:按时间显示应用的 CPU 使用率,以占总可用 CPU 容量的百分比表示。请注意,CPU 使用率不仅包括 Java/Kotlin 方法,还包括原生代码。突出显示时间轴的某个部分,以过滤到该时间段的详细信息。
- Interactions:沿着 时间轴显示用户互动和应用生命周期事件。
- Threads:显示应用运行所用的线程。在大多数情况下,您需要先关注代表应用的最顶层线程。
如需识别耗时最多的方法或调用堆栈,请使用 火焰图或 自上而下图表。