录制系统跟踪记录
使用集合让一切井井有条
根据您的偏好保存内容并对其进行分类。
系统轨迹会显示整个系统的活动和资源使用情况,因此您可以了解应用进程的调度和运行方式。Android Studio 性能剖析器中的系统轨迹视图通常用于调查以下问题:
- 应用和系统进程在设备核心和线程中的分布情况。
- 界面渲染的流畅程度。
- 设备和应用级别的耗电量。
本页简要介绍了系统轨迹视图中最常用的可视化图表。如需详细了解此处未介绍的可视化图表,请参阅图表词汇表。如需查看有关系统轨迹用途的更详细示例,请参阅本部分中的其他页面。
录制系统轨迹后,您会在时间轴上看到以下可视化图表。您应重点关注不同系统资源之间的相关性;例如,如果您发现调制解调器电源轨出现峰值,则应前往线程部分,查看当时哪些线程活动可能导致了该峰值。

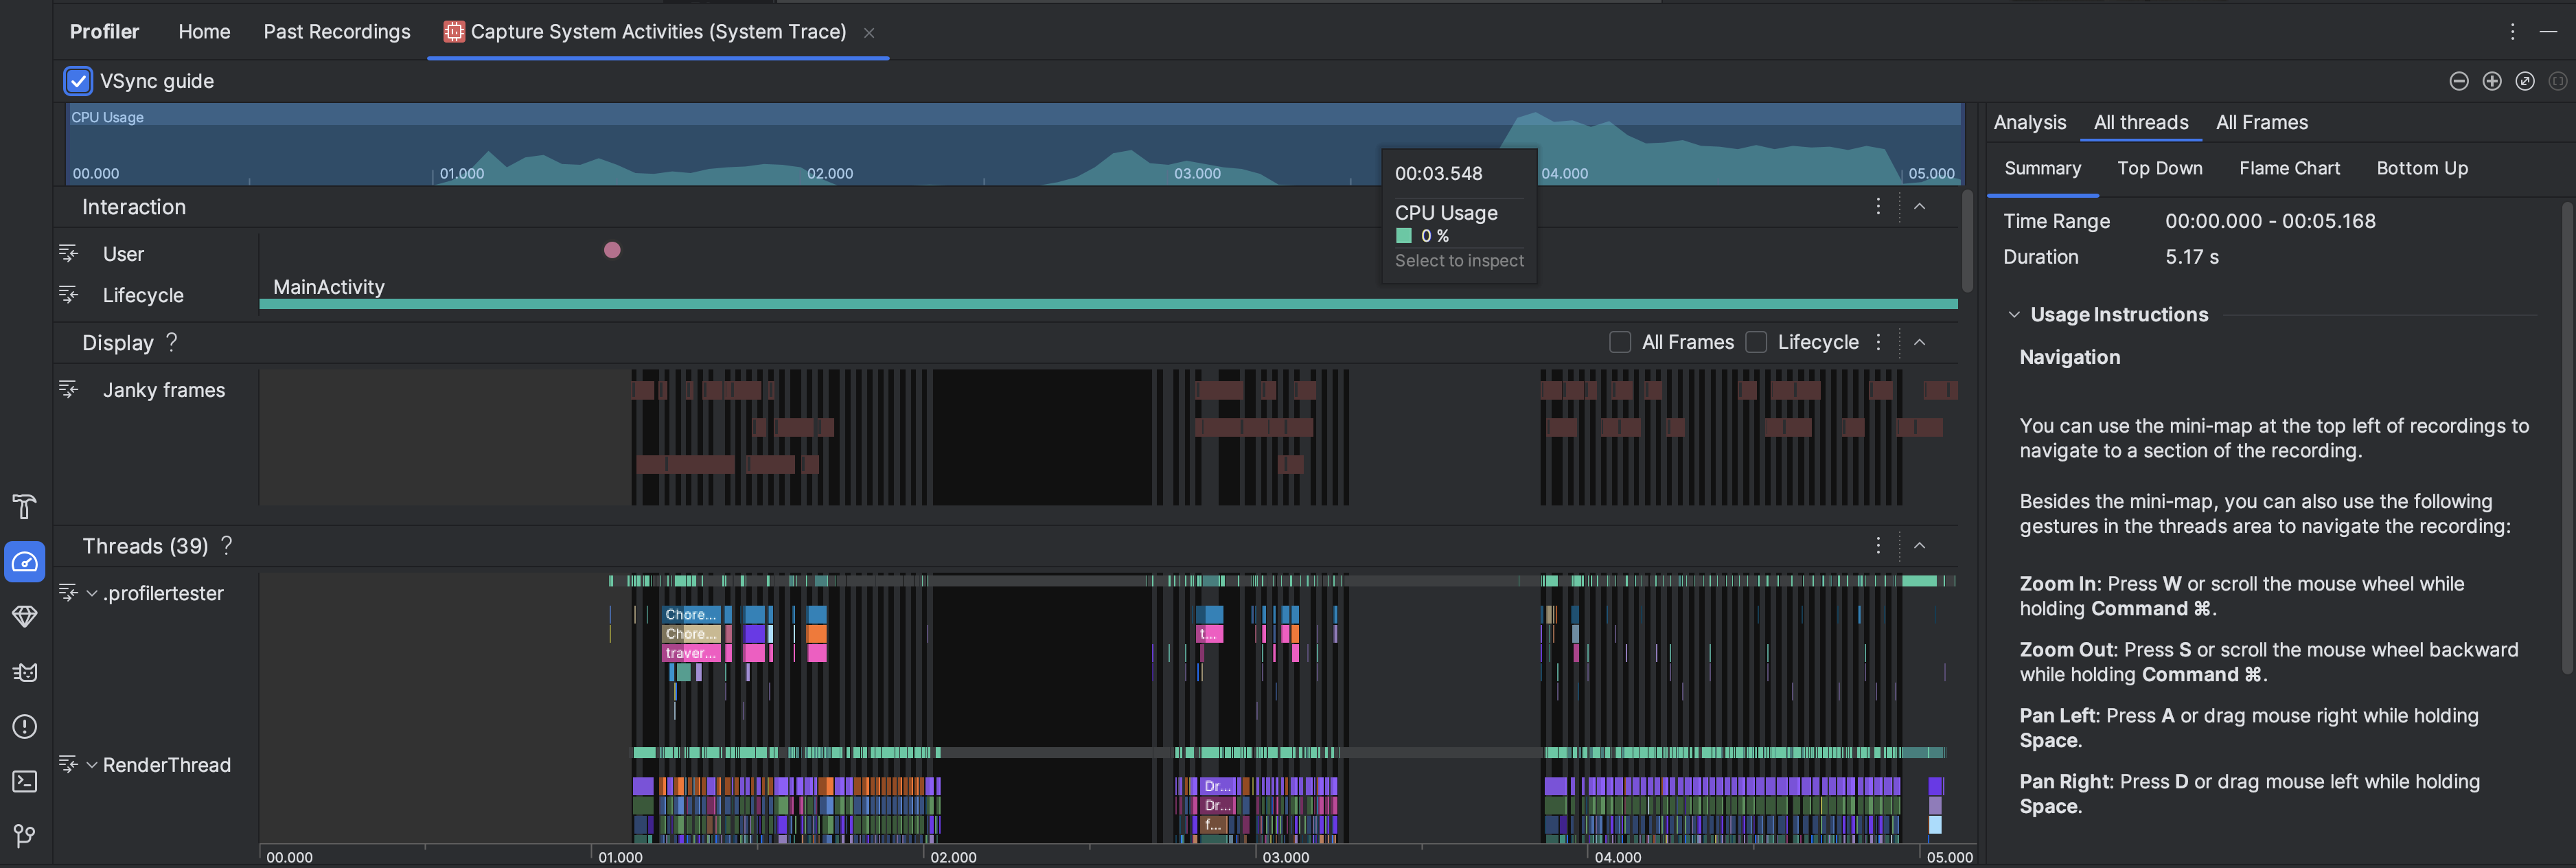
- CPU 使用率:显示应用的 CPU 使用率(以占总可用 CPU 容量的百分比表示,按时间划分)。突出显示时间轴的某个部分,以过滤出相应时间段的详细信息。
- 互动:沿着时间轴显示用户互动和应用生命周期事件(需要可调试的应用进程和搭载 API 级别 26 或更高版本的设备)。
- 显示:显示与应用界面渲染流畅度相关的信息。选择生命周期,以检查应用在主线程和
RenderThread
上渲染每个帧所用的时间。此信息有助于调查导致界面卡顿和帧速率偏低的瓶颈。
线程:显示应用和各种系统进程运行的线程。如需了解如何使用系统轨迹来调查并帮助减少界面卡顿,请参阅检测界面卡顿。
提示:检查
Threads 时间轴时,您可以使用以下快捷方式:
- 放大:按 W 或在按住 Ctrl 键(在 macOS 上,按住 Command 键)的同时滚动鼠标滚轮。
- 缩小:按 S 或在按住 Ctrl 键(在 macOS 上,按住 Command 键)的同时向后滚动鼠标滚轮。
- 向左平移:按 A 键或在按住空格键的同时向右拖动鼠标。
- 向右平移:按 D 键或在按住空格键的同时向左拖动鼠标。
- 展开或收起线程:双击线程名称,或在选中线程时按 Enter 键。
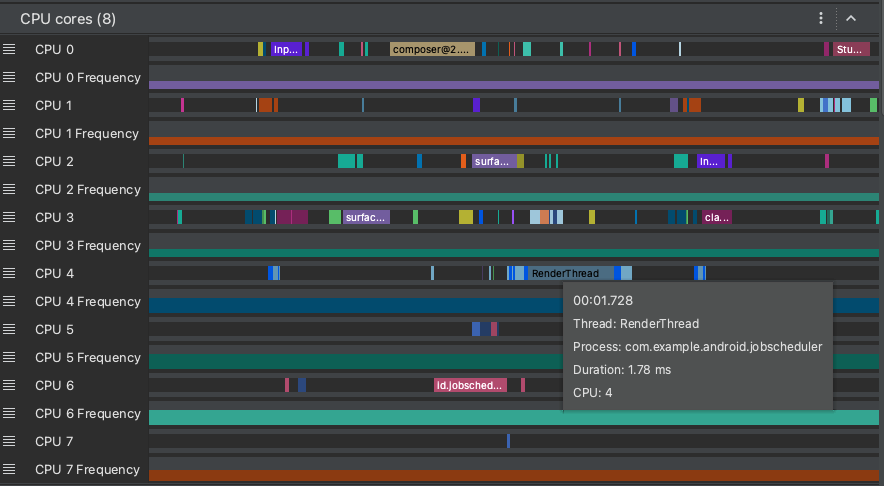
CPU Cores:显示设备中每个核心上的活动。查看每个核心的活动情况,有助于您了解哪些是现代移动处理器中的“大”核心或“小”核心。将指针悬停在某个线程活动上,可查看该核心在此特定时间在哪个线程上运行。

Process Memory (RSS):显示应用当前使用的物理内存量。如需了解详情,请参阅图表术语表。
电源轨道:在实体设备上进行分析时显示。如需了解详情,请参阅检查耗电情况。
电池:显示应用的电池用量。
本页面上的内容和代码示例受内容许可部分所述许可的限制。Java 和 OpenJDK 是 Oracle 和/或其关联公司的注册商标。
最后更新时间 (UTC):2025-07-27。
[null,null,["最后更新时间 (UTC):2025-07-27。"],[],[],null,["# Record a system trace\n\nA system trace shows you system-wide activities and resource usage, so you can\nsee how your app processes are scheduled and run. The system trace view in the\nAndroid Studio Profiler is commonly used to investigate the following:\n\n- How app and system processes are distributed across device cores and threads.\n- How smoothly the UI renders.\n- Power usage at both the device and app level.\n\nThis page provides an overview of the most commonly used visuals in the system\ntrace view. See the [chart glossary](/studio/profile/chart-glossary/flame-chart)\nfor more details about visualizations not described here. For more detailed\nexamples of what to use a system trace for, see the other pages in this section.\n\nAfter you [record a system trace](/studio/profile#start-profiling), you see the\nfollowing visualizations displayed over a timeline. You should focus on how\ndifferent system resources are correlated; for example, if you notice a spike in\nthe modem power rail, you should go to the threads section and see what thread\nactivity could be causing the spike at the time.\n\n- **CPU Usage**: Shows CPU usage of your app as a percentage of total available CPU capacity by time. Highlight a section of the timeline to filter to the details for that time period.\n- **Interactions** : Shows user interaction and app lifecycle events along a timeline (requires a [debuggable](/studio/profile#profileable-v-debuggable) app process and a device running API level 26 or higher).\n- **Display** : Shows info related to how smooth your app UI renders. Select **Lifecycle** to inspect how long it takes your app to render each frame on the main thread and `RenderThread`. This info is helpful for [investigating\n bottlenecks that cause UI jank and low\n framerates](/studio/profile/jank-detection).\n- **Threads** : Shows the threads that your app and various system processes run\n on. To learn about how to use system traces to investigate and help reduce UI\n jank, see [Detect UI jank](/studio/profile/jank-detection).\n\n **Tip:** When inspecting the **Threads** timeline, the following shortcuts are available:\n - **Zoom in:** Press \u003ckbd\u003eW\u003c/kbd\u003e or scroll the mouse wheel while holding \u003ckbd\u003eCtrl\u003c/kbd\u003e (\u003ckbd\u003eCommand\u003c/kbd\u003e on macOS).\n - **Zoom out:** Press \u003ckbd\u003eS\u003c/kbd\u003e or scroll the mouse wheel backward while holding \u003ckbd\u003eCtrl\u003c/kbd\u003e (\u003ckbd\u003eCommand\u003c/kbd\u003e on macOS).\n - **Pan left:** Press \u003ckbd\u003eA\u003c/kbd\u003e or drag mouse right while holding \u003ckbd\u003eSpace\u003c/kbd\u003e.\n - **Pan right:** Press \u003ckbd\u003eD\u003c/kbd\u003e or drag mouse left while holding \u003ckbd\u003eSpace\u003c/kbd\u003e.\n - **Expand or collapse a thread:** Double-click the thread name or press \u003ckbd\u003eEnter\u003c/kbd\u003e while a thread is selected.\n- **CPU cores** : Shows the activity on each core in your device. Viewing the\n activity by core might give you an idea of which ones are the [\"big\" or\n \"little\" cores](https://en.wikipedia.org/wiki/ARM_big.LITTLE) in\n modern mobile processors. Hold the pointer over a thread activity to\n see which thread this core is running on at that particular time.\n\n- **Process Memory (RSS)**: Shows the amount of physical memory currently in use\n by the app. For more details, see the chart glossary.\n\n- **Power Rails** : Appears when you profile on a physical device. For more info,\n see [Inspect power usage](/studio/profile/power-profiler).\n\n- **Battery**: Shows your app's battery usage."]]