تنظيم صفحاتك في مجموعات
يمكنك حفظ المحتوى وتصنيفه حسب إعداداتك المفضّلة.
يكون أداء التطبيق ضعيفًا إذا كان يستغرق وقتًا طويلاً في الاستجابة أو كان يعرض صورًا متحركة متقطعة أو
يتعطّل أو يستهلك طاقة كبيرة جدًا. يتطلّب حلّ مشاكل الأداء
تحليل أداء تطبيقك، أو تحديد الجوانب التي يستخدم فيها تطبيقك موارد
بطريقة غير فعّالة، مثل وحدة المعالجة المركزية (CPU) أو الذاكرة أو الرسومات أو
بطارية الجهاز. يصف هذا الموضوع أدوات Android Studio والأساليب التي يجب استخدامها لمعالجة
المشاكل الشائعة في الأداء.
للتعرّف على كيفية تشغيل أدوات تحليل الأداء المستقلة بدون تشغيل IDE كاملاً في Android IDE (Windows أو Linux فقط)، يُرجى الاطّلاع على مقالة تشغيل أداة تحليل الأداء المستقلة.
المتطلبات
لإنشاء ملف شخصي لتطبيقك، ننصحك بما يلي:
تطبيق يتضمّن إصدارًا من إصدار الإصدار تم تفعيل إعداد profileable ملف البيان
، ويُعرف أيضًا باسم تطبيق قابل لإنشاء الملفات الشخصية. يتم تلقائيًا ضبط التطبيقات على
هذا الإعداد على "صحيح". للتحقّق من هذه الإعدادات أو تغييرها، افتح بيان تطبيقك أو ملف AndroidManifest.xml وابحث في قسم
<application> عن إعدادات بيان
profileable:
<profileable android:shell="true" />
جهاز اختبار افتراضي أو فعلي يعمل بالمستوى 29 من واجهة برمجة التطبيقات أو إصدار أحدث ومزوّد
بتطبيق Google Play
المكوّن الإضافي لنظام Gradle المتوافق مع Android 7.3 أو إصدار أحدث
التطبيقات التي يمكن إنشاء ملف شخصي لها في مقابل التطبيقات التي يمكن تصحيحها
يتيح لك التطبيق الذي يمكن تحليله إجراء معظم مهام التحليل الشائعة، ولكن عليك استخدام تطبيق
قابل لتصحيح الأخطاء بدلاً من ذلك إذا كنت بحاجة إلى تسجيل عمليات تخصيص Java/Kotlin
أو تسجيل ملف "تجميع الذاكرة". تتيح لك أيضًا عملية التطبيق القابلة لتصحيح الأخطاء والجهاز الذي يعمل
بالمستوى 26 من واجهة برمجة التطبيقات أو أعلى الاطّلاع على مخطط التفاعل الزمني الذي
يعرض تفاعل المستخدمين وأحداث دورة حياة التطبيق في طرق عرض المهام التي توفّر ذلك.
يستند التطبيق القابل لتصحيح الأخطاء إلى إصدار debug من تطبيقك ويتيح لك استخدام أدوات التطوير، مثل أداة تصحيح الأخطاء، ولكنّه يتسبب في بعض تكاليف الأداء. يستند التطبيق الذي يمكن تحليله إلى إصدار release
البديل من تطبيقك، ويتيح مجموعة فرعية من مهام التحليل الشائعة بدون
زيادة الأداء في إصدار تصحيح الأخطاء.
إنشاء تطبيق قابل للملف الشخصي وتشغيله
لإنشاء تطبيق قابل لإنشاء ملف شخصي وتشغيله في Android Studio، اتّبِع الخطوات التالية:
اختَر نوع إصدار الإصدار (الإصدار > اختيار نوع الإصدار).
انقر على المزيد من الإجراءات
> الملف الشخصي "app" بتكلفة منخفضة
أو ملف الأداء "app" الكامل
("app" هو اسم إعداد التشغيل، لذا قد يختلف عن
ملفك الشخصي). للاختيار بين الخيارَين، يُرجى الاطّلاع على المتطلبات.
يتم فتح التطبيق على جهاز الاختبار ويتم فتح لوحة أداة تحليل الأداء في Android
Studio.
اختَر عملية من القائمة في علامة التبويب الصفحة الرئيسية ضمن لوحة أداة تحليل الأداء. في معظم الحالات، ستحتاج إلى اختيار أهم عملية تمثّل
تطبيقك.
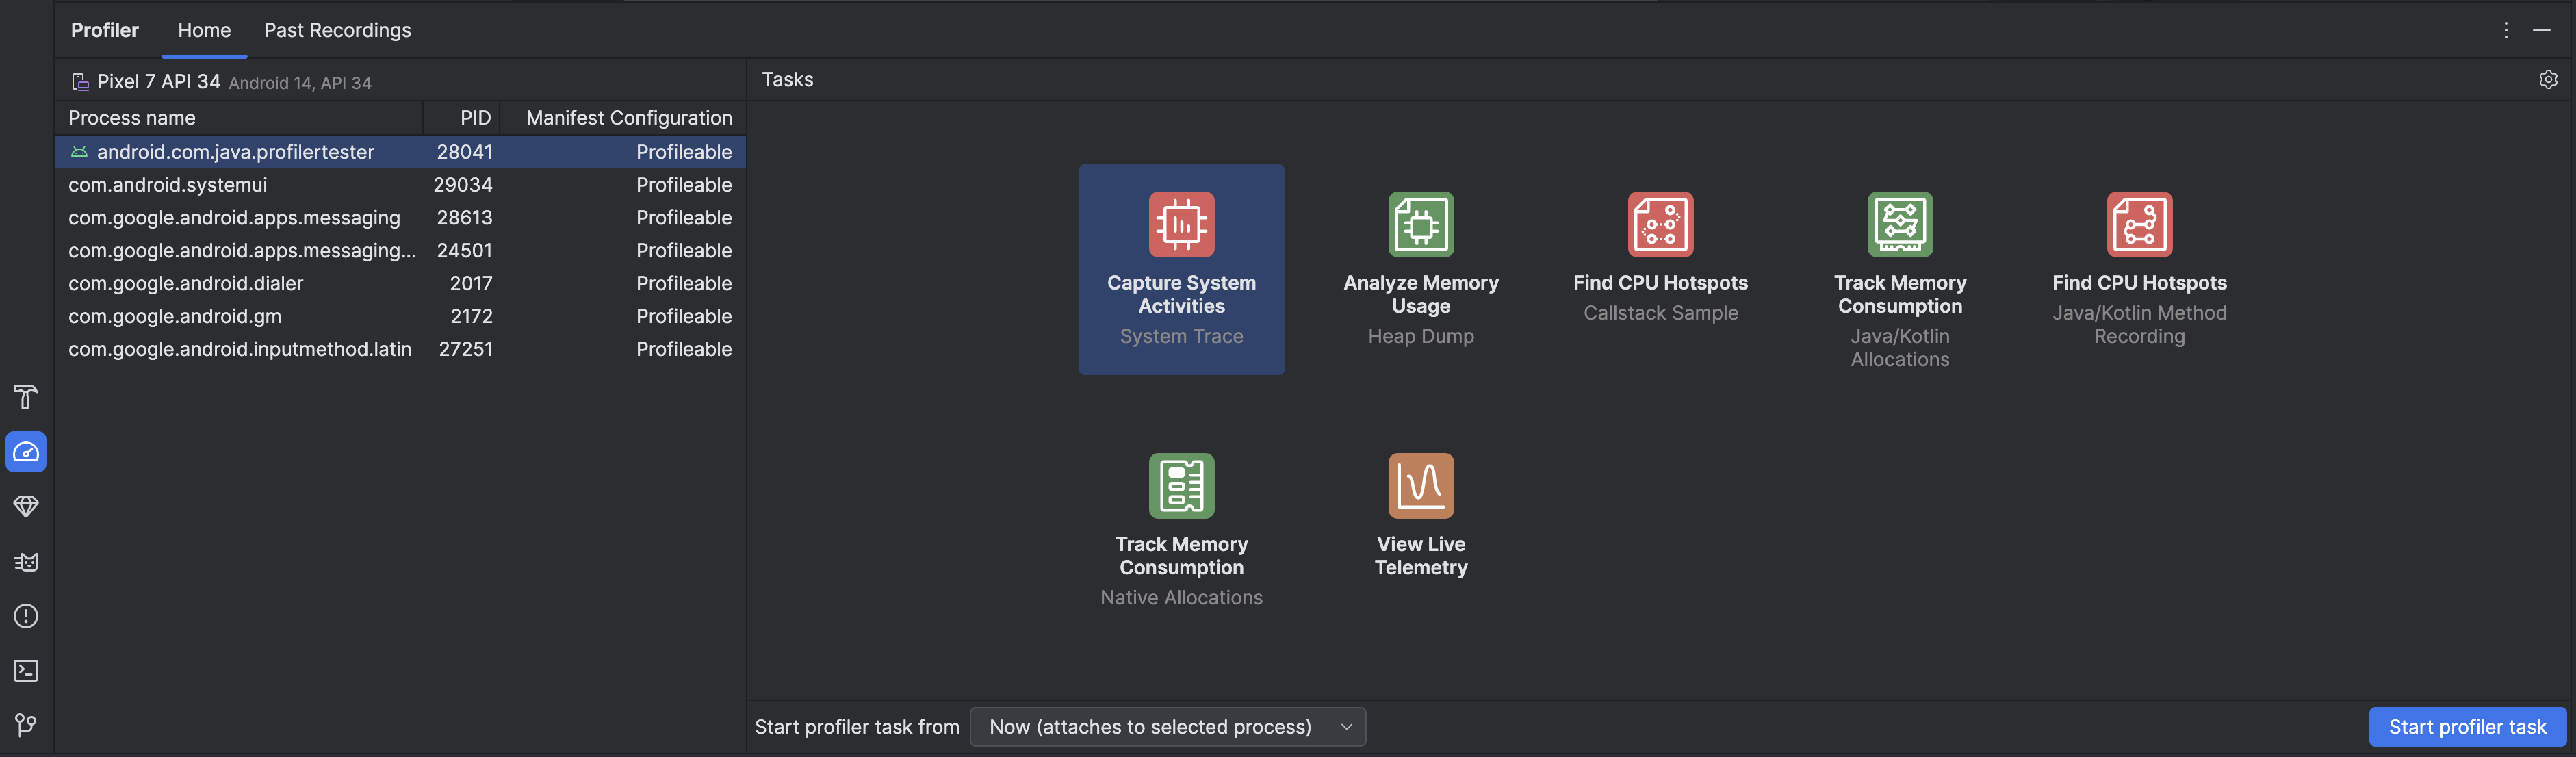
اختَر مهمة إنشاء ملف شخصي من قسم المهام. لمزيد من المعلومات حول المهام، يُرجى الاطّلاع على الصفحات الأخرى في هذا القسم. لا تتوفّر بعض مهام وضع الملف الشخصي
لكل عملية. إذا لم تكن متأكدًا من كيفية البدء، يمكنك الحصول على نظرة عامة على نشاط الأداء من خلال فحص تطبيقك مباشرةً.
استخدِم القائمة المنسدلة بدء مهمة أداة تحليل الأداء من لاختيار ما إذا كنت تريد بدء مهمة
أداة تحليل الأداء من بدء التشغيل أو إرفاقها بالعملية أثناء تشغيلها. إذا كنت تحاول
تحسين وقت بدء تشغيل تطبيقك أو تسجيل عملية تتم
أثناء بدء تشغيل التطبيق، عليك تضمين بدء التشغيل، وإلا يمكنك بدء
الملف الشخصي في الحالة الحالية لتطبيقك.
انقر على بدء مهمة أداة تحليل الأداء. تبدأ المهمة في علامة تبويب خاصة بها.
تفاعل مع تطبيقك لبدء الأنشطة.
أوقِف التسجيل (إن أمكن)، وانتظِر تحليله، واطّلِع على
النتائج.
مقارنة عمليات التتبّع وتصديرها واستيرادها
عند إيقاف مهمة تحليل، يتم حفظها تلقائيًا في علامة التبويب التسجيلات
السابقة ضمن لوحة أداة تحليل الأداء. يمكنك استخدام هذه التسجيلات المحفوظة
لمقارنة استخدام الموارد في سيناريوهات مختلفة. يتم تسجيل المقاطع
لمدة جلسة "استوديو Android" الحالية. إذا أردت
الاحتفاظ بها لفترة أطول، يمكنك تصديرها من خلال النقر على تصدير التسجيل.
لا يمكن تصدير بعض أنواع عمليات التتبّع.
لاستيراد عملية تتبُّع، مثلاً من عملية تشغيل سابقة من Android Studio، انقر على
استيراد تسجيل
في علامة التبويب التسجيلات السابقة واختَر ملف التتبُّع. يمكنك أيضًا استيراد ملف
عن طريق سحبه إلى نافذة محرِّر Android Studio.
تعديل إعدادات التسجيل
لتعديل إعدادات تسجيل مهمة أداة تحليل الأداء، انقر على إعدادات أداة تحليل الأداء
.
هناك إعدادان رئيسيان يمكنك تفعيلهما أو إيقافهما:
بالنسبة إلى المهام التي تتضمّن أخذ عينات، يمثّل فاصل أخذ العينات المدة الزمنية بين كلّ عينة. كلما قلّ الفاصل الزمني الذي تحدّده، زادت سرعة
بلوغ الحد الأقصى لحجم الملف للبيانات المسجّلة.
يمثّل الحد الأقصى لحجم الملف مقدار البيانات التي يمكن كتابتها على
الجهاز المتصل. عند إيقاف التسجيل، يحلّل Android Studio هذه البيانات ويعرضها في نافذة أداة تحليل الأداء. في حال زيادة الحدّ المسموح به وتسجيل
كمية كبيرة من البيانات، يستغرق "استوديو Android" وقتًا أطول بكثير لتحليل الملف وقد
يتوقف عن الاستجابة.
يخضع كل من المحتوى وعيّنات التعليمات البرمجية في هذه الصفحة للتراخيص الموضحّة في ترخيص استخدام المحتوى. إنّ Java وOpenJDK هما علامتان تجاريتان مسجَّلتان لشركة Oracle و/أو الشركات التابعة لها.
تاريخ التعديل الأخير: 2024-11-22 (حسب التوقيت العالمي المتفَّق عليه)
[null,null,["تاريخ التعديل الأخير: 2024-11-22 (حسب التوقيت العالمي المتفَّق عليه)"],[],[],null,["# Profile your app performance\n\nAn app has poor performance if it responds slowly, shows choppy animations,\nfreezes, or consumes too much power. Fixing performance problems involves\n*profiling* your app, or identifying areas in which your app makes inefficient\nuse of resources such as the CPU, memory, graphics, or the device\nbattery. This topic describes the Android Studio tools and techniques to use to\nfix common performance problems.\n\nTo learn how to run standalone profilers without running the entire Android\nStudio IDE (Windows or Linux only), see\n[Run the standalone profiler](/studio/profile/standalone-profiler).\n\nRequirements\n------------\n\nTo profile your app, we recommend having the following:\n\n- An app with a release build variant that has the `profileable` manifest\n configuration enabled, also known as a profileable app. By default, apps have\n this configuration set to true. To check or change this configuration open\n your app's manifest or `AndroidManifest.xml` file and look in the\n `\u003capplication\u003e` section for the\n [`profileable`](/guide/topics/manifest/profileable-element) manifest\n configuration:\n\n \u003cprofileable android:shell=\"true\" /\u003e\n\n | **Note:** Use a [debuggable](/studio/debug) app instead of a profileable app if you need to record Java/Kotlin allocations, capture a heap dump, or see the **Interaction** timeline in task views that provide it.\n- A virtual or physical test device that runs API level 29 or higher and has\n Google Play.\n\n- Android Gradle Plugin 7.3 or higher.\n\n### Profileable v. debuggable apps\n\nA profileable app lets you do most common profiling tasks, but you should use a\n[debuggable](/studio/debug) app instead if you need to record Java/Kotlin\nallocations or capture a heap dump. A debuggable app process and device running\nAPI level 26 or higher also lets you see the **Interaction** timeline, which\nshows user interaction and app lifecycle events, in task views that provide it.\n\nA debuggable app is based on the `debug` build variant of your app and lets you\nuse development tools such as the [debugger](/studio/debug); however, it comes\nwith some performance costs. A profileable app is based on the `release` build\nvariant of your app and enables a subset of common profiling tasks without the\nperformance overhead of the debug build.\n| **Note:** In Android Studio, click **Profile 'app' with low overhead** to use a profileable app and click **Profile 'app' with complete data** to use a debuggable app.\n\nBuild and run a profileable app\n-------------------------------\n\nTo build and run a profileable app in Android Studio, follow these steps:\n\n1. [Create a run/debug configuration](/studio/run/rundebugconfig) if you don't already have one.\n2. Select your release build variant (**Build \\\u003e Select Build Variant**).\n3. Click **More actions\n \\\u003e Profile 'app' with low overhead** or **Profile 'app' with complete data** (\"app\" is the name of the run configuration, so it might be different for you). To choose between the two options, see [Requirements](#requirements). The app opens on your test device and the **Profiler** pane opens in Android Studio.\n\nIf these instructions don't work for you, see [Build and run a profileable app\nmanually](/studio/profile/build-run-manually).\n\nStart profiling\n---------------\n\nTo start a profiling task, follow these steps:\n\n1. Select a process from the list in the **Home** tab within the **Profiler**\n pane. In most cases, you'll want to select the top process that represents\n your app.\n\n2. Select a profiling task from the **Tasks** section. For more info about the\n tasks, see the other pages in this section. Not all profiling tasks are\n available for every process. If you don't know where to start, get an overall\n view of performance activity by\n [inspecting your app live](/studio/profile/inspect-app-live).\n\n3. Use the **Start profiler task from** drop-down to select whether to start the\n profiler task from startup or attach to the process as it's running. If you're\n trying to improve your app startup time or capture a process that happens\n during app startup, you should include startup; otherwise, you can start\n profiling at your app's current state.\n\n4. Click **Start profiler task**. The task starts in its own tab.\n\n5. Interact with your app so activities are triggered.\n\n6. Stop the recording (if applicable), wait for it to parse, and see the\n results.\n\nCompare, export, and import traces\n----------------------------------\n\nWhen you stop a profiling task, it's automatically saved in the **Past\nRecordings** tab within the **Profiler** pane. You can use these saved\nrecordings to compare resource usage in different scenarios. The recordings are\nsaved for the duration of the current Android Studio session; if you want to\nkeep them for longer, export them by clicking **Export recording**\n.\nNot all trace types can be exported.\n\nTo import a trace, for example from a previous run of Android Studio, click\n**Import recording**\n\nin the **Past Recordings** tab and select your trace file. You can also import a\nfile by dragging it into the Android Studio editor window.\n\nEdit the recording configuration\n--------------------------------\n\nTo edit your profiler task recording configuration, click the profiler settings\n.\nThere are two main settings you can toggle:\n\n- For tasks that involve sampling, the **Sample interval** represents the time between each sample. The shorter the interval you specify, the faster you reach the file size limit for the recorded data.\n- The **File size limit** represents the amount of data that can be written to the connected device. When you stop recording, Android Studio parses this data and displays it in the profiler window. If you increase the limit and record a large amount of data, Android Studio takes much longer to parse the file and might become unresponsive.\n\n| **Note:** If you use a connected device running Android 8.0 (API level 26) or higher, there isn't a limit on the file size of the trace data, and the **File\n| size limit** value is ignored. However, you still need to be careful about how much data the device collects after each recording because large trace files are difficult to parse. For example, if you're recording either a sampled trace with a short sampling interval or an instrumented trace while your app calls many methods in a short time, you'll generate large trace files quickly."]]