

本页通过一个系统跟踪示例,详细介绍了如何使用 ProfilingManager 调试应用无响应 (ANR) 错误。
设置应用以收集 ANR
首先,在应用中设置 ANR 触发器:
Kotlin
fun addANRTrigger() { val profilingManager = applicationContext.getSystemService(ProfilingManager::class.java) ?: return val triggers = ArrayList<ProfilingTrigger>() val triggerBuilder = ProfilingTrigger.Builder(ProfilingTrigger.TRIGGER_TYPE_ANR) triggers.add(triggerBuilder.build()) val callbackExecutor: Executor = Executors.newSingleThreadExecutor() val resultCallback = Consumer<ProfilingResult> { profilingResult -> // Handle uploading trace to your back-end } profilingManager.registerForAllProfilingResults(callbackExecutor, resultCallback) profilingManager.addProfilingTriggers(triggers) }
Java
public void addANRTrigger() { ProfilingManager profilingManager = getApplicationContext().getSystemService( ProfilingManager.class); List<ProfilingTrigger> triggers = new ArrayList<>(); ProfilingTrigger.Builder triggerBuilder = new ProfilingTrigger.Builder( ProfilingTrigger.TRIGGER_TYPE_ANR); triggers.add(triggerBuilder.build()); Executor callbackExecutor = Executors.newSingleThreadExecutor(); Consumer<ProfilingResult> resultCallback = profilingResult -> { // Handle uploading trace to your back-end }; profilingManager.registerForAllProfilingResults(callbackExecutor, resultCallback); profilingManager.addProfilingTriggers(triggers); }
捕获并上传 ANR 跟踪记录后,您可以按照以下步骤在 Perfetto 界面中手动检查该跟踪记录,也可以使用 AI 智能体自动调查 ANR 问题。
分析跟踪记录
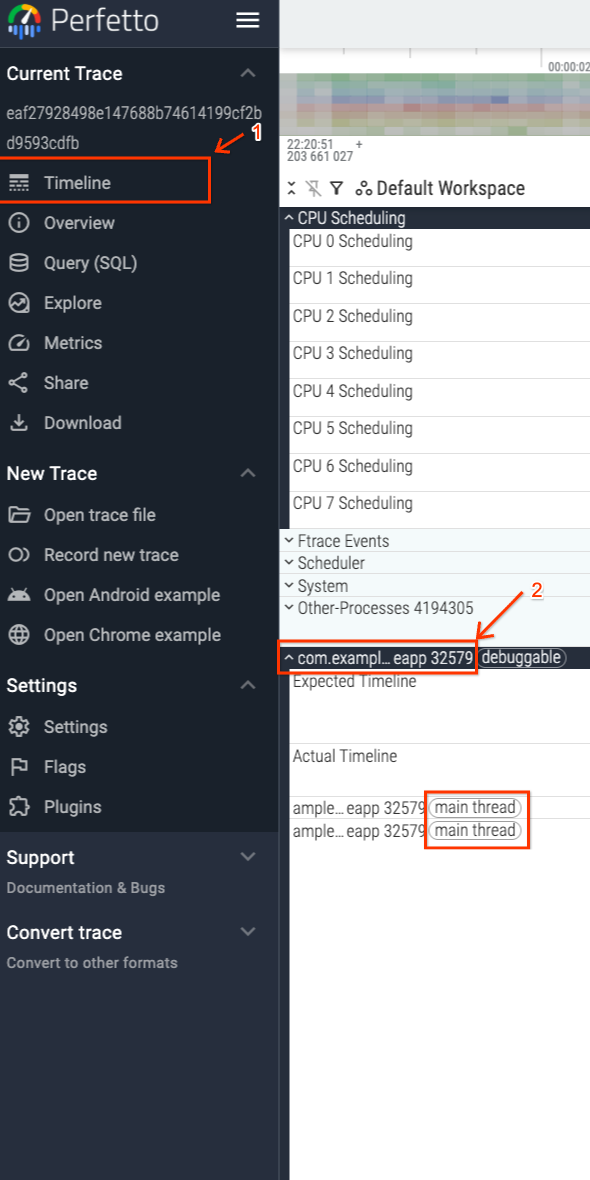
由于 ANR 触发了跟踪,因此您知道当系统检测到应用的主线程无响应时(或发生其他超时时),跟踪便会结束。图 1 显示了如何导航到应用的主线程,该线程在界面中进行了相应标记。
跟踪记录的结束时间与 ANR 的时间戳一致,如图 2 所示。

发生 ANR 时,主线程正在执行 MyApp:SubmitButton 内的 handleNetworkResponse 切片,该切片消耗了 1.48 秒的 CPU 时间(图 3)。

如果仅依赖于在 ANR 发生时获取的堆栈转储,可能会将冻结完全归因于 handleNetworkResponse。不过,1.48 秒本身并不足以触发 ANR,因此您需要检查之前是什么阻塞了主线程。
首先,找到在冻结之前渲染的最后一个界面帧 (Choreographer#doFrame 551275),该帧紧邻 MyApp:SubmitButton 切片(图 4)。

如需了解阻塞情况,请缩小视图以检查完整的 MyApp:SubmitButton 切片。您会注意到图 5 中手动选择的范围的线程状态中有一个关键细节:线程大约有 75% 的时间(6.7 秒)处于 Sleeping 状态,只有 24% 的时间处于 Running 状态。

MyApp:SubmitButton 操作期间的线程状态。这表明 ANR 的主要原因是等待,而不是计算。 检查个别睡眠情况,找出规律。

MyApp:SubmitButton内的首次睡眠时间。
MyApp:SubmitButton内的第二次睡眠时间。
MyApp:SubmitButton内的第三个睡眠时间。
MyApp:SubmitButton内的第四个睡眠时间。前三个休眠间隔(图 6-8)大约各为 2 秒,第四个间隔(图 9)为 0.7 秒。重复的 2 秒暂停强烈表明存在编程超时,该超时在第四次尝试成功之前重试了三次,累积了足够的延迟来触发 ANR(图 10)。
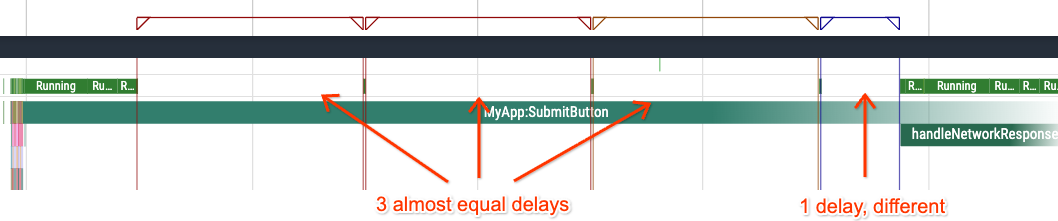
MyApp:SubmitButton切片期间的延迟摘要。找出代码中的根本原因
为了验证这一假设,请检查与 MyApp:SubmitButton 跟踪记录部分关联的代码:
Kotlin
fun setupButtonCallback() { findViewById<View>(R.id.submit).setOnClickListener { trace("MyApp:SubmitButton") { onClickSubmit() } } } fun onClickSubmit() { prepareNetworkRequest() var networkRequestSuccess = false var maxAttempts = 10 while (!networkRequestSuccess && maxAttempts > 0) { networkRequestSuccess = performNetworkRequest(NETWORK_TIMEOUT_MILLISECS) maxAttempts-- } if (networkRequestSuccess) { handleNetworkResponse() } } fun performNetworkRequest(timeoutMilliseconds: Int): Boolean { // ... } fun prepareNetworkRequest() { // ... } fun handleNetworkResponse() { trace("handleNetworkResponse") { // ... } } companion object { private const val NETWORK_TIMEOUT_MILLISECS = 2000 }
Java
private static final int NETWORK_TIMEOUT_MILLISECS = 2000; public void setupButtonCallback() { findViewById(R.id.submit).setOnClickListener(submitButtonView -> { Trace.beginSection("MyApp:SubmitButton"); onClickSubmit(); Trace.endSection(); }); } public void onClickSubmit() { prepareNetworkRequest(); boolean networkRequestSuccess = false; int maxAttempts = 10; while (!networkRequestSuccess && maxAttempts > 0) { networkRequestSuccess = performNetworkRequest(NETWORK_TIMEOUT_MILLISECS); maxAttempts--; } if (networkRequestSuccess) { handleNetworkResponse(); } } boolean performNetworkRequest(int timeoutMiliseconds) { // ... } void prepareNetworkRequest() { // ... } public void handleNetworkResponse() { Trace.beginSection("handleNetworkResponse"); // ... Trace.endSection(); }
代码证实了这一假设。onClickSubmit 方法在界面线程上执行网络请求,并使用硬编码的 NETWORK_TIMEOUT_MILLISECS(2000 毫秒)。
至关重要的是,它在 while 循环内运行,最多重试 10 次。
在此特定跟踪记录中,用户的网络连接可能较差。前三次尝试失败,导致三次 2 秒超时(总共 6 秒)。第四次尝试在 0.7 秒后成功,代码得以继续执行 handleNetworkResponse。不过,累积的等待时间已经触发了 ANR。
修复 ANR 问题
如需避免此类 ANR,请将具有不同延迟时间的网络相关操作移至后台线程,而不是在主线程上执行。这样,即使网络连接不佳,界面也能保持响应,从而消除此类 ANR。
利用 AI 智能体自动调查 ANR 问题
您可以使用配置了 Perfetto AI 技能的 AI 编码智能体来查询 ANR 跟踪记录并将其与代码库相关联,而无需在 Perfetto 界面中手动检查时间轴和休眠间隔:
Analyze the Perfetto system trace at </path/to/trace.perfetto-trace>, which
corresponds to an ANR trace, and find the root cause of the ANR using the
Perfetto AI skill. The codebase is located at </path/to/codebase>.
智能体使用 trace_processor 查询跟踪记录,并得出与手动调查相同的结论,而不会被跟踪记录末尾未完成的 handleNetworkResponse 切片误导。它会识别出 MyApp:SubmitButton 阻塞主线程超过 9.2 秒,在 performNetworkRequest 中重构三次 2 秒网络超时和 0.7 秒第四次尝试,以及在 prepareNetworkRequest 和 handleNetworkResponse 中重构 CPU 忙等待循环,并将每个阶段映射到 ProfilingManagerJavaSnippets.java,同时建议将 onClickSubmit 移出界面线程:
# Perfetto ANR Root-Cause Analysis Report

* **Source Code:** `ProfilingManagerJavaSnippets.java`
* **Target Process:** `com.example.sampleapp` (`pid = 32579`, `upid = 27`)
* **Blocked Thread:** Main UI thread `ample.sampleapp` (`tid = 32579`, `utid = 760`)
* **Collection Mechanism:** Android `ProfilingManager` (`ProfilingTrigger.TRIGGER_TYPE_ANR`)

---

## 1. Executive Summary

> **Important:** The ANR in `com.example.sampleapp` is caused by executing **synchronous, blocking network retry logic (`Thread.sleep`) and heavy CPU busy-wait loops (`cpuIntensiveComputation`) directly on the main UI thread** inside the submit button click listener (`MyApp:SubmitButton` -> `onClickSubmit()`).

When the user taps the submit button at `7,967.78 ms` into the trace (`ts = 80459171444519`), the main UI thread is blocked continuously for **more than `9,281.30 ms`** (still unfinished when the trace ends at `17,249.08 ms`):

1. **`prepareNetworkRequest()`** runs a CPU busy-wait loop on the main thread for **`~1,019 ms`**.
2. **`performNetworkRequest(2000)`** executes in a synchronous `while` retry loop on the main thread. Each attempt begins with **`20 ms`** of CPU busy-waiting followed by a `Thread.sleep()`. The request times out (`2,000 ms` sleep) **3 times in a row** and succeeds on the **4th attempt** (`~701 ms` sleep), blocking the main thread for **`~6,764 ms`** across the 4 attempts (`6,703.18 ms` sleeping + `~60 ms` CPU).
3. **`handleNetworkResponse()`** begins at **`+7,783.44 ms`** after the button click and runs another `2,000 ms` CPU busy-wait loop on the main thread (`1,497.86 ms` captured before the trace ends).

    [Touch UP & Click (t = +0 ms)]
      -> prepareNetworkRequest() (~1,000 ms CPU Busy-Wait)
      -> Attempt #1 (Timeout: 20 ms CPU + 2,001 ms Sleep)
      -> Attempt #2 (Timeout: 20 ms CPU + 2,001 ms Sleep)
      -> Attempt #3 (Timeout: 20 ms CPU + 2,001 ms Sleep, crosses 5s ANR threshold)
      -> Attempt #4 (Success: 20 ms CPU + 701 ms Sleep)
      -> handleNetworkResponse() (1,498 ms CPU, unfinished at trace end)
## 2. PerfettoSQL Trace Analysis

### 2.1 Open Main-Thread Slices at Trace End

Querying `thread_or_process_slice` on the main thread (`utid = 760`) around and after the touch event shows that `MyApp:SubmitButton` and its nested slice `handleNetworkResponse` both have `dur = -1` (still open when the trace completed):

```sql
INCLUDE PERFETTO MODULE slices.with_context;

SELECT
  id,
  ts,
  (ts - trace_start()) / 1e6 AS rel_ts_ms,
  dur,
  IIF(dur = -1, trace_end() - ts, dur) / 1e6 AS effective_dur_ms,
  depth,
  name
FROM thread_or_process_slice
WHERE utid = 760 AND ts >= 80459169800000
ORDER BY ts;
```

| Slice ID | Slice Name | Start (`ts` ns) | Offset from Trace Start | Raw `dur` | Effective Duration (to trace end) | Depth |
| :--- | :--- | :--- | :--- | :--- | :--- | :--- |
| `40070` | `dispatchInputEvent MotionEvent UP` | `80459169801575` | `7,966.14 ms` | `190,633 ns` | `0.19 ms` | `0` |
| `40156` | **`MyApp:SubmitButton`** | `80459171444519` | `7,967.78 ms` | `-1` | **`9,281.30 ms`** | `0` |
| `97500` | **`handleNetworkResponse`** | `80466954886580` | `15,751.23 ms` | `-1` | **`1,497.86 ms`** | `1` |

---

### 2.2 Aggregate Main-Thread State (`thread_state`) During `MyApp:SubmitButton`

Aggregating `thread_state` for `utid = 760` from the start of `MyApp:SubmitButton` (`ts >= 80459171444519`) to the end of the trace reveals that the main thread spent **72.3%** of the time sleeping (`S`) and **27.6%** actively spinning on CPU (`Running`):

```sql
SELECT
  state,
  COUNT(*) AS cnt,
  SUM(dur) / 1e6 AS total_dur_ms,
  MIN(dur) / 1e6 AS min_dur_ms,
  MAX(dur) / 1e6 AS max_dur_ms
FROM thread_state
WHERE utid = 760 AND ts >= 80459171444519
GROUP BY state
ORDER BY total_dur_ms DESC;
```

| Thread State | Interval Count | Total Duration | Min Duration | Max Duration | Cause in Code |
| :--- | :--- | :--- | :--- | :--- | :--- |
| **`S` (Sleeping)** | `4` | **`6,703.18 ms`** | `700.78 ms` | `2,000.82 ms` | 4 `Thread.sleep()` calls in `performNetworkRequest()` |
| **`Running` (On CPU)** | `20` | **`2,559.81 ms`** | `0.00 ms` | `578.77 ms` | Busy-wait `while` loops in `cpuIntensiveComputation()` |
| **`R` (Runnable)** | `20` | **`2.11 ms`** | `0.01 ms` | `1.21 ms` | Scheduler wakeups and brief preemptions |

---

### 2.3 Phase-by-Phase Reconstruction (`thread_state` Intervals)

Querying individual `thread_state` intervals (`dur > 2 ms`) shows the exact sequence of CPU bursts and sleeps on the main thread:

```sql
SELECT
  ts,
  (ts - 80459171444519) / 1e6 AS ms_since_submit,
  dur / 1e6 AS dur_ms,
  state
FROM thread_state
WHERE utid = 760 AND ts >= 80459171444519 AND dur > 2e6
ORDER BY ts;
```

| Phase | Offset from Submit (`ms_since_submit`) | State | Duration (`dur_ms`) | Corresponding Code Execution |
| :--- | :--- | :--- | :--- | :--- |
| **1. Request Prep + Attempt #1 CPU** | `+0.63 ms` -> `+1,019.36 ms` | `Running` | **`1,018.68 ms`** *(across 5 slices)* | `prepareNetworkRequest()` (`1,000 ms` CPU) + Attempt #1 `cpuIntensiveComputation(20)` |
| **2. Network Attempt #1 (Timeout)** | `+1,019.36 ms` -> `+3,020.18 ms` | `S` (Sleep) | **`2,000.82 ms`** | `performNetworkRequest(2000)` -> `Thread.sleep(2000)` (`return false`) |
| **3. Network Attempt #2 (CPU)** | `+3,020.23 ms` -> `+3,040.24 ms` | `Running` | **`20.00 ms`** | Attempt #2 `cpuIntensiveComputation(20)` |
| **4. Network Attempt #2 (Timeout)** | `+3,040.24 ms` -> `+5,041.01 ms` | `S` (Sleep) | **`2,000.78 ms`** | `performNetworkRequest(2000)` -> `Thread.sleep(2000)` (`return false`) -- **5s input ANR threshold crossed** |
| **5. Network Attempt #3 (CPU)** | `+5,041.06 ms` -> `+5,061.30 ms` | `Running` | **`20.11 ms`** *(8.05 + 7.93 + 4.14 ms)* | Attempt #3 `cpuIntensiveComputation(20)` |
| **6. Network Attempt #3 (Timeout)** | `+5,061.30 ms` -> `+7,062.09 ms` | `S` (Sleep) | **`2,000.80 ms`** | `performNetworkRequest(2000)` -> `Thread.sleep(2000)` (`return false`) |
| **7. Network Attempt #4 (CPU)** | `+7,062.15 ms` -> `+7,082.38 ms` | `Running` | **`20.22 ms`** | Attempt #4 `cpuIntensiveComputation(20)` |
| **8. Network Attempt #4 (Success)** | `+7,082.38 ms` -> `+7,783.16 ms` | `S` (Sleep) | **`700.78 ms`** | `performNetworkRequest(2000)` hits `Math.random() < 0.2`, sleeps `~700 ms`, `return true` |
| **9. Handle Response (CPU)** | `+7,783.21 ms` -> `+9,281.30 ms` | `Running` | **`1,479.68 ms`** *(across 6 slices)* | `handleNetworkResponse()` (`Trace.beginSection("handleNetworkResponse")` at `+7,783.44 ms`) runs `cpuIntensiveComputation(2000)` until trace ends |

---

## 3. Code Mapping (`ProfilingManagerJavaSnippets.java`)

In `ProfilingManagerJavaSnippets.java` (lines `38` and `158-221`), the `OnClickListener` for `R.id.submit` runs `onClickSubmit()` directly on the main UI thread:

```java
private static final int NETWORK_TIMEOUT_MILLISECS = 2000;

public void setupButtonCallback() {
  findViewById(R.id.submit).setOnClickListener(submitButtonView -> {
    Trace.beginSection("MyApp:SubmitButton");
    onClickSubmit();
    Trace.endSection();
  });
}

public void onClickSubmit() {
  // 1. Blocks main thread on CPU for 1,000 ms
  prepareNetworkRequest();

  // 2. Synchronous retry loop on main thread (up to 10 attempts * 2,020 ms = 20.2 seconds!)
  boolean networkRequestSuccess = false;
  int maxAttempts = 10;
  while (!networkRequestSuccess && maxAttempts > 0) {
    networkRequestSuccess = performNetworkRequest(NETWORK_TIMEOUT_MILLISECS);
    maxAttempts--;
  }

  // 3. Blocks main thread on CPU for another 2,000 ms
  if (networkRequestSuccess) {
    handleNetworkResponse();
  }
}

boolean performNetworkRequest(int timeoutMilliseconds) {
  cpuIntensiveComputation(20);
  try {
    if (Math.random() < 0.2) {
      // Simulate performing a network request by waiting a random period of time
      int networkRequestTimeMs = (int) (Math.random() * timeoutMilliseconds);
      Thread.sleep(networkRequestTimeMs);
      return true;
    } else {
      // Simulate a timeout
      Thread.sleep(timeoutMilliseconds);
    }
  } catch (InterruptedException e) {
  }
  return false;
}

void cpuIntensiveComputation(int durationMs) {
  long start = System.currentTimeMillis();
  while (System.currentTimeMillis() - start < durationMs) {
  }
}

void prepareNetworkRequest() {
  cpuIntensiveComputation(1000);
}

public void handleNetworkResponse() {
  Trace.beginSection("handleNetworkResponse");
  cpuIntensiveComputation(2000);
  Trace.endSection();
}
```

---

## 4. Recommended Remediation

> **Tip:** Never perform network I/O, `Thread.sleep()`, or multi-hundred-millisecond CPU computations on the Android main UI thread.

1. **Offload `onClickSubmit()` to a Background Thread / Coroutine:**
   * In Java, dispatch `prepareNetworkRequest()`, the `performNetworkRequest()` retry loop, and heavy response processing in `handleNetworkResponse()` to a background `ExecutorService` (e.g., `Executors.newSingleThreadExecutor()`), then marshal only lightweight UI updates back to the main thread via `runOnUiThread(...)` or `View.post(...)`.
   * In Kotlin, use `lifecycleScope.launch(Dispatchers.IO)` (for network waiting) and `withContext(Dispatchers.Default)` (for CPU-intensive preparation/parsing).
2. **Use Non-Blocking / Asynchronous Retries with Backoff:**
   * Avoid holding threads with `Thread.sleep()` inside tight retry loops; use asynchronous HTTP client timeouts/retries or `WorkManager` for deferrable background network tasks.