

Halaman ini membahas cara men-debug error Aplikasi Tidak Merespons (ANR)
menggunakan ProfilingManager dengan contoh pelacakan sistem.
Menyiapkan aplikasi untuk mengumpulkan ANR
Mulailah dengan menyiapkan pemicu ANR di aplikasi Anda:
Kotlin
fun addANRTrigger() { val profilingManager = applicationContext.getSystemService(ProfilingManager::class.java) ?: return val triggers = ArrayList<ProfilingTrigger>() val triggerBuilder = ProfilingTrigger.Builder(ProfilingTrigger.TRIGGER_TYPE_ANR) triggers.add(triggerBuilder.build()) val callbackExecutor: Executor = Executors.newSingleThreadExecutor() val resultCallback = Consumer<ProfilingResult> { profilingResult -> // Handle uploading trace to your back-end } profilingManager.registerForAllProfilingResults(callbackExecutor, resultCallback) profilingManager.addProfilingTriggers(triggers) }
Java
public void addANRTrigger() { ProfilingManager profilingManager = getApplicationContext().getSystemService( ProfilingManager.class); List<ProfilingTrigger> triggers = new ArrayList<>(); ProfilingTrigger.Builder triggerBuilder = new ProfilingTrigger.Builder( ProfilingTrigger.TRIGGER_TYPE_ANR); triggers.add(triggerBuilder.build()); Executor callbackExecutor = Executors.newSingleThreadExecutor(); Consumer<ProfilingResult> resultCallback = profilingResult -> { // Handle uploading trace to your back-end }; profilingManager.registerForAllProfilingResults(callbackExecutor, resultCallback); profilingManager.addProfilingTriggers(triggers); }
Setelah merekam dan mengupload rekaman aktivitas ANR, Anda dapat memeriksanya secara manual di Perfetto UI seperti yang ditunjukkan dalam langkah-langkah berikut, atau mengotomatiskan investigasi ANR dengan agen AI.
Menganalisis rekaman aktivitas
Karena ANR memicu rekaman aktivitas, Anda tahu bahwa rekaman aktivitas berakhir saat sistem mendeteksi ketidakresponsifan di thread utama aplikasi (atau saat waktu tunggu lain terjadi). Gambar 1 menunjukkan cara membuka thread utama aplikasi, yang diberi tag sesuai dalam UI.

Akhir rekaman aktivitas cocok dengan stempel waktu ANR, seperti yang ditunjukkan pada Gambar 2.
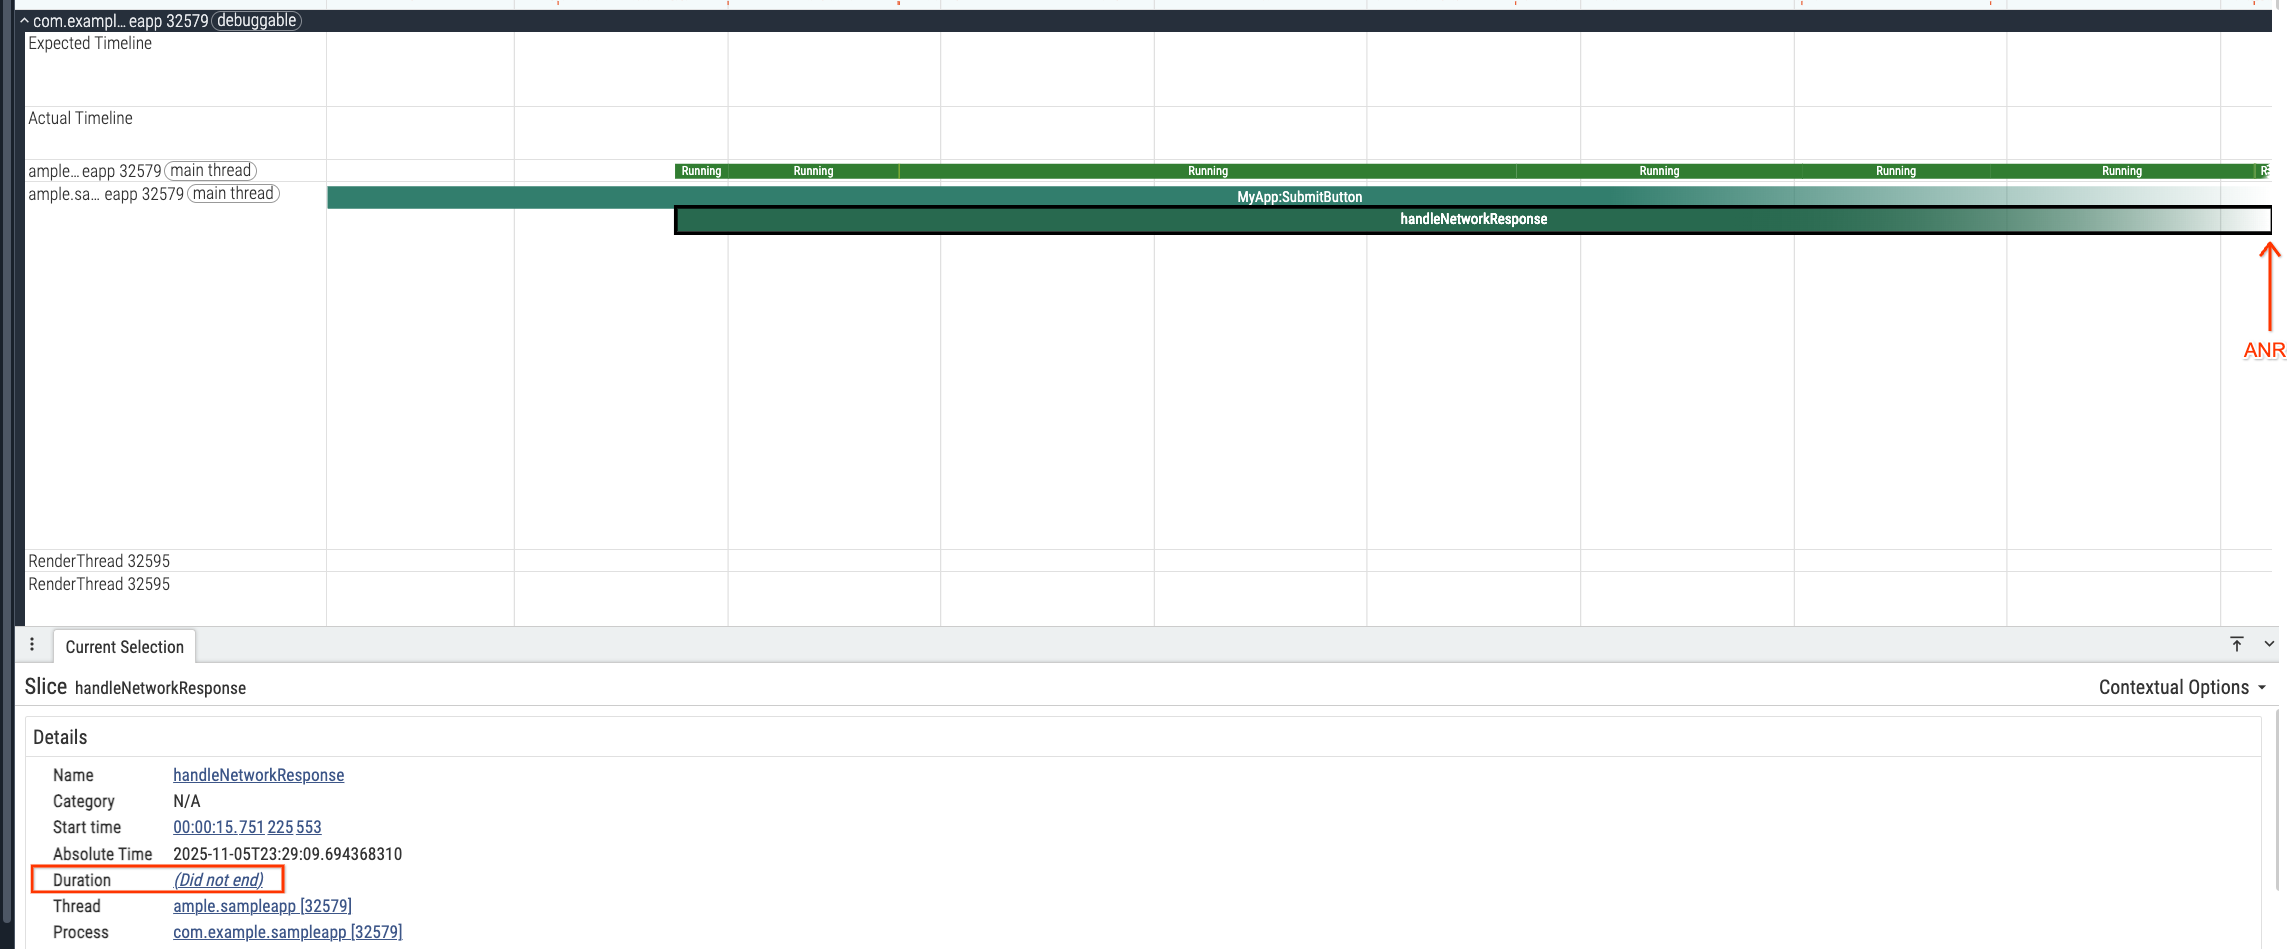
Saat ANR terjadi, thread utama menjalankan
slice handleNetworkResponse di dalam MyApp:SubmitButton, yang menggunakan waktu CPU selama 1,48
detik (Gambar 3).

Hanya mengandalkan stack dump yang diambil pada saat ANR dapat salah mengatribusikan
pembekuan sepenuhnya ke handleNetworkResponse. Namun, 1,48 detik saja tidak
cukup lama untuk memicu ANR, jadi Anda perlu memeriksa apa yang memblokir
thread utama sebelumnya.
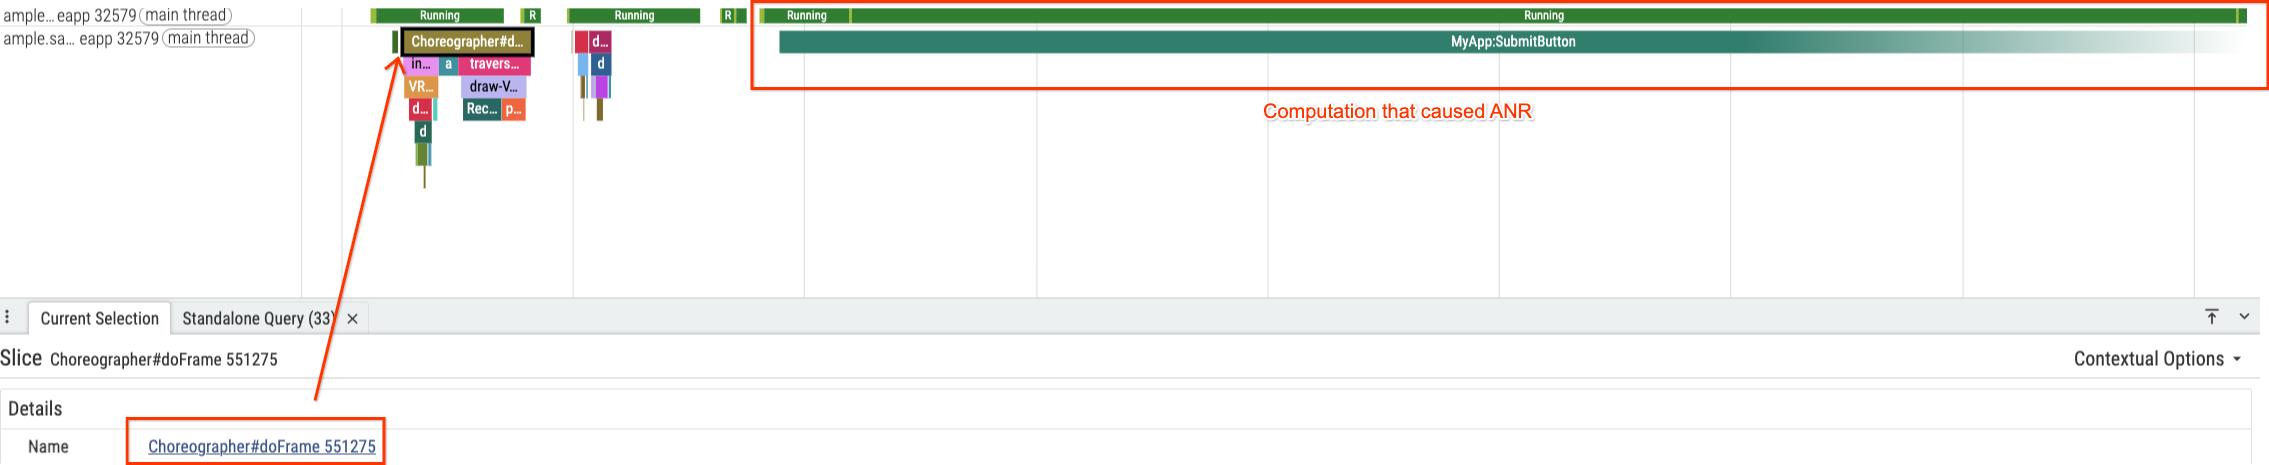
Mulailah dengan menemukan frame UI terakhir yang dirender sebelum freeze
(Choreographer#doFrame 551275), yang langsung mendahului
slice MyApp:SubmitButton (Gambar 4).
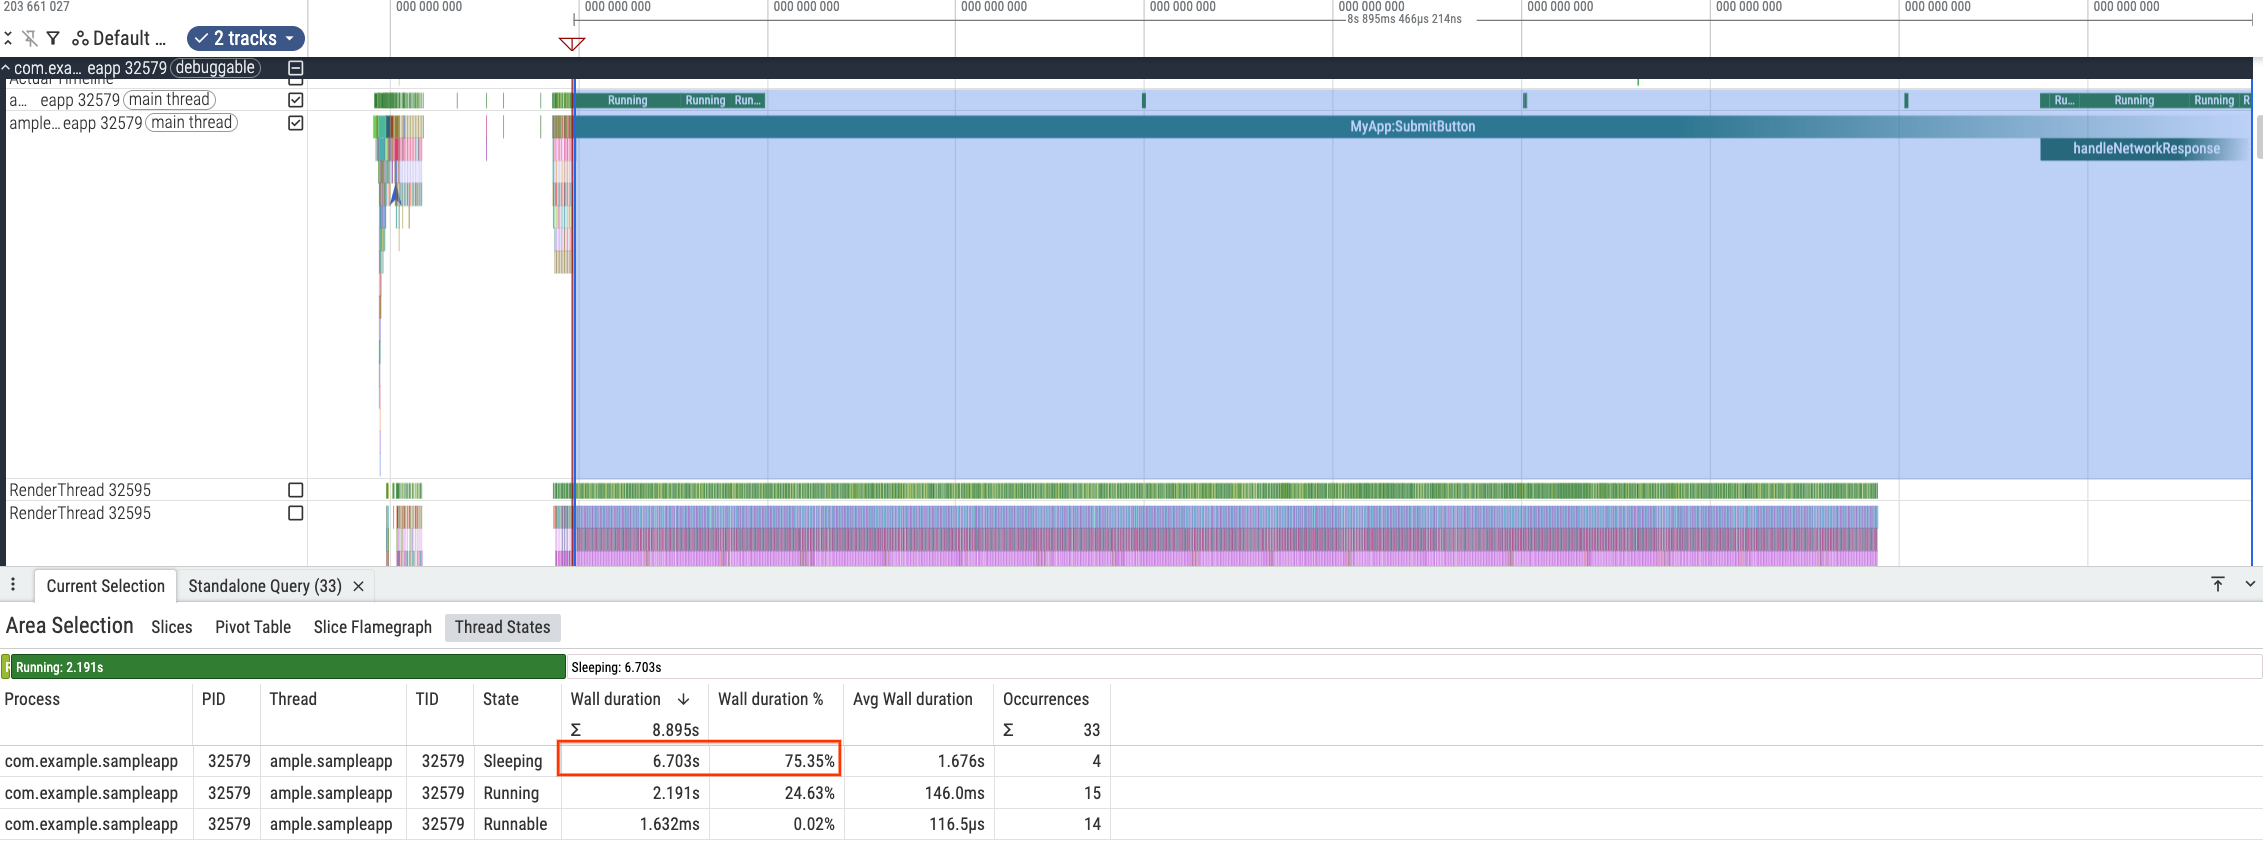
Untuk memahami pemblokiran, perkecil untuk memeriksa seluruh slice
MyApp:SubmitButton. Anda akan melihat detail penting dalam status thread untuk rentang yang dipilih secara manual
pada Gambar 5: thread menghabiskan sekitar 75% waktu (6,7
detik) dalam status Sleeping dan hanya 24% waktu dalam status Running.
MyApp:SubmitButton.Hal ini menunjukkan bahwa penyebab utama ANR adalah menunggu, bukan komputasi. Periksa setiap kemunculan tidur untuk menemukan pola.

MyApp:SubmitButton.
MyApp:SubmitButton.
MyApp:SubmitButton.
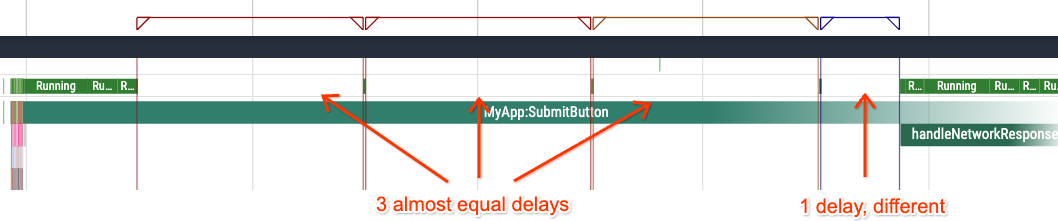
MyApp:SubmitButton.Tiga interval tidur pertama (Gambar 6–8) masing-masing berdurasi sekitar 2 detik, dan interval keempat (Gambar 9) berdurasi 0,7 detik. Jeda 2 detik yang berulang sangat menunjukkan waktu tunggu terprogram yang dicoba ulang tiga kali sebelum berhasil pada upaya keempat—mengumpulkan penundaan yang cukup untuk memicu ANR (Gambar 10).
MyApp:SubmitButton.Mengidentifikasi akar masalah dalam kode
Untuk memverifikasi hipotesis ini, periksa kode yang terkait dengan
bagian rekaman aktivitas MyApp:SubmitButton:
Kotlin
fun setupButtonCallback() { findViewById<View>(R.id.submit).setOnClickListener { trace("MyApp:SubmitButton") { onClickSubmit() } } } fun onClickSubmit() { prepareNetworkRequest() var networkRequestSuccess = false var maxAttempts = 10 while (!networkRequestSuccess && maxAttempts > 0) { networkRequestSuccess = performNetworkRequest(NETWORK_TIMEOUT_MILLISECS) maxAttempts-- } if (networkRequestSuccess) { handleNetworkResponse() } } fun performNetworkRequest(timeoutMilliseconds: Int): Boolean { // ... } fun prepareNetworkRequest() { // ... } fun handleNetworkResponse() { trace("handleNetworkResponse") { // ... } } companion object { private const val NETWORK_TIMEOUT_MILLISECS = 2000 }
Java
private static final int NETWORK_TIMEOUT_MILLISECS = 2000; public void setupButtonCallback() { findViewById(R.id.submit).setOnClickListener(submitButtonView -> { Trace.beginSection("MyApp:SubmitButton"); onClickSubmit(); Trace.endSection(); }); } public void onClickSubmit() { prepareNetworkRequest(); boolean networkRequestSuccess = false; int maxAttempts = 10; while (!networkRequestSuccess && maxAttempts > 0) { networkRequestSuccess = performNetworkRequest(NETWORK_TIMEOUT_MILLISECS); maxAttempts--; } if (networkRequestSuccess) { handleNetworkResponse(); } } boolean performNetworkRequest(int timeoutMiliseconds) { // ... } void prepareNetworkRequest() { // ... } public void handleNetworkResponse() { Trace.beginSection("handleNetworkResponse"); // ... Trace.endSection(); }
Kode ini mengonfirmasi hipotesis tersebut. Metode onClickSubmit menjalankan permintaan jaringan
pada UI thread dengan NETWORK_TIMEOUT_MILLISECS hardcode sebesar 2.000 md.
Yang terpenting, fungsi ini berjalan di dalam loop while yang mencoba ulang hingga 10 kali.
Dalam rekaman aktivitas khusus ini, pengguna kemungkinan memiliki konektivitas jaringan yang buruk. Tiga upaya pertama gagal, sehingga menyebabkan tiga waktu tunggu 2 detik (total 6 detik).
Upaya keempat berhasil setelah 0,7 detik, sehingga kode dapat melanjutkan ke
handleNetworkResponse. Namun, akumulasi waktu tunggu telah memicu
ANR.
Memperbaiki ANR
Hindari jenis ANR ini dengan memindahkan operasi terkait jaringan yang memiliki latensi bervariasi ke thread latar belakang, bukan mengeksekusinya di thread utama. Hal ini membuat UI tetap responsif meskipun konektivitas buruk, sehingga menghilangkan class ANR ini.
Mengotomatiskan investigasi ANR dengan agen AI
Daripada memeriksa linimasa dan interval tidur secara manual di UI Perfetto, Anda dapat menggunakan agen coding AI yang dikonfigurasi dengan kemampuan AI Perfetto untuk mengkueri trace ANR dan menghubungkannya dengan codebase Anda:
Analyze the Perfetto system trace at </path/to/trace.perfetto-trace>, which
corresponds to an ANR trace, and find the root cause of the ANR using the
Perfetto AI skill. The codebase is located at </path/to/codebase>.
Agen mengkueri trace dengan trace_processor dan mencapai kesimpulan yang sama
dengan investigasi manual—tanpa disesatkan oleh slice handleNetworkResponse yang belum selesai
di akhir trace. Alat ini mengidentifikasi bahwa
MyApp:SubmitButton memblokir thread utama selama lebih dari 9,2 detik, merekonstruksi
tiga waktu tunggu jaringan 2 detik dan upaya keempat 0,7 detik di
performNetworkRequest bersama dengan loop tunggu sibuk CPU di
prepareNetworkRequest dan handleNetworkResponse, serta memetakan setiap fase ke
ProfilingManagerJavaSnippets.java dengan rekomendasi untuk memindahkan
onClickSubmit dari UI thread:
# Perfetto ANR Root-Cause Analysis Report

* **Source Code:** `ProfilingManagerJavaSnippets.java`
* **Target Process:** `com.example.sampleapp` (`pid = 32579`, `upid = 27`)
* **Blocked Thread:** Main UI thread `ample.sampleapp` (`tid = 32579`, `utid = 760`)
* **Collection Mechanism:** Android `ProfilingManager` (`ProfilingTrigger.TRIGGER_TYPE_ANR`)

---

## 1. Executive Summary

> **Important:** The ANR in `com.example.sampleapp` is caused by executing **synchronous, blocking network retry logic (`Thread.sleep`) and heavy CPU busy-wait loops (`cpuIntensiveComputation`) directly on the main UI thread** inside the submit button click listener (`MyApp:SubmitButton` -> `onClickSubmit()`).

When the user taps the submit button at `7,967.78 ms` into the trace (`ts = 80459171444519`), the main UI thread is blocked continuously for **more than `9,281.30 ms`** (still unfinished when the trace ends at `17,249.08 ms`):

1. **`prepareNetworkRequest()`** runs a CPU busy-wait loop on the main thread for **`~1,019 ms`**.
2. **`performNetworkRequest(2000)`** executes in a synchronous `while` retry loop on the main thread. Each attempt begins with **`20 ms`** of CPU busy-waiting followed by a `Thread.sleep()`. The request times out (`2,000 ms` sleep) **3 times in a row** and succeeds on the **4th attempt** (`~701 ms` sleep), blocking the main thread for **`~6,764 ms`** across the 4 attempts (`6,703.18 ms` sleeping + `~60 ms` CPU).
3. **`handleNetworkResponse()`** begins at **`+7,783.44 ms`** after the button click and runs another `2,000 ms` CPU busy-wait loop on the main thread (`1,497.86 ms` captured before the trace ends).

    [Touch UP & Click (t = +0 ms)]
      -> prepareNetworkRequest() (~1,000 ms CPU Busy-Wait)
      -> Attempt #1 (Timeout: 20 ms CPU + 2,001 ms Sleep)
      -> Attempt #2 (Timeout: 20 ms CPU + 2,001 ms Sleep)
      -> Attempt #3 (Timeout: 20 ms CPU + 2,001 ms Sleep, crosses 5s ANR threshold)
      -> Attempt #4 (Success: 20 ms CPU + 701 ms Sleep)
      -> handleNetworkResponse() (1,498 ms CPU, unfinished at trace end)
## 2. PerfettoSQL Trace Analysis

### 2.1 Open Main-Thread Slices at Trace End

Querying `thread_or_process_slice` on the main thread (`utid = 760`) around and after the touch event shows that `MyApp:SubmitButton` and its nested slice `handleNetworkResponse` both have `dur = -1` (still open when the trace completed):

```sql
INCLUDE PERFETTO MODULE slices.with_context;

SELECT
  id,
  ts,
  (ts - trace_start()) / 1e6 AS rel_ts_ms,
  dur,
  IIF(dur = -1, trace_end() - ts, dur) / 1e6 AS effective_dur_ms,
  depth,
  name
FROM thread_or_process_slice
WHERE utid = 760 AND ts >= 80459169800000
ORDER BY ts;
```

| Slice ID | Slice Name | Start (`ts` ns) | Offset from Trace Start | Raw `dur` | Effective Duration (to trace end) | Depth |
| :--- | :--- | :--- | :--- | :--- | :--- | :--- |
| `40070` | `dispatchInputEvent MotionEvent UP` | `80459169801575` | `7,966.14 ms` | `190,633 ns` | `0.19 ms` | `0` |
| `40156` | **`MyApp:SubmitButton`** | `80459171444519` | `7,967.78 ms` | `-1` | **`9,281.30 ms`** | `0` |
| `97500` | **`handleNetworkResponse`** | `80466954886580` | `15,751.23 ms` | `-1` | **`1,497.86 ms`** | `1` |

---

### 2.2 Aggregate Main-Thread State (`thread_state`) During `MyApp:SubmitButton`

Aggregating `thread_state` for `utid = 760` from the start of `MyApp:SubmitButton` (`ts >= 80459171444519`) to the end of the trace reveals that the main thread spent **72.3%** of the time sleeping (`S`) and **27.6%** actively spinning on CPU (`Running`):

```sql
SELECT
  state,
  COUNT(*) AS cnt,
  SUM(dur) / 1e6 AS total_dur_ms,
  MIN(dur) / 1e6 AS min_dur_ms,
  MAX(dur) / 1e6 AS max_dur_ms
FROM thread_state
WHERE utid = 760 AND ts >= 80459171444519
GROUP BY state
ORDER BY total_dur_ms DESC;
```

| Thread State | Interval Count | Total Duration | Min Duration | Max Duration | Cause in Code |
| :--- | :--- | :--- | :--- | :--- | :--- |
| **`S` (Sleeping)** | `4` | **`6,703.18 ms`** | `700.78 ms` | `2,000.82 ms` | 4 `Thread.sleep()` calls in `performNetworkRequest()` |
| **`Running` (On CPU)** | `20` | **`2,559.81 ms`** | `0.00 ms` | `578.77 ms` | Busy-wait `while` loops in `cpuIntensiveComputation()` |
| **`R` (Runnable)** | `20` | **`2.11 ms`** | `0.01 ms` | `1.21 ms` | Scheduler wakeups and brief preemptions |

---

### 2.3 Phase-by-Phase Reconstruction (`thread_state` Intervals)

Querying individual `thread_state` intervals (`dur > 2 ms`) shows the exact sequence of CPU bursts and sleeps on the main thread:

```sql
SELECT
  ts,
  (ts - 80459171444519) / 1e6 AS ms_since_submit,
  dur / 1e6 AS dur_ms,
  state
FROM thread_state
WHERE utid = 760 AND ts >= 80459171444519 AND dur > 2e6
ORDER BY ts;
```

| Phase | Offset from Submit (`ms_since_submit`) | State | Duration (`dur_ms`) | Corresponding Code Execution |
| :--- | :--- | :--- | :--- | :--- |
| **1. Request Prep + Attempt #1 CPU** | `+0.63 ms` -> `+1,019.36 ms` | `Running` | **`1,018.68 ms`** *(across 5 slices)* | `prepareNetworkRequest()` (`1,000 ms` CPU) + Attempt #1 `cpuIntensiveComputation(20)` |
| **2. Network Attempt #1 (Timeout)** | `+1,019.36 ms` -> `+3,020.18 ms` | `S` (Sleep) | **`2,000.82 ms`** | `performNetworkRequest(2000)` -> `Thread.sleep(2000)` (`return false`) |
| **3. Network Attempt #2 (CPU)** | `+3,020.23 ms` -> `+3,040.24 ms` | `Running` | **`20.00 ms`** | Attempt #2 `cpuIntensiveComputation(20)` |
| **4. Network Attempt #2 (Timeout)** | `+3,040.24 ms` -> `+5,041.01 ms` | `S` (Sleep) | **`2,000.78 ms`** | `performNetworkRequest(2000)` -> `Thread.sleep(2000)` (`return false`) -- **5s input ANR threshold crossed** |
| **5. Network Attempt #3 (CPU)** | `+5,041.06 ms` -> `+5,061.30 ms` | `Running` | **`20.11 ms`** *(8.05 + 7.93 + 4.14 ms)* | Attempt #3 `cpuIntensiveComputation(20)` |
| **6. Network Attempt #3 (Timeout)** | `+5,061.30 ms` -> `+7,062.09 ms` | `S` (Sleep) | **`2,000.80 ms`** | `performNetworkRequest(2000)` -> `Thread.sleep(2000)` (`return false`) |
| **7. Network Attempt #4 (CPU)** | `+7,062.15 ms` -> `+7,082.38 ms` | `Running` | **`20.22 ms`** | Attempt #4 `cpuIntensiveComputation(20)` |
| **8. Network Attempt #4 (Success)** | `+7,082.38 ms` -> `+7,783.16 ms` | `S` (Sleep) | **`700.78 ms`** | `performNetworkRequest(2000)` hits `Math.random() < 0.2`, sleeps `~700 ms`, `return true` |
| **9. Handle Response (CPU)** | `+7,783.21 ms` -> `+9,281.30 ms` | `Running` | **`1,479.68 ms`** *(across 6 slices)* | `handleNetworkResponse()` (`Trace.beginSection("handleNetworkResponse")` at `+7,783.44 ms`) runs `cpuIntensiveComputation(2000)` until trace ends |

---

## 3. Code Mapping (`ProfilingManagerJavaSnippets.java`)

In `ProfilingManagerJavaSnippets.java` (lines `38` and `158-221`), the `OnClickListener` for `R.id.submit` runs `onClickSubmit()` directly on the main UI thread:

```java
private static final int NETWORK_TIMEOUT_MILLISECS = 2000;

public void setupButtonCallback() {
  findViewById(R.id.submit).setOnClickListener(submitButtonView -> {
    Trace.beginSection("MyApp:SubmitButton");
    onClickSubmit();
    Trace.endSection();
  });
}

public void onClickSubmit() {
  // 1. Blocks main thread on CPU for 1,000 ms
  prepareNetworkRequest();

  // 2. Synchronous retry loop on main thread (up to 10 attempts * 2,020 ms = 20.2 seconds!)
  boolean networkRequestSuccess = false;
  int maxAttempts = 10;
  while (!networkRequestSuccess && maxAttempts > 0) {
    networkRequestSuccess = performNetworkRequest(NETWORK_TIMEOUT_MILLISECS);
    maxAttempts--;
  }

  // 3. Blocks main thread on CPU for another 2,000 ms
  if (networkRequestSuccess) {
    handleNetworkResponse();
  }
}

boolean performNetworkRequest(int timeoutMilliseconds) {
  cpuIntensiveComputation(20);
  try {
    if (Math.random() < 0.2) {
      // Simulate performing a network request by waiting a random period of time
      int networkRequestTimeMs = (int) (Math.random() * timeoutMilliseconds);
      Thread.sleep(networkRequestTimeMs);
      return true;
    } else {
      // Simulate a timeout
      Thread.sleep(timeoutMilliseconds);
    }
  } catch (InterruptedException e) {
  }
  return false;
}

void cpuIntensiveComputation(int durationMs) {
  long start = System.currentTimeMillis();
  while (System.currentTimeMillis() - start < durationMs) {
  }
}

void prepareNetworkRequest() {
  cpuIntensiveComputation(1000);
}

public void handleNetworkResponse() {
  Trace.beginSection("handleNetworkResponse");
  cpuIntensiveComputation(2000);
  Trace.endSection();
}
```

---

## 4. Recommended Remediation

> **Tip:** Never perform network I/O, `Thread.sleep()`, or multi-hundred-millisecond CPU computations on the Android main UI thread.

1. **Offload `onClickSubmit()` to a Background Thread / Coroutine:**
   * In Java, dispatch `prepareNetworkRequest()`, the `performNetworkRequest()` retry loop, and heavy response processing in `handleNetworkResponse()` to a background `ExecutorService` (e.g., `Executors.newSingleThreadExecutor()`), then marshal only lightweight UI updates back to the main thread via `runOnUiThread(...)` or `View.post(...)`.
   * In Kotlin, use `lifecycleScope.launch(Dispatchers.IO)` (for network waiting) and `withContext(Dispatchers.Default)` (for CPU-intensive preparation/parsing).
2. **Use Non-Blocking / Asynchronous Retries with Backoff:**
   * Avoid holding threads with `Thread.sleep()` inside tight retry loops; use asynchronous HTTP client timeouts/retries or `WorkManager` for deferrable background network tasks.