

इस पेज पर, ProfilingManager का इस्तेमाल करके ऐप्लिकेशन काम नहीं कर रहा है (एएनआर) गड़बड़ी को डीबग करने का तरीका बताया गया है. इसके लिए, सिस्टम ट्रेस करने की प्रोसेस का उदाहरण दिया गया है.
एएनआर इकट्ठा करने के लिए ऐप्लिकेशन सेट अप करना
अपने ऐप्लिकेशन में एएनआर ट्रिगर सेट अप करके शुरू करें:
Kotlin
fun addANRTrigger() { val profilingManager = applicationContext.getSystemService(ProfilingManager::class.java) ?: return val triggers = ArrayList<ProfilingTrigger>() val triggerBuilder = ProfilingTrigger.Builder(ProfilingTrigger.TRIGGER_TYPE_ANR) triggers.add(triggerBuilder.build()) val callbackExecutor: Executor = Executors.newSingleThreadExecutor() val resultCallback = Consumer<ProfilingResult> { profilingResult -> // Handle uploading trace to your back-end } profilingManager.registerForAllProfilingResults(callbackExecutor, resultCallback) profilingManager.addProfilingTriggers(triggers) }
Java
public void addANRTrigger() { ProfilingManager profilingManager = getApplicationContext().getSystemService( ProfilingManager.class); List<ProfilingTrigger> triggers = new ArrayList<>(); ProfilingTrigger.Builder triggerBuilder = new ProfilingTrigger.Builder( ProfilingTrigger.TRIGGER_TYPE_ANR); triggers.add(triggerBuilder.build()); Executor callbackExecutor = Executors.newSingleThreadExecutor(); Consumer<ProfilingResult> resultCallback = profilingResult -> { // Handle uploading trace to your back-end }; profilingManager.registerForAllProfilingResults(callbackExecutor, resultCallback); profilingManager.addProfilingTriggers(triggers); }
एएनआर ट्रेस को कैप्चर और अपलोड करने के बाद, उसे Perfetto यूज़र इंटरफ़ेस (यूआई) में मैन्युअल तरीके से जांचा जा सकता है. इसके लिए, यहां दिया गया तरीका अपनाएं. इसके अलावा, एआई एजेंट की मदद से एएनआर की जांच को ऑटोमेट किया जा सकता है.
ट्रेस का विश्लेषण करना
एएनआर की वजह से ट्रेस ट्रिगर हुआ. इसलिए, आपको पता है कि ट्रेस तब खत्म हुआ, जब सिस्टम को आपके ऐप्लिकेशन के मुख्य थ्रेड में, जवाब न देने की समस्या का पता चला या जब टाइम आउट की कोई दूसरी समस्या हुई. पहली इमेज में, अपने ऐप्लिकेशन के मुख्य थ्रेड पर जाने का तरीका बताया गया है. इसे यूज़र इंटरफ़ेस (यूआई) में टैग किया गया है.

ट्रेस का आखिरी हिस्सा, एएनआर के टाइमस्टैंप से मैच होता है, जैसा कि इमेज 2 में दिखाया गया है.
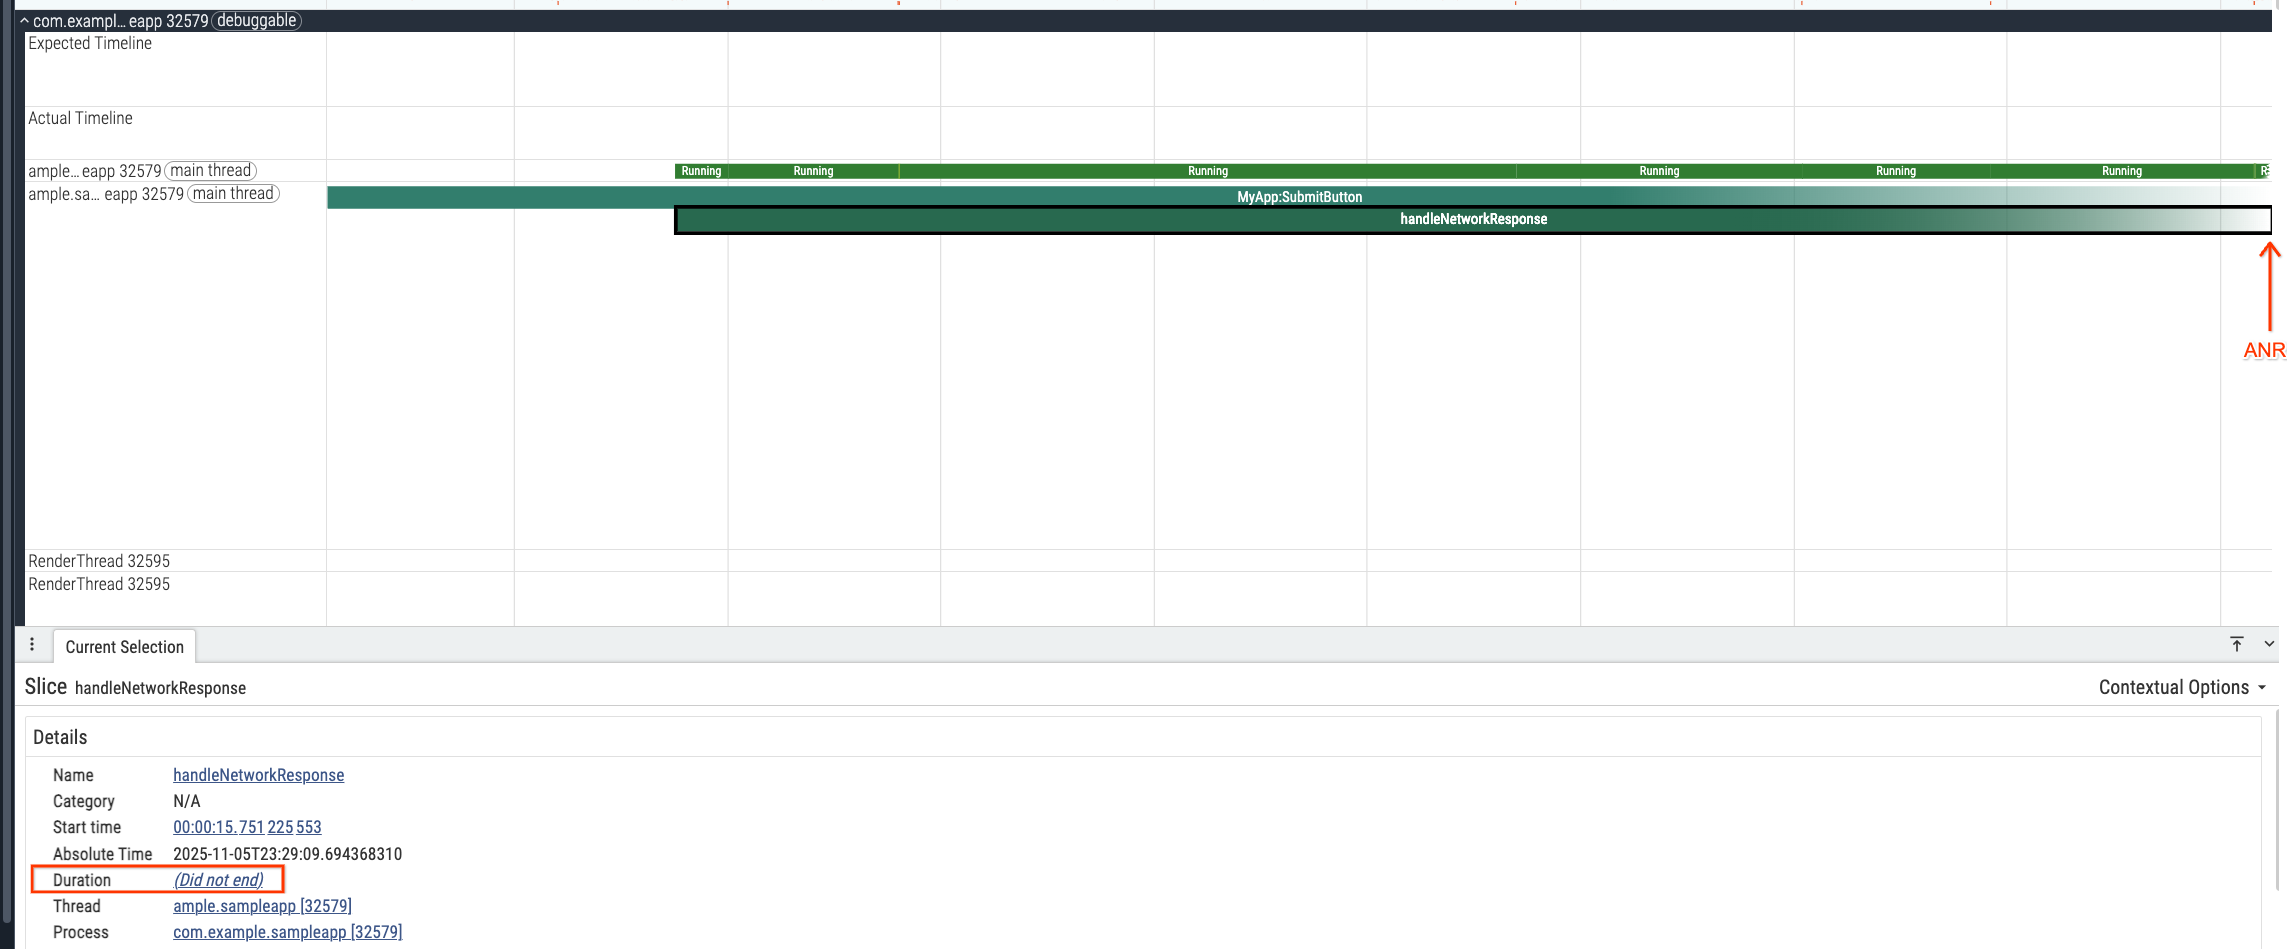
जब एएनआर की गड़बड़ी हुई, तब मुख्य थ्रेड MyApp:SubmitButton में handleNetworkResponse स्लाइस को लागू कर रहा था. इसमें 1.48 सेकंड का सीपीयू समय लगा (इमेज 3).

एएनआर के समय लिए गए स्टैक डंप पर ही भरोसा करने से, ऐप्लिकेशन के फ़्रीज़ होने की वजह handleNetworkResponse को माना जा सकता है. हालांकि, 1.48 सेकंड का समय, ANR की गड़बड़ी को ट्रिगर करने के लिए काफ़ी नहीं है. इसलिए, आपको यह देखना होगा कि मुख्य थ्रेड को पहले किसने ब्लॉक किया था.
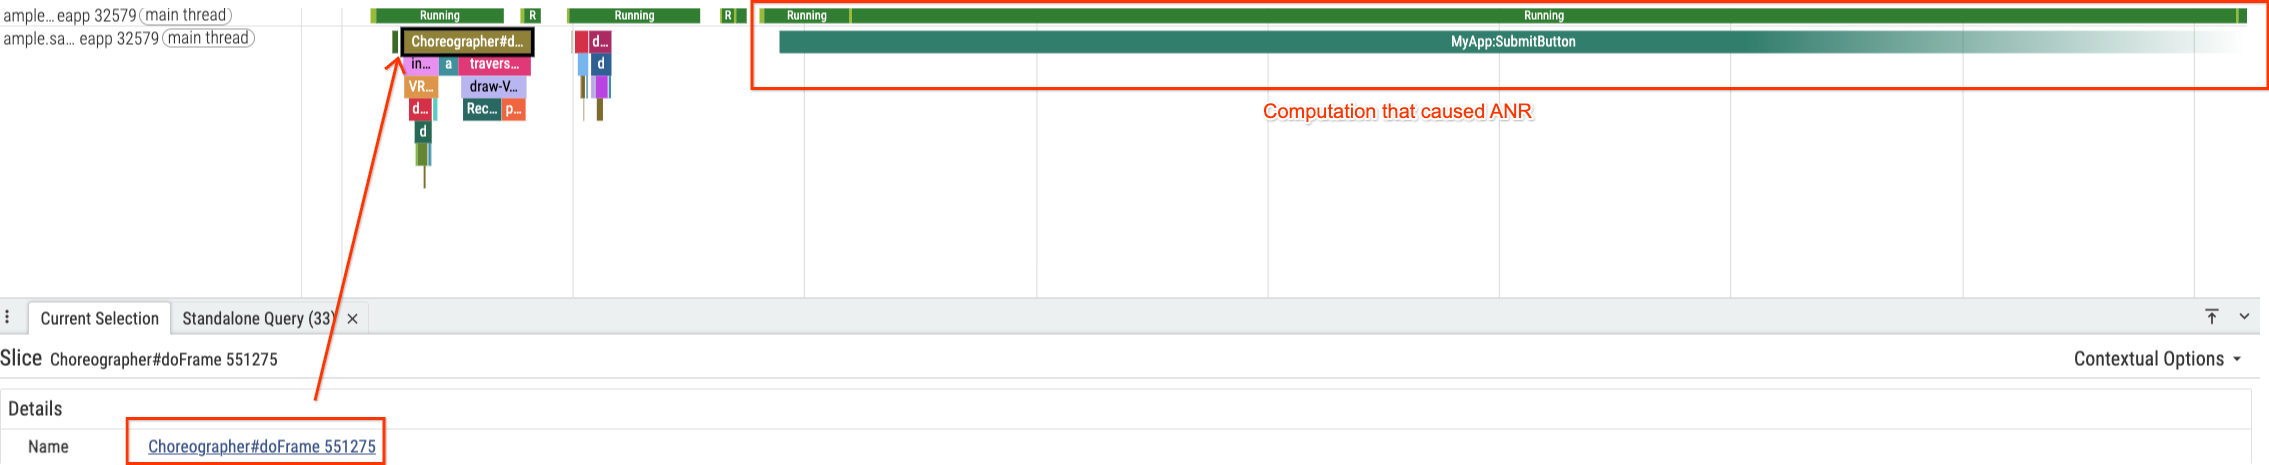
सबसे पहले, फ़्रीज़ होने से पहले रेंडर किए गए आखिरी यूज़र इंटरफ़ेस (यूआई) फ़्रेम (Choreographer#doFrame 551275) का पता लगाएं. यह फ़्रेम, MyApp:SubmitButton स्लाइस (इमेज 4) से ठीक पहले रेंडर किया गया था.
ब्लॉकेज को समझने के लिए, ज़ूम आउट करें और MyApp:SubmitButton स्लाइस को पूरी तरह से देखें. आपको इमेज 5 में मैन्युअल तरीके से चुनी गई रेंज के लिए, थ्रेड की स्थितियों में एक अहम जानकारी दिखेगी: थ्रेड ने करीब 75% समय (6.7 सेकंड) Sleeping स्थिति में और सिर्फ़ 24% समय Running स्थिति में बिताया.
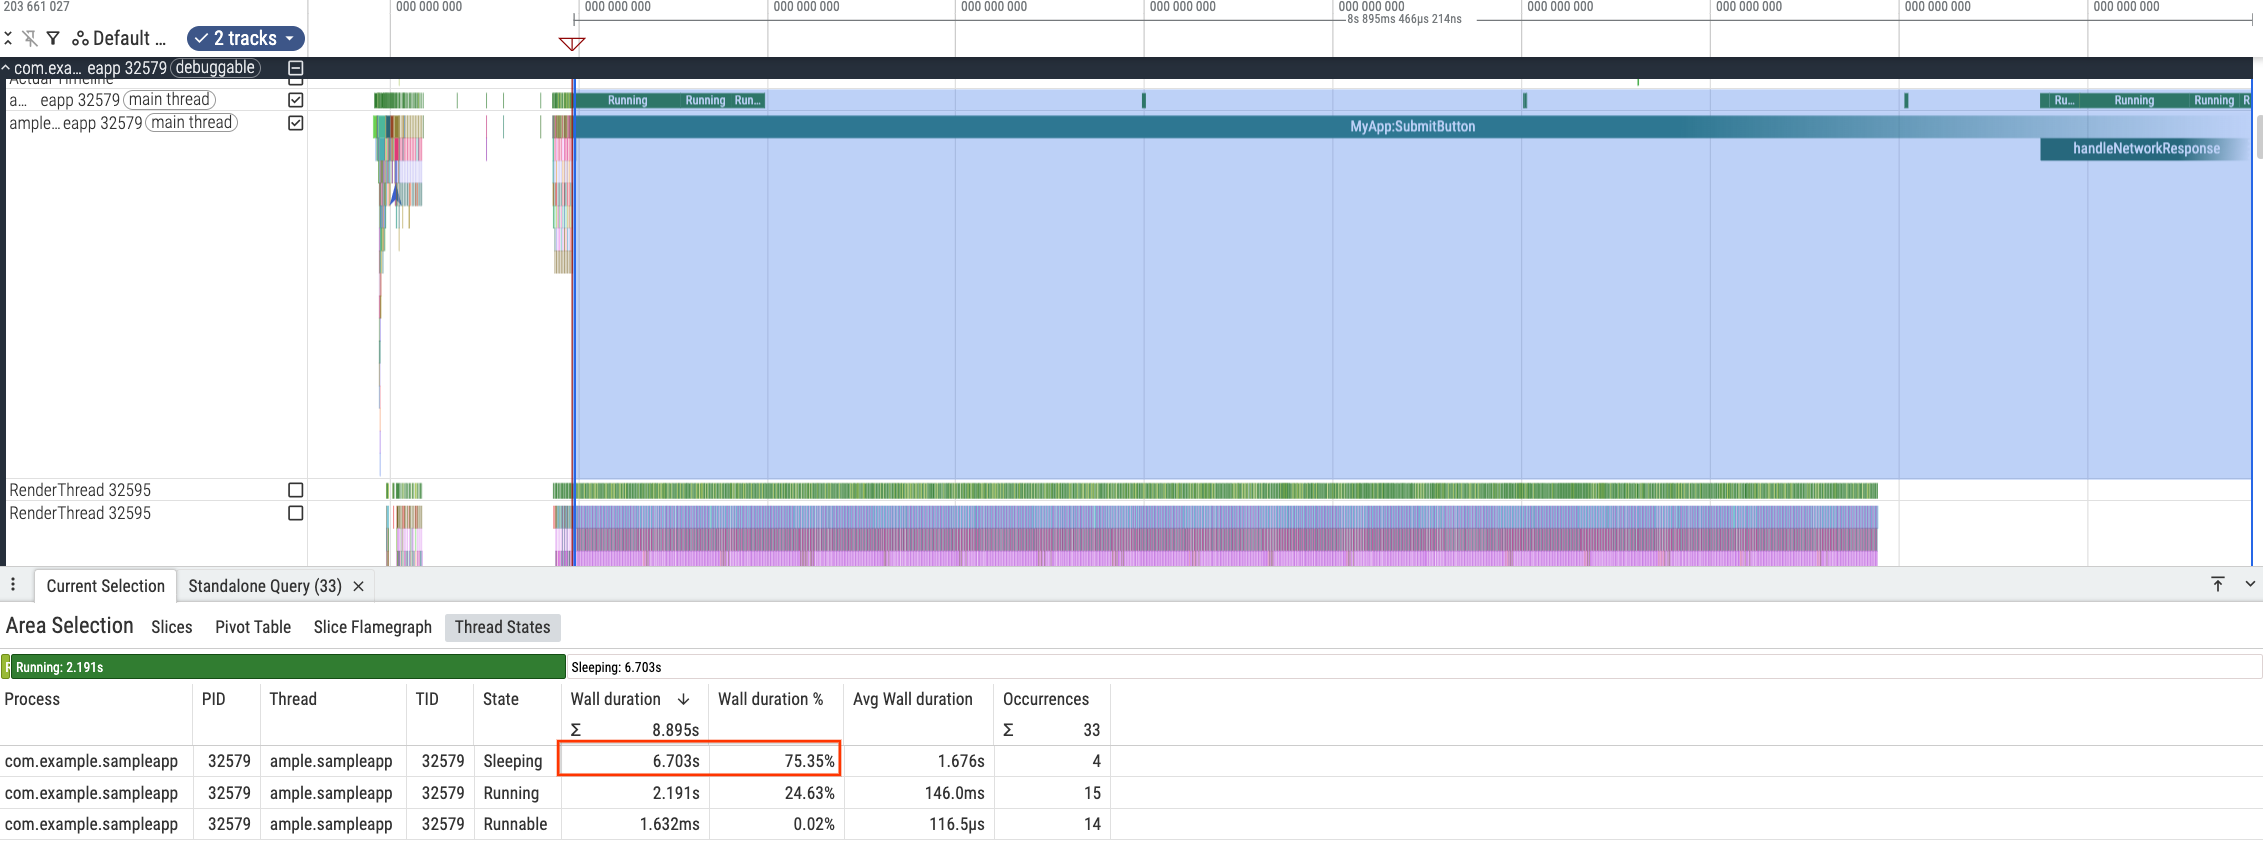
MyApp:SubmitButton ऑपरेशन के दौरान थ्रेड की स्थितियां.इससे पता चलता है कि ANR की गड़बड़ी की मुख्य वजह, कंप्यूटेशन नहीं, बल्कि इंतज़ार करना था. नींद के पैटर्न का पता लगाने के लिए, नींद के अलग-अलग सेशन की जांच करें.

MyApp:SubmitButton के अंदर पहली बार सोने का समय.
MyApp:SubmitButton के अंदर सोने का दूसरा समय.
MyApp:SubmitButton के अंदर तीसरी बार सोने का समय.
MyApp:SubmitButton के अंदर सोने का चौथा समय.स्लीप मोड के पहले तीन इंटरवल (इमेज 6 से 8) करीब दो सेकंड के होते हैं. चौथा इंटरवल (इमेज 9) 0.7 सेकंड का होता है. दो सेकंड के लिए बार-बार रुकने से, प्रोग्राम किए गए टाइम आउट का पता चलता है. इसमें चौथी कोशिश में सफल होने से पहले, तीन बार कोशिश की गई. इससे, एएनआर को ट्रिगर करने में काफ़ी देरी हुई (इमेज 10).
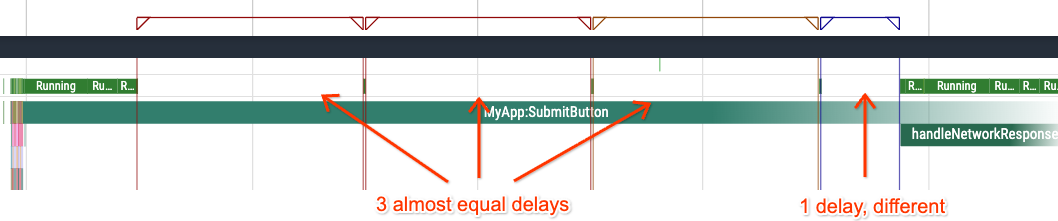
MyApp:SubmitButton स्लाइस के दौरान हुई देरी की खास जानकारी.कोड में मौजूद असल वजह का पता लगाना
इस अनुमान की पुष्टि करने के लिए, MyApp:SubmitButton ट्रेस सेक्शन से जुड़े कोड की जांच करें:
Kotlin
fun setupButtonCallback() { findViewById<View>(R.id.submit).setOnClickListener { trace("MyApp:SubmitButton") { onClickSubmit() } } } fun onClickSubmit() { prepareNetworkRequest() var networkRequestSuccess = false var maxAttempts = 10 while (!networkRequestSuccess && maxAttempts > 0) { networkRequestSuccess = performNetworkRequest(NETWORK_TIMEOUT_MILLISECS) maxAttempts-- } if (networkRequestSuccess) { handleNetworkResponse() } } fun performNetworkRequest(timeoutMilliseconds: Int): Boolean { // ... } fun prepareNetworkRequest() { // ... } fun handleNetworkResponse() { trace("handleNetworkResponse") { // ... } } companion object { private const val NETWORK_TIMEOUT_MILLISECS = 2000 }
Java
private static final int NETWORK_TIMEOUT_MILLISECS = 2000; public void setupButtonCallback() { findViewById(R.id.submit).setOnClickListener(submitButtonView -> { Trace.beginSection("MyApp:SubmitButton"); onClickSubmit(); Trace.endSection(); }); } public void onClickSubmit() { prepareNetworkRequest(); boolean networkRequestSuccess = false; int maxAttempts = 10; while (!networkRequestSuccess && maxAttempts > 0) { networkRequestSuccess = performNetworkRequest(NETWORK_TIMEOUT_MILLISECS); maxAttempts--; } if (networkRequestSuccess) { handleNetworkResponse(); } } boolean performNetworkRequest(int timeoutMiliseconds) { // ... } void prepareNetworkRequest() { // ... } public void handleNetworkResponse() { Trace.beginSection("handleNetworkResponse"); // ... Trace.endSection(); }
कोड से इस अनुमान की पुष्टि होती है. onClickSubmit तरीका, यूज़र इंटरफ़ेस (यूआई) थ्रेड पर नेटवर्क अनुरोध को एक्ज़ीक्यूट करता है. इसके लिए, 2,000 मि॰से॰ का हार्डकोड किया गया NETWORK_TIMEOUT_MILLISECS इस्तेमाल किया जाता है.
सबसे ज़रूरी बात यह है कि यह while लूप के अंदर चलता है, जो 10 बार फिर से कोशिश करता है.
इस खास ट्रेस में, ऐसा हो सकता है कि उपयोगकर्ता के पास खराब इंटरनेट कनेक्शन हो. पहले तीन प्रयास विफल रहे, जिससे दो-दो सेकंड के तीन टाइमआउट (कुल छह सेकंड) हुए.
चौथी कोशिश 0.7 सेकंड के बाद सफल हुई. इससे कोड को handleNetworkResponse पर आगे बढ़ने की अनुमति मिली. हालांकि, इंतज़ार करने का कुल समय पहले ही एएनआर को ट्रिगर कर चुका है.
एएनआर की गड़बड़ी को ठीक करना
इस तरह के ANR से बचने के लिए, नेटवर्क से जुड़े ऐसे कामों को मुख्य थ्रेड पर चलाने के बजाय बैकग्राउंड थ्रेड पर चलाएं जिनमें अलग-अलग तरह की इंतज़ार की अवधि होती है. इससे खराब कनेक्टिविटी होने पर भी यूज़र इंटरफ़ेस (यूआई) रिस्पॉन्सिव रहता है. साथ ही, इस तरह के एएनआर नहीं होते.
एआई एजेंट की मदद से, एएनआर की जांच को ऑटोमेट करना
Perfetto यूज़र इंटरफ़ेस (यूआई) में टाइमलाइन और स्लीप इंटरवल की मैन्युअल तरीके से जांच करने के बजाय, Perfetto एआई स्किल के साथ कॉन्फ़िगर किए गए एआई कोडिंग एजेंट का इस्तेमाल किया जा सकता है. इससे एएनआर ट्रेस के बारे में क्वेरी की जा सकती है और उसे अपने कोड बेस से जोड़ा जा सकता है:
Analyze the Perfetto system trace at </path/to/trace.perfetto-trace>, which
corresponds to an ANR trace, and find the root cause of the ANR using the
Perfetto AI skill. The codebase is located at </path/to/codebase>.
एजेंट, trace_processor की मदद से ट्रेस की क्वेरी करता है और मैन्युअल तरीके से की गई जांच के नतीजे पर पहुंचता है. ट्रेस के आखिर में मौजूद handleNetworkResponse स्लाइस से गुमराह हुए बिना, एजेंट सही नतीजे पर पहुंचता है. इससे पता चलता है कि MyApp:SubmitButton ने मुख्य थ्रेड को 9.2 सेकंड से ज़्यादा समय तक ब्लॉक किया. साथ ही, performNetworkRequest में दो सेकंड के तीन नेटवर्क टाइम आउट और 0.7 सेकंड की चौथी कोशिश को फिर से बनाया. इसके अलावा, prepareNetworkRequest और handleNetworkResponse में सीपीयू के बिज़ी-वेट लूप को फिर से बनाया. साथ ही, हर फ़ेज़ को ProfilingManagerJavaSnippets.java पर मैप किया. इसके अलावा, onClickSubmit को यूज़र इंटरफ़ेस (यूआई) थ्रेड से हटाने का सुझाव दिया:
# Perfetto ANR Root-Cause Analysis Report

* **Source Code:** `ProfilingManagerJavaSnippets.java`
* **Target Process:** `com.example.sampleapp` (`pid = 32579`, `upid = 27`)
* **Blocked Thread:** Main UI thread `ample.sampleapp` (`tid = 32579`, `utid = 760`)
* **Collection Mechanism:** Android `ProfilingManager` (`ProfilingTrigger.TRIGGER_TYPE_ANR`)

---

## 1. Executive Summary

> **Important:** The ANR in `com.example.sampleapp` is caused by executing **synchronous, blocking network retry logic (`Thread.sleep`) and heavy CPU busy-wait loops (`cpuIntensiveComputation`) directly on the main UI thread** inside the submit button click listener (`MyApp:SubmitButton` -> `onClickSubmit()`).

When the user taps the submit button at `7,967.78 ms` into the trace (`ts = 80459171444519`), the main UI thread is blocked continuously for **more than `9,281.30 ms`** (still unfinished when the trace ends at `17,249.08 ms`):

1. **`prepareNetworkRequest()`** runs a CPU busy-wait loop on the main thread for **`~1,019 ms`**.
2. **`performNetworkRequest(2000)`** executes in a synchronous `while` retry loop on the main thread. Each attempt begins with **`20 ms`** of CPU busy-waiting followed by a `Thread.sleep()`. The request times out (`2,000 ms` sleep) **3 times in a row** and succeeds on the **4th attempt** (`~701 ms` sleep), blocking the main thread for **`~6,764 ms`** across the 4 attempts (`6,703.18 ms` sleeping + `~60 ms` CPU).
3. **`handleNetworkResponse()`** begins at **`+7,783.44 ms`** after the button click and runs another `2,000 ms` CPU busy-wait loop on the main thread (`1,497.86 ms` captured before the trace ends).

    [Touch UP & Click (t = +0 ms)]
      -> prepareNetworkRequest() (~1,000 ms CPU Busy-Wait)
      -> Attempt #1 (Timeout: 20 ms CPU + 2,001 ms Sleep)
      -> Attempt #2 (Timeout: 20 ms CPU + 2,001 ms Sleep)
      -> Attempt #3 (Timeout: 20 ms CPU + 2,001 ms Sleep, crosses 5s ANR threshold)
      -> Attempt #4 (Success: 20 ms CPU + 701 ms Sleep)
      -> handleNetworkResponse() (1,498 ms CPU, unfinished at trace end)
## 2. PerfettoSQL Trace Analysis

### 2.1 Open Main-Thread Slices at Trace End

Querying `thread_or_process_slice` on the main thread (`utid = 760`) around and after the touch event shows that `MyApp:SubmitButton` and its nested slice `handleNetworkResponse` both have `dur = -1` (still open when the trace completed):

```sql
INCLUDE PERFETTO MODULE slices.with_context;

SELECT
  id,
  ts,
  (ts - trace_start()) / 1e6 AS rel_ts_ms,
  dur,
  IIF(dur = -1, trace_end() - ts, dur) / 1e6 AS effective_dur_ms,
  depth,
  name
FROM thread_or_process_slice
WHERE utid = 760 AND ts >= 80459169800000
ORDER BY ts;
```

| Slice ID | Slice Name | Start (`ts` ns) | Offset from Trace Start | Raw `dur` | Effective Duration (to trace end) | Depth |
| :--- | :--- | :--- | :--- | :--- | :--- | :--- |
| `40070` | `dispatchInputEvent MotionEvent UP` | `80459169801575` | `7,966.14 ms` | `190,633 ns` | `0.19 ms` | `0` |
| `40156` | **`MyApp:SubmitButton`** | `80459171444519` | `7,967.78 ms` | `-1` | **`9,281.30 ms`** | `0` |
| `97500` | **`handleNetworkResponse`** | `80466954886580` | `15,751.23 ms` | `-1` | **`1,497.86 ms`** | `1` |

---

### 2.2 Aggregate Main-Thread State (`thread_state`) During `MyApp:SubmitButton`

Aggregating `thread_state` for `utid = 760` from the start of `MyApp:SubmitButton` (`ts >= 80459171444519`) to the end of the trace reveals that the main thread spent **72.3%** of the time sleeping (`S`) and **27.6%** actively spinning on CPU (`Running`):

```sql
SELECT
  state,
  COUNT(*) AS cnt,
  SUM(dur) / 1e6 AS total_dur_ms,
  MIN(dur) / 1e6 AS min_dur_ms,
  MAX(dur) / 1e6 AS max_dur_ms
FROM thread_state
WHERE utid = 760 AND ts >= 80459171444519
GROUP BY state
ORDER BY total_dur_ms DESC;
```

| Thread State | Interval Count | Total Duration | Min Duration | Max Duration | Cause in Code |
| :--- | :--- | :--- | :--- | :--- | :--- |
| **`S` (Sleeping)** | `4` | **`6,703.18 ms`** | `700.78 ms` | `2,000.82 ms` | 4 `Thread.sleep()` calls in `performNetworkRequest()` |
| **`Running` (On CPU)** | `20` | **`2,559.81 ms`** | `0.00 ms` | `578.77 ms` | Busy-wait `while` loops in `cpuIntensiveComputation()` |
| **`R` (Runnable)** | `20` | **`2.11 ms`** | `0.01 ms` | `1.21 ms` | Scheduler wakeups and brief preemptions |

---

### 2.3 Phase-by-Phase Reconstruction (`thread_state` Intervals)

Querying individual `thread_state` intervals (`dur > 2 ms`) shows the exact sequence of CPU bursts and sleeps on the main thread:

```sql
SELECT
  ts,
  (ts - 80459171444519) / 1e6 AS ms_since_submit,
  dur / 1e6 AS dur_ms,
  state
FROM thread_state
WHERE utid = 760 AND ts >= 80459171444519 AND dur > 2e6
ORDER BY ts;
```

| Phase | Offset from Submit (`ms_since_submit`) | State | Duration (`dur_ms`) | Corresponding Code Execution |
| :--- | :--- | :--- | :--- | :--- |
| **1. Request Prep + Attempt #1 CPU** | `+0.63 ms` -> `+1,019.36 ms` | `Running` | **`1,018.68 ms`** *(across 5 slices)* | `prepareNetworkRequest()` (`1,000 ms` CPU) + Attempt #1 `cpuIntensiveComputation(20)` |
| **2. Network Attempt #1 (Timeout)** | `+1,019.36 ms` -> `+3,020.18 ms` | `S` (Sleep) | **`2,000.82 ms`** | `performNetworkRequest(2000)` -> `Thread.sleep(2000)` (`return false`) |
| **3. Network Attempt #2 (CPU)** | `+3,020.23 ms` -> `+3,040.24 ms` | `Running` | **`20.00 ms`** | Attempt #2 `cpuIntensiveComputation(20)` |
| **4. Network Attempt #2 (Timeout)** | `+3,040.24 ms` -> `+5,041.01 ms` | `S` (Sleep) | **`2,000.78 ms`** | `performNetworkRequest(2000)` -> `Thread.sleep(2000)` (`return false`) -- **5s input ANR threshold crossed** |
| **5. Network Attempt #3 (CPU)** | `+5,041.06 ms` -> `+5,061.30 ms` | `Running` | **`20.11 ms`** *(8.05 + 7.93 + 4.14 ms)* | Attempt #3 `cpuIntensiveComputation(20)` |
| **6. Network Attempt #3 (Timeout)** | `+5,061.30 ms` -> `+7,062.09 ms` | `S` (Sleep) | **`2,000.80 ms`** | `performNetworkRequest(2000)` -> `Thread.sleep(2000)` (`return false`) |
| **7. Network Attempt #4 (CPU)** | `+7,062.15 ms` -> `+7,082.38 ms` | `Running` | **`20.22 ms`** | Attempt #4 `cpuIntensiveComputation(20)` |
| **8. Network Attempt #4 (Success)** | `+7,082.38 ms` -> `+7,783.16 ms` | `S` (Sleep) | **`700.78 ms`** | `performNetworkRequest(2000)` hits `Math.random() < 0.2`, sleeps `~700 ms`, `return true` |
| **9. Handle Response (CPU)** | `+7,783.21 ms` -> `+9,281.30 ms` | `Running` | **`1,479.68 ms`** *(across 6 slices)* | `handleNetworkResponse()` (`Trace.beginSection("handleNetworkResponse")` at `+7,783.44 ms`) runs `cpuIntensiveComputation(2000)` until trace ends |

---

## 3. Code Mapping (`ProfilingManagerJavaSnippets.java`)

In `ProfilingManagerJavaSnippets.java` (lines `38` and `158-221`), the `OnClickListener` for `R.id.submit` runs `onClickSubmit()` directly on the main UI thread:

```java
private static final int NETWORK_TIMEOUT_MILLISECS = 2000;

public void setupButtonCallback() {
  findViewById(R.id.submit).setOnClickListener(submitButtonView -> {
    Trace.beginSection("MyApp:SubmitButton");
    onClickSubmit();
    Trace.endSection();
  });
}

public void onClickSubmit() {
  // 1. Blocks main thread on CPU for 1,000 ms
  prepareNetworkRequest();

  // 2. Synchronous retry loop on main thread (up to 10 attempts * 2,020 ms = 20.2 seconds!)
  boolean networkRequestSuccess = false;
  int maxAttempts = 10;
  while (!networkRequestSuccess && maxAttempts > 0) {
    networkRequestSuccess = performNetworkRequest(NETWORK_TIMEOUT_MILLISECS);
    maxAttempts--;
  }

  // 3. Blocks main thread on CPU for another 2,000 ms
  if (networkRequestSuccess) {
    handleNetworkResponse();
  }
}

boolean performNetworkRequest(int timeoutMilliseconds) {
  cpuIntensiveComputation(20);
  try {
    if (Math.random() < 0.2) {
      // Simulate performing a network request by waiting a random period of time
      int networkRequestTimeMs = (int) (Math.random() * timeoutMilliseconds);
      Thread.sleep(networkRequestTimeMs);
      return true;
    } else {
      // Simulate a timeout
      Thread.sleep(timeoutMilliseconds);
    }
  } catch (InterruptedException e) {
  }
  return false;
}

void cpuIntensiveComputation(int durationMs) {
  long start = System.currentTimeMillis();
  while (System.currentTimeMillis() - start < durationMs) {
  }
}

void prepareNetworkRequest() {
  cpuIntensiveComputation(1000);
}

public void handleNetworkResponse() {
  Trace.beginSection("handleNetworkResponse");
  cpuIntensiveComputation(2000);
  Trace.endSection();
}
```

---

## 4. Recommended Remediation

> **Tip:** Never perform network I/O, `Thread.sleep()`, or multi-hundred-millisecond CPU computations on the Android main UI thread.

1. **Offload `onClickSubmit()` to a Background Thread / Coroutine:**
   * In Java, dispatch `prepareNetworkRequest()`, the `performNetworkRequest()` retry loop, and heavy response processing in `handleNetworkResponse()` to a background `ExecutorService` (e.g., `Executors.newSingleThreadExecutor()`), then marshal only lightweight UI updates back to the main thread via `runOnUiThread(...)` or `View.post(...)`.
   * In Kotlin, use `lifecycleScope.launch(Dispatchers.IO)` (for network waiting) and `withContext(Dispatchers.Default)` (for CPU-intensive preparation/parsing).
2. **Use Non-Blocking / Asynchronous Retries with Backoff:**
   * Avoid holding threads with `Thread.sleep()` inside tight retry loops; use asynchronous HTTP client timeouts/retries or `WorkManager` for deferrable background network tasks.