

หน้านี้จะอธิบายวิธีแก้ไขข้อบกพร่องของข้อผิดพลาดแอปพลิเคชันไม่ตอบสนอง (ANR) โดยใช้ ProfilingManager พร้อมตัวอย่างการติดตามของระบบ
ตั้งค่าแอปเพื่อรวบรวม ANR
เริ่มต้นด้วยการตั้งค่าทริกเกอร์ ANR ในแอป โดยทำดังนี้
Kotlin
fun addANRTrigger() { val profilingManager = applicationContext.getSystemService(ProfilingManager::class.java) ?: return val triggers = ArrayList<ProfilingTrigger>() val triggerBuilder = ProfilingTrigger.Builder(ProfilingTrigger.TRIGGER_TYPE_ANR) triggers.add(triggerBuilder.build()) val callbackExecutor: Executor = Executors.newSingleThreadExecutor() val resultCallback = Consumer<ProfilingResult> { profilingResult -> // Handle uploading trace to your back-end } profilingManager.registerForAllProfilingResults(callbackExecutor, resultCallback) profilingManager.addProfilingTriggers(triggers) }
Java
public void addANRTrigger() { ProfilingManager profilingManager = getApplicationContext().getSystemService( ProfilingManager.class); List<ProfilingTrigger> triggers = new ArrayList<>(); ProfilingTrigger.Builder triggerBuilder = new ProfilingTrigger.Builder( ProfilingTrigger.TRIGGER_TYPE_ANR); triggers.add(triggerBuilder.build()); Executor callbackExecutor = Executors.newSingleThreadExecutor(); Consumer<ProfilingResult> resultCallback = profilingResult -> { // Handle uploading trace to your back-end }; profilingManager.registerForAllProfilingResults(callbackExecutor, resultCallback); profilingManager.addProfilingTriggers(triggers); }
หลังจากบันทึกและอัปโหลดการติดตาม ANR แล้ว คุณสามารถตรวจสอบด้วยตนเองใน Perfetto UI ตามขั้นตอนต่อไปนี้ หรือตรวจสอบ ANR โดยอัตโนมัติด้วย AI Agent
วิเคราะห์การติดตาม
เนื่องจาก ANR ทริกเกอร์การติดตาม คุณจึงทราบว่าการติดตามสิ้นสุดลงเมื่อระบบตรวจพบว่าเธรดหลักของแอปไม่ตอบสนอง (หรือเมื่อเกิดการหมดเวลาอื่น) รูปที่ 1 แสดงวิธีไปยังเทรดหลักของแอป ซึ่งมีการติดแท็กตามนั้นภายใน UI
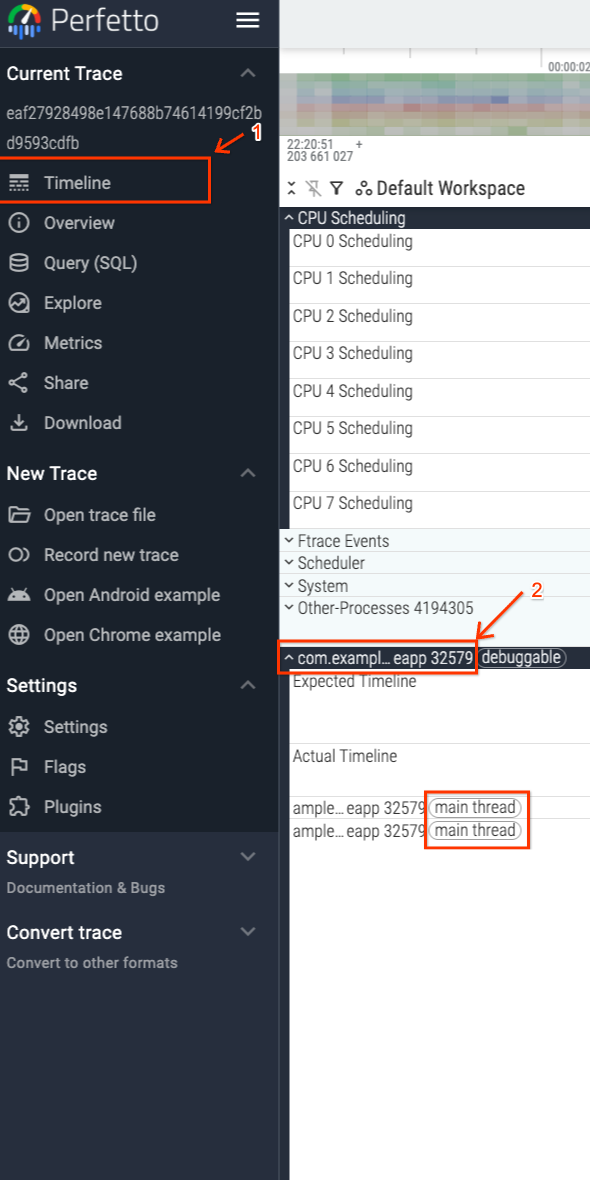
จุดสิ้นสุดของการติดตามจะตรงกับการประทับเวลาของ ANR ดังที่แสดงในรูปที่ 2

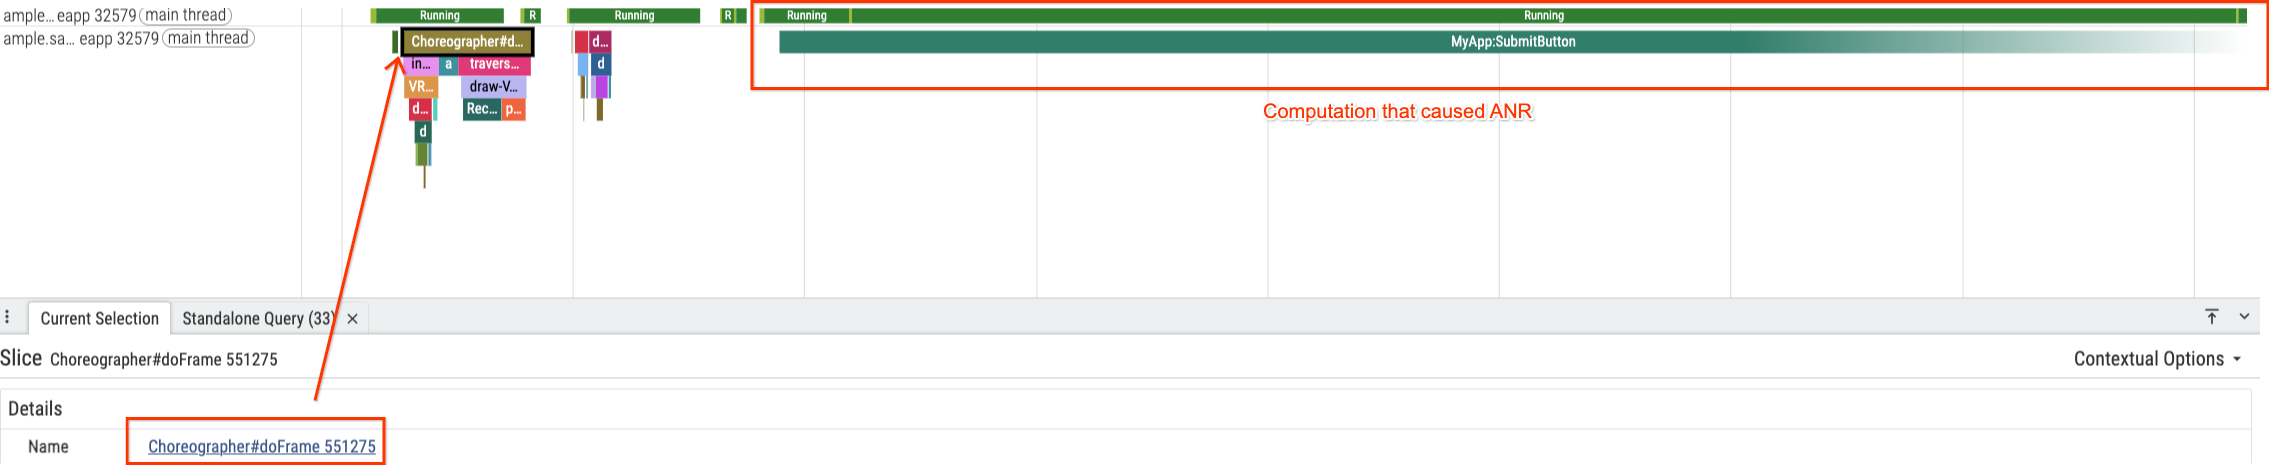
เมื่อเกิด ANR เธรดหลักกำลังเรียกใช้ส่วน handleNetworkResponse ภายใน MyApp:SubmitButton ซึ่งใช้เวลา CPU 1.48 วินาที (รูปที่ 3)

การอาศัยเพียงดัมพ์สแต็กที่สร้างขึ้น ณ ช่วงเวลาที่เกิด ANR อาจทำให้ระบุสาเหตุของการหยุดทำงานทั้งหมดเป็น handleNetworkResponse อย่างไม่ถูกต้อง อย่างไรก็ตาม 1.48 วินาทีนั้นไม่นานพอที่จะทำให้เกิด ANR ได้ด้วยตัวเอง คุณจึงต้องตรวจสอบสิ่งที่บล็อกเทรดหลักก่อนหน้านี้
เริ่มด้วยการค้นหาเฟรม UI สุดท้ายที่แสดงผลก่อนเกิดการค้าง (Choreographer#doFrame 551275) ซึ่งอยู่ก่อนส่วน MyApp:SubmitButton ทันที (รูปที่ 4)
หากต้องการทำความเข้าใจการบล็อก ให้ซูมออกเพื่อตรวจสอบส่วน MyApp:SubmitButton ทั้งหมด คุณจะเห็นรายละเอียดที่สำคัญในสถานะของชุดข้อความสำหรับช่วงที่เลือกด้วยตนเองในรูปที่ 5 นั่นคือชุดข้อความใช้เวลาประมาณ 75% (6.7 วินาที) ในสถานะ Sleeping และใช้เวลาเพียง 24% ในสถานะ Running
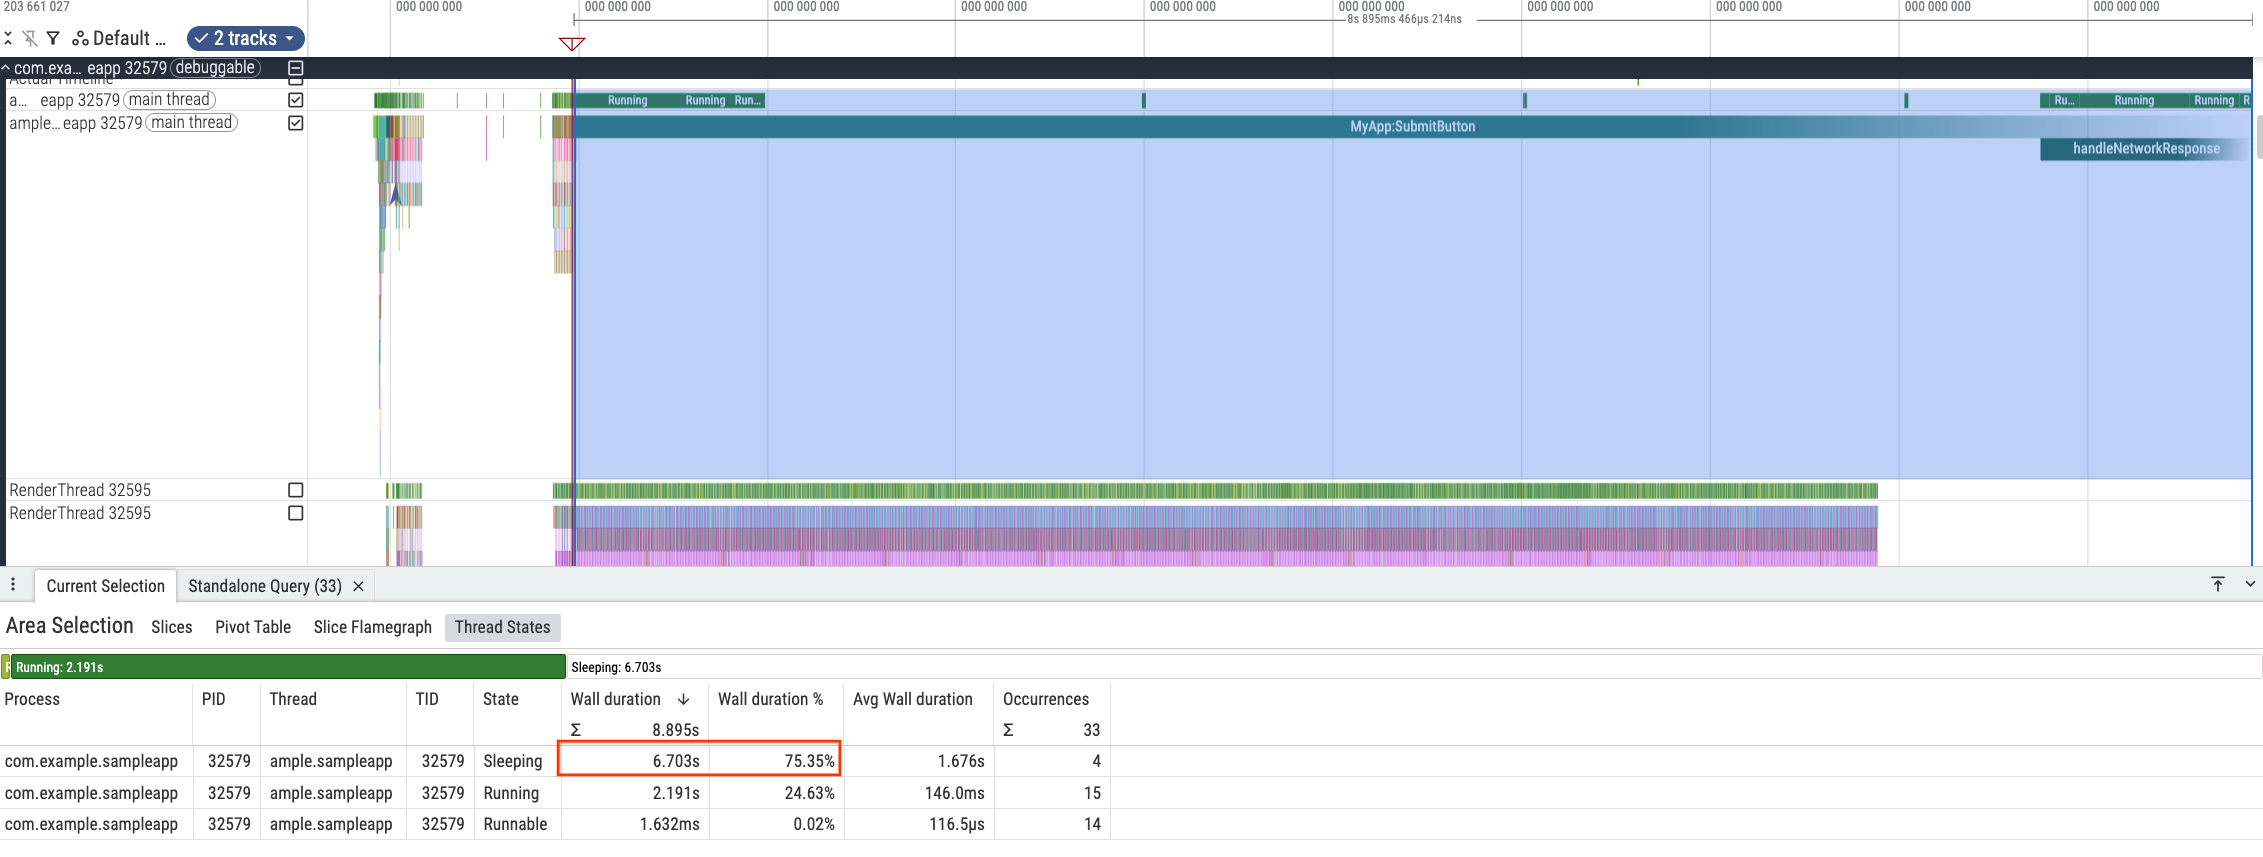
MyApp:SubmitButtonซึ่งบ่งชี้ว่าสาเหตุหลักของ ANR คือการรอ ไม่ใช่การประมวลผล ตรวจสอบการนอนหลับแต่ละครั้งเพื่อค้นหารูปแบบ

MyApp:SubmitButton
MyApp:SubmitButton
MyApp:SubmitButton
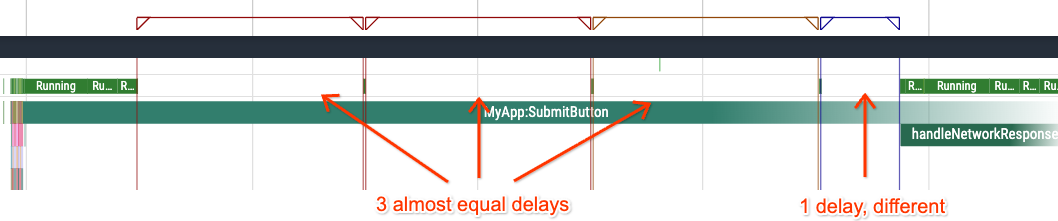
MyApp:SubmitButtonช่วงการพัก 3 ช่วงแรก (รูปที่ 6-8) จะใช้เวลาประมาณ 2 วินาทีต่อช่วง และช่วงที่ 4 (รูปที่ 9) จะใช้เวลา 0.7 วินาที การหยุดชั่วคราว 2 วินาทีซ้ำๆ บ่งชี้อย่างชัดเจนถึงการหมดเวลาที่ตั้งโปรแกรมไว้ซึ่งพยายามอีกครั้ง 3 ครั้งก่อนที่จะสำเร็จในการพยายามครั้งที่ 4 ซึ่งทำให้เกิดความล่าช้ามากพอที่จะทริกเกอร์ ANR (รูปที่ 10)
MyApp:SubmitButtonระบุสาเหตุของปัญหาในโค้ด
หากต้องการยืนยันสมมติฐานนี้ ให้ตรวจสอบโค้ดที่เชื่อมโยงกับส่วนการติดตาม MyApp:SubmitButton ดังนี้
Kotlin
fun setupButtonCallback() { findViewById<View>(R.id.submit).setOnClickListener { trace("MyApp:SubmitButton") { onClickSubmit() } } } fun onClickSubmit() { prepareNetworkRequest() var networkRequestSuccess = false var maxAttempts = 10 while (!networkRequestSuccess && maxAttempts > 0) { networkRequestSuccess = performNetworkRequest(NETWORK_TIMEOUT_MILLISECS) maxAttempts-- } if (networkRequestSuccess) { handleNetworkResponse() } } fun performNetworkRequest(timeoutMilliseconds: Int): Boolean { // ... } fun prepareNetworkRequest() { // ... } fun handleNetworkResponse() { trace("handleNetworkResponse") { // ... } } companion object { private const val NETWORK_TIMEOUT_MILLISECS = 2000 }
Java
private static final int NETWORK_TIMEOUT_MILLISECS = 2000; public void setupButtonCallback() { findViewById(R.id.submit).setOnClickListener(submitButtonView -> { Trace.beginSection("MyApp:SubmitButton"); onClickSubmit(); Trace.endSection(); }); } public void onClickSubmit() { prepareNetworkRequest(); boolean networkRequestSuccess = false; int maxAttempts = 10; while (!networkRequestSuccess && maxAttempts > 0) { networkRequestSuccess = performNetworkRequest(NETWORK_TIMEOUT_MILLISECS); maxAttempts--; } if (networkRequestSuccess) { handleNetworkResponse(); } } boolean performNetworkRequest(int timeoutMiliseconds) { // ... } void prepareNetworkRequest() { // ... } public void handleNetworkResponse() { Trace.beginSection("handleNetworkResponse"); // ... Trace.endSection(); }
โค้ดนี้ยืนยันสมมติฐานนี้ เมธอด onClickSubmit ดำเนินการคำขอ
เครือข่ายในเธรด UI โดยมี NETWORK_TIMEOUT_MILLISECS ที่ฮาร์ดโค้ดไว้เป็น 2,000 มิลลิวินาที
ที่สำคัญคือโค้ดนี้จะทำงานภายในลูป while ที่จะลองใหม่สูงสุด 10 ครั้ง
ในร่องรอยที่เฉพาะเจาะจงนี้ ผู้ใช้น่าจะมีการเชื่อมต่อเครือข่ายที่ไม่ดี การพยายาม 3 ครั้งแรกไม่สำเร็จ ทำให้เกิดการหมดเวลา 2 วินาที 3 ครั้ง (รวมเป็น 6 วินาที)
การพยายามครั้งที่ 4 สำเร็จหลังจากผ่านไป 0.7 วินาที ทำให้โค้ดดำเนินการต่อได้ที่ handleNetworkResponse อย่างไรก็ตาม เวลารอที่สะสมได้ทริกเกอร์ ANR แล้ว
แก้ไข ANR
หลีกเลี่ยง ANR ประเภทนี้โดยย้ายการดำเนินการที่เกี่ยวข้องกับเครือข่ายซึ่งมีเวลาในการตอบสนองแตกต่างกันไปยังเทรดเบื้องหลังแทนที่จะดำเนินการในเทรดหลัก ซึ่งจะช่วยให้ UI ตอบสนองได้แม้จะมีการเชื่อมต่อที่ไม่ดี และช่วยขจัด ANR ประเภทนี้
ตรวจสอบ ANR โดยอัตโนมัติด้วย AI Agent
แทนที่จะตรวจสอบไทม์ไลน์และช่วงพักด้วยตนเองใน Perfetto UI คุณสามารถใช้ Agent การเขียนโค้ด AI ที่กำหนดค่าด้วยทักษะ Perfetto AI เพื่อค้นหาการติดตาม ANR และเชื่อมโยงกับการฐานของโค้ดได้
Analyze the Perfetto system trace at </path/to/trace.perfetto-trace>, which
corresponds to an ANR trace, and find the root cause of the ANR using the
Perfetto AI skill. The codebase is located at </path/to/codebase>.
Agent จะค้นหาการติดตามด้วย trace_processor และได้ข้อสรุปเดียวกันกับการตรวจสอบด้วยตนเอง โดยไม่ถูกหลอกโดยส่วน handleNetworkResponse ที่ยังไม่เสร็จสิ้นที่ส่วนท้ายของการติดตาม โดยระบุว่า MyApp:SubmitButton บล็อกเธรดหลักเป็นเวลานานกว่า 9.2 วินาที สร้างการหมดเวลาของเครือข่าย 2 วินาที 3 ครั้ง และการพยายามครั้งที่ 4 เป็นเวลา 0.7 วินาทีใน performNetworkRequest ควบคู่ไปกับลูป Busy-Wait ของ CPU ใน prepareNetworkRequest และ handleNetworkResponse และแมปแต่ละระยะกับ ProfilingManagerJavaSnippets.java พร้อมคำแนะนำให้ย้าย onClickSubmit ออกจากเธรด UI ดังนี้
# Perfetto ANR Root-Cause Analysis Report

* **Source Code:** `ProfilingManagerJavaSnippets.java`
* **Target Process:** `com.example.sampleapp` (`pid = 32579`, `upid = 27`)
* **Blocked Thread:** Main UI thread `ample.sampleapp` (`tid = 32579`, `utid = 760`)
* **Collection Mechanism:** Android `ProfilingManager` (`ProfilingTrigger.TRIGGER_TYPE_ANR`)

---

## 1. Executive Summary

> **Important:** The ANR in `com.example.sampleapp` is caused by executing **synchronous, blocking network retry logic (`Thread.sleep`) and heavy CPU busy-wait loops (`cpuIntensiveComputation`) directly on the main UI thread** inside the submit button click listener (`MyApp:SubmitButton` -> `onClickSubmit()`).

When the user taps the submit button at `7,967.78 ms` into the trace (`ts = 80459171444519`), the main UI thread is blocked continuously for **more than `9,281.30 ms`** (still unfinished when the trace ends at `17,249.08 ms`):

1. **`prepareNetworkRequest()`** runs a CPU busy-wait loop on the main thread for **`~1,019 ms`**.
2. **`performNetworkRequest(2000)`** executes in a synchronous `while` retry loop on the main thread. Each attempt begins with **`20 ms`** of CPU busy-waiting followed by a `Thread.sleep()`. The request times out (`2,000 ms` sleep) **3 times in a row** and succeeds on the **4th attempt** (`~701 ms` sleep), blocking the main thread for **`~6,764 ms`** across the 4 attempts (`6,703.18 ms` sleeping + `~60 ms` CPU).
3. **`handleNetworkResponse()`** begins at **`+7,783.44 ms`** after the button click and runs another `2,000 ms` CPU busy-wait loop on the main thread (`1,497.86 ms` captured before the trace ends).

    [Touch UP & Click (t = +0 ms)]
      -> prepareNetworkRequest() (~1,000 ms CPU Busy-Wait)
      -> Attempt #1 (Timeout: 20 ms CPU + 2,001 ms Sleep)
      -> Attempt #2 (Timeout: 20 ms CPU + 2,001 ms Sleep)
      -> Attempt #3 (Timeout: 20 ms CPU + 2,001 ms Sleep, crosses 5s ANR threshold)
      -> Attempt #4 (Success: 20 ms CPU + 701 ms Sleep)
      -> handleNetworkResponse() (1,498 ms CPU, unfinished at trace end)
## 2. PerfettoSQL Trace Analysis

### 2.1 Open Main-Thread Slices at Trace End

Querying `thread_or_process_slice` on the main thread (`utid = 760`) around and after the touch event shows that `MyApp:SubmitButton` and its nested slice `handleNetworkResponse` both have `dur = -1` (still open when the trace completed):

```sql
INCLUDE PERFETTO MODULE slices.with_context;

SELECT
  id,
  ts,
  (ts - trace_start()) / 1e6 AS rel_ts_ms,
  dur,
  IIF(dur = -1, trace_end() - ts, dur) / 1e6 AS effective_dur_ms,
  depth,
  name
FROM thread_or_process_slice
WHERE utid = 760 AND ts >= 80459169800000
ORDER BY ts;
```

| Slice ID | Slice Name | Start (`ts` ns) | Offset from Trace Start | Raw `dur` | Effective Duration (to trace end) | Depth |
| :--- | :--- | :--- | :--- | :--- | :--- | :--- |
| `40070` | `dispatchInputEvent MotionEvent UP` | `80459169801575` | `7,966.14 ms` | `190,633 ns` | `0.19 ms` | `0` |
| `40156` | **`MyApp:SubmitButton`** | `80459171444519` | `7,967.78 ms` | `-1` | **`9,281.30 ms`** | `0` |
| `97500` | **`handleNetworkResponse`** | `80466954886580` | `15,751.23 ms` | `-1` | **`1,497.86 ms`** | `1` |

---

### 2.2 Aggregate Main-Thread State (`thread_state`) During `MyApp:SubmitButton`

Aggregating `thread_state` for `utid = 760` from the start of `MyApp:SubmitButton` (`ts >= 80459171444519`) to the end of the trace reveals that the main thread spent **72.3%** of the time sleeping (`S`) and **27.6%** actively spinning on CPU (`Running`):

```sql
SELECT
  state,
  COUNT(*) AS cnt,
  SUM(dur) / 1e6 AS total_dur_ms,
  MIN(dur) / 1e6 AS min_dur_ms,
  MAX(dur) / 1e6 AS max_dur_ms
FROM thread_state
WHERE utid = 760 AND ts >= 80459171444519
GROUP BY state
ORDER BY total_dur_ms DESC;
```

| Thread State | Interval Count | Total Duration | Min Duration | Max Duration | Cause in Code |
| :--- | :--- | :--- | :--- | :--- | :--- |
| **`S` (Sleeping)** | `4` | **`6,703.18 ms`** | `700.78 ms` | `2,000.82 ms` | 4 `Thread.sleep()` calls in `performNetworkRequest()` |
| **`Running` (On CPU)** | `20` | **`2,559.81 ms`** | `0.00 ms` | `578.77 ms` | Busy-wait `while` loops in `cpuIntensiveComputation()` |
| **`R` (Runnable)** | `20` | **`2.11 ms`** | `0.01 ms` | `1.21 ms` | Scheduler wakeups and brief preemptions |

---

### 2.3 Phase-by-Phase Reconstruction (`thread_state` Intervals)

Querying individual `thread_state` intervals (`dur > 2 ms`) shows the exact sequence of CPU bursts and sleeps on the main thread:

```sql
SELECT
  ts,
  (ts - 80459171444519) / 1e6 AS ms_since_submit,
  dur / 1e6 AS dur_ms,
  state
FROM thread_state
WHERE utid = 760 AND ts >= 80459171444519 AND dur > 2e6
ORDER BY ts;
```

| Phase | Offset from Submit (`ms_since_submit`) | State | Duration (`dur_ms`) | Corresponding Code Execution |
| :--- | :--- | :--- | :--- | :--- |
| **1. Request Prep + Attempt #1 CPU** | `+0.63 ms` -> `+1,019.36 ms` | `Running` | **`1,018.68 ms`** *(across 5 slices)* | `prepareNetworkRequest()` (`1,000 ms` CPU) + Attempt #1 `cpuIntensiveComputation(20)` |
| **2. Network Attempt #1 (Timeout)** | `+1,019.36 ms` -> `+3,020.18 ms` | `S` (Sleep) | **`2,000.82 ms`** | `performNetworkRequest(2000)` -> `Thread.sleep(2000)` (`return false`) |
| **3. Network Attempt #2 (CPU)** | `+3,020.23 ms` -> `+3,040.24 ms` | `Running` | **`20.00 ms`** | Attempt #2 `cpuIntensiveComputation(20)` |
| **4. Network Attempt #2 (Timeout)** | `+3,040.24 ms` -> `+5,041.01 ms` | `S` (Sleep) | **`2,000.78 ms`** | `performNetworkRequest(2000)` -> `Thread.sleep(2000)` (`return false`) -- **5s input ANR threshold crossed** |
| **5. Network Attempt #3 (CPU)** | `+5,041.06 ms` -> `+5,061.30 ms` | `Running` | **`20.11 ms`** *(8.05 + 7.93 + 4.14 ms)* | Attempt #3 `cpuIntensiveComputation(20)` |
| **6. Network Attempt #3 (Timeout)** | `+5,061.30 ms` -> `+7,062.09 ms` | `S` (Sleep) | **`2,000.80 ms`** | `performNetworkRequest(2000)` -> `Thread.sleep(2000)` (`return false`) |
| **7. Network Attempt #4 (CPU)** | `+7,062.15 ms` -> `+7,082.38 ms` | `Running` | **`20.22 ms`** | Attempt #4 `cpuIntensiveComputation(20)` |
| **8. Network Attempt #4 (Success)** | `+7,082.38 ms` -> `+7,783.16 ms` | `S` (Sleep) | **`700.78 ms`** | `performNetworkRequest(2000)` hits `Math.random() < 0.2`, sleeps `~700 ms`, `return true` |
| **9. Handle Response (CPU)** | `+7,783.21 ms` -> `+9,281.30 ms` | `Running` | **`1,479.68 ms`** *(across 6 slices)* | `handleNetworkResponse()` (`Trace.beginSection("handleNetworkResponse")` at `+7,783.44 ms`) runs `cpuIntensiveComputation(2000)` until trace ends |

---

## 3. Code Mapping (`ProfilingManagerJavaSnippets.java`)

In `ProfilingManagerJavaSnippets.java` (lines `38` and `158-221`), the `OnClickListener` for `R.id.submit` runs `onClickSubmit()` directly on the main UI thread:

```java
private static final int NETWORK_TIMEOUT_MILLISECS = 2000;

public void setupButtonCallback() {
  findViewById(R.id.submit).setOnClickListener(submitButtonView -> {
    Trace.beginSection("MyApp:SubmitButton");
    onClickSubmit();
    Trace.endSection();
  });
}

public void onClickSubmit() {
  // 1. Blocks main thread on CPU for 1,000 ms
  prepareNetworkRequest();

  // 2. Synchronous retry loop on main thread (up to 10 attempts * 2,020 ms = 20.2 seconds!)
  boolean networkRequestSuccess = false;
  int maxAttempts = 10;
  while (!networkRequestSuccess && maxAttempts > 0) {
    networkRequestSuccess = performNetworkRequest(NETWORK_TIMEOUT_MILLISECS);
    maxAttempts--;
  }

  // 3. Blocks main thread on CPU for another 2,000 ms
  if (networkRequestSuccess) {
    handleNetworkResponse();
  }
}

boolean performNetworkRequest(int timeoutMilliseconds) {
  cpuIntensiveComputation(20);
  try {
    if (Math.random() < 0.2) {
      // Simulate performing a network request by waiting a random period of time
      int networkRequestTimeMs = (int) (Math.random() * timeoutMilliseconds);
      Thread.sleep(networkRequestTimeMs);
      return true;
    } else {
      // Simulate a timeout
      Thread.sleep(timeoutMilliseconds);
    }
  } catch (InterruptedException e) {
  }
  return false;
}

void cpuIntensiveComputation(int durationMs) {
  long start = System.currentTimeMillis();
  while (System.currentTimeMillis() - start < durationMs) {
  }
}

void prepareNetworkRequest() {
  cpuIntensiveComputation(1000);
}

public void handleNetworkResponse() {
  Trace.beginSection("handleNetworkResponse");
  cpuIntensiveComputation(2000);
  Trace.endSection();
}
```

---

## 4. Recommended Remediation

> **Tip:** Never perform network I/O, `Thread.sleep()`, or multi-hundred-millisecond CPU computations on the Android main UI thread.

1. **Offload `onClickSubmit()` to a Background Thread / Coroutine:**
   * In Java, dispatch `prepareNetworkRequest()`, the `performNetworkRequest()` retry loop, and heavy response processing in `handleNetworkResponse()` to a background `ExecutorService` (e.g., `Executors.newSingleThreadExecutor()`), then marshal only lightweight UI updates back to the main thread via `runOnUiThread(...)` or `View.post(...)`.
   * In Kotlin, use `lifecycleScope.launch(Dispatchers.IO)` (for network waiting) and `withContext(Dispatchers.Default)` (for CPU-intensive preparation/parsing).
2. **Use Non-Blocking / Asynchronous Retries with Backoff:**
   * Avoid holding threads with `Thread.sleep()` inside tight retry loops; use asynchronous HTTP client timeouts/retries or `WorkManager` for deferrable background network tasks.