

En esta página, se explica cómo depurar un error de Aplicación no responde (ANR) con ProfilingManager con un seguimiento del sistema de ejemplo.
Configura la app para recopilar ANR
Para comenzar, configura un activador de ANR en tu app:
Kotlin
fun addANRTrigger() { val profilingManager = applicationContext.getSystemService(ProfilingManager::class.java) ?: return val triggers = ArrayList<ProfilingTrigger>() val triggerBuilder = ProfilingTrigger.Builder(ProfilingTrigger.TRIGGER_TYPE_ANR) triggers.add(triggerBuilder.build()) val callbackExecutor: Executor = Executors.newSingleThreadExecutor() val resultCallback = Consumer<ProfilingResult> { profilingResult -> // Handle uploading trace to your back-end } profilingManager.registerForAllProfilingResults(callbackExecutor, resultCallback) profilingManager.addProfilingTriggers(triggers) }
Java
public void addANRTrigger() { ProfilingManager profilingManager = getApplicationContext().getSystemService( ProfilingManager.class); List<ProfilingTrigger> triggers = new ArrayList<>(); ProfilingTrigger.Builder triggerBuilder = new ProfilingTrigger.Builder( ProfilingTrigger.TRIGGER_TYPE_ANR); triggers.add(triggerBuilder.build()); Executor callbackExecutor = Executors.newSingleThreadExecutor(); Consumer<ProfilingResult> resultCallback = profilingResult -> { // Handle uploading trace to your back-end }; profilingManager.registerForAllProfilingResults(callbackExecutor, resultCallback); profilingManager.addProfilingTriggers(triggers); }
Después de capturar y subir un registro de ANR, puedes inspeccionarlo de forma manual en la IU de Perfetto como se muestra en los siguientes pasos, o automatizar la investigación de ANR con un agente de IA.
Analiza el seguimiento
Como el error de ANR activó el registro, sabes que este finalizó cuando el sistema detectó que el subproceso principal de tu app no respondía (o cuando se produjo otro tiempo de espera). En la figura 1, se muestra cómo navegar al subproceso principal de tu app, que está etiquetado de forma correspondiente dentro de la IU.

El final del seguimiento coincide con la marca de tiempo del error de ANR, como se muestra en la Figura 2.
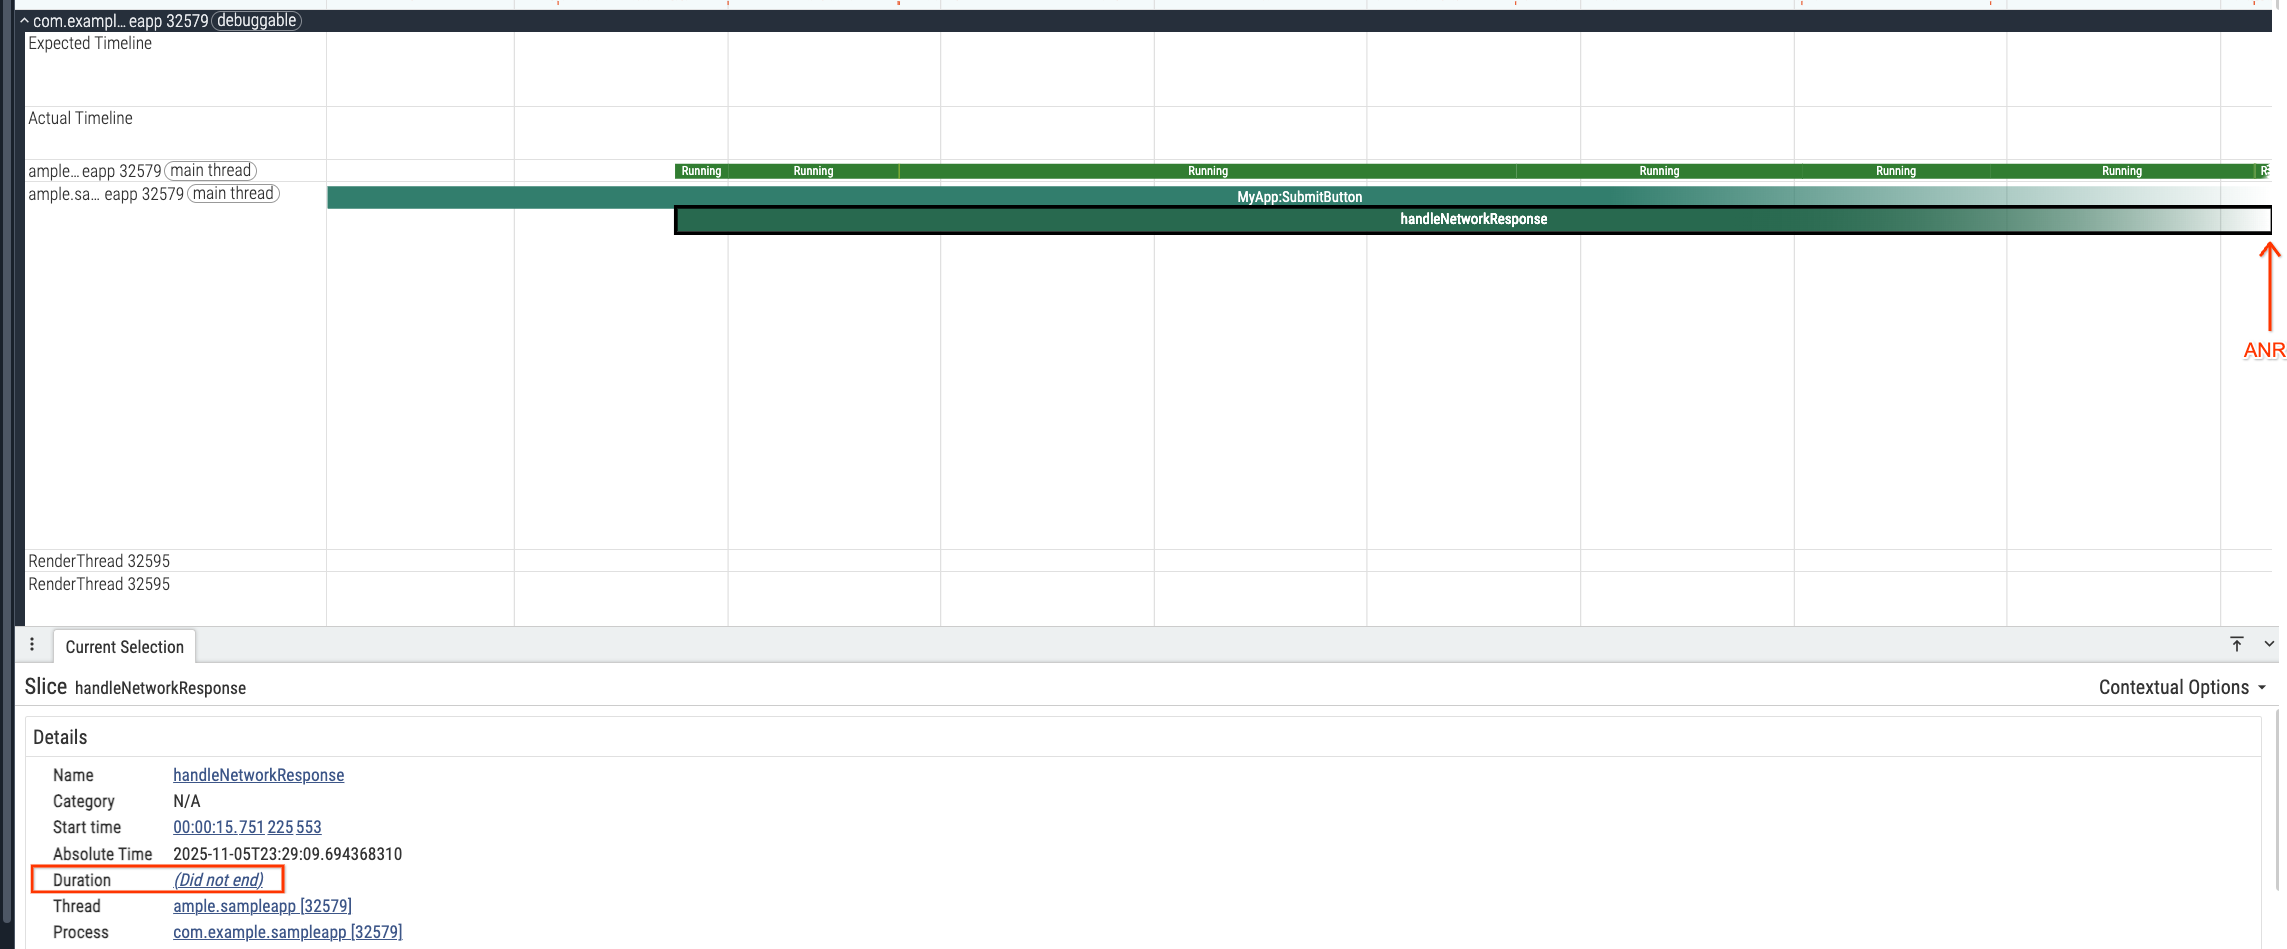
Cuando se produjo el error de ANR, el subproceso principal estaba ejecutando la porción handleNetworkResponse dentro de MyApp:SubmitButton, que consumió 1.48 segundos de tiempo de CPU (figura 3).

Si solo se utiliza un volcado de pila tomado en el momento del error de ANR, es posible que se atribuya incorrectamente el bloqueo por completo a handleNetworkResponse. Sin embargo, 1.48 segundos no es suficiente para activar un error de ANR, por lo que debes inspeccionar qué bloqueó el subproceso principal antes.
Para comenzar, busca el último fotograma de la IU renderizado antes de la inmovilización (Choreographer#doFrame 551275), que precede inmediatamente al segmento MyApp:SubmitButton (figura 4).
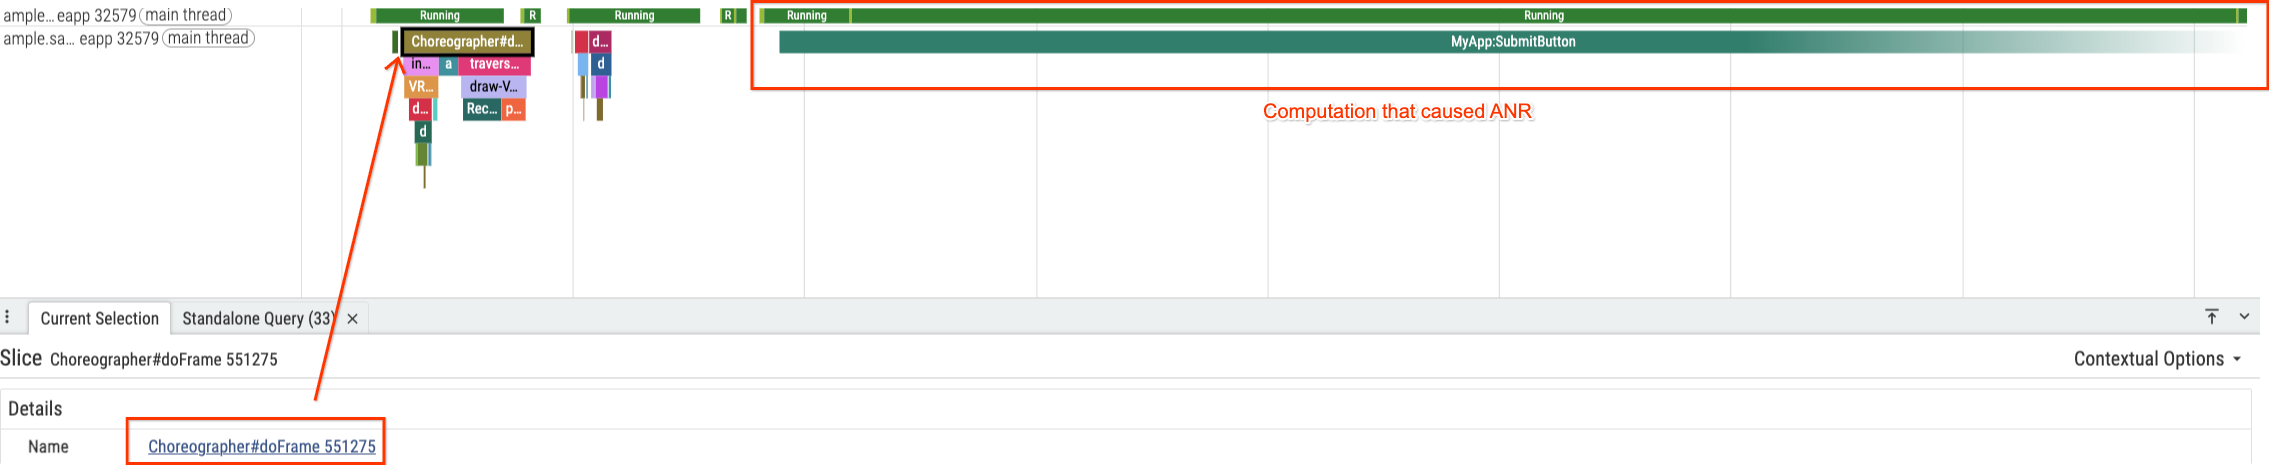
Para comprender el bloqueo, aleja la imagen y, luego, inspecciona el segmento MyApp:SubmitButton
completo. Notarás un detalle crítico en los estados de los subprocesos para el rango seleccionado de forma manual en la Figura 5: el subproceso pasó aproximadamente el 75% del tiempo (6.7 segundos) en el estado Sleeping y solo el 24% del tiempo en el estado Running.
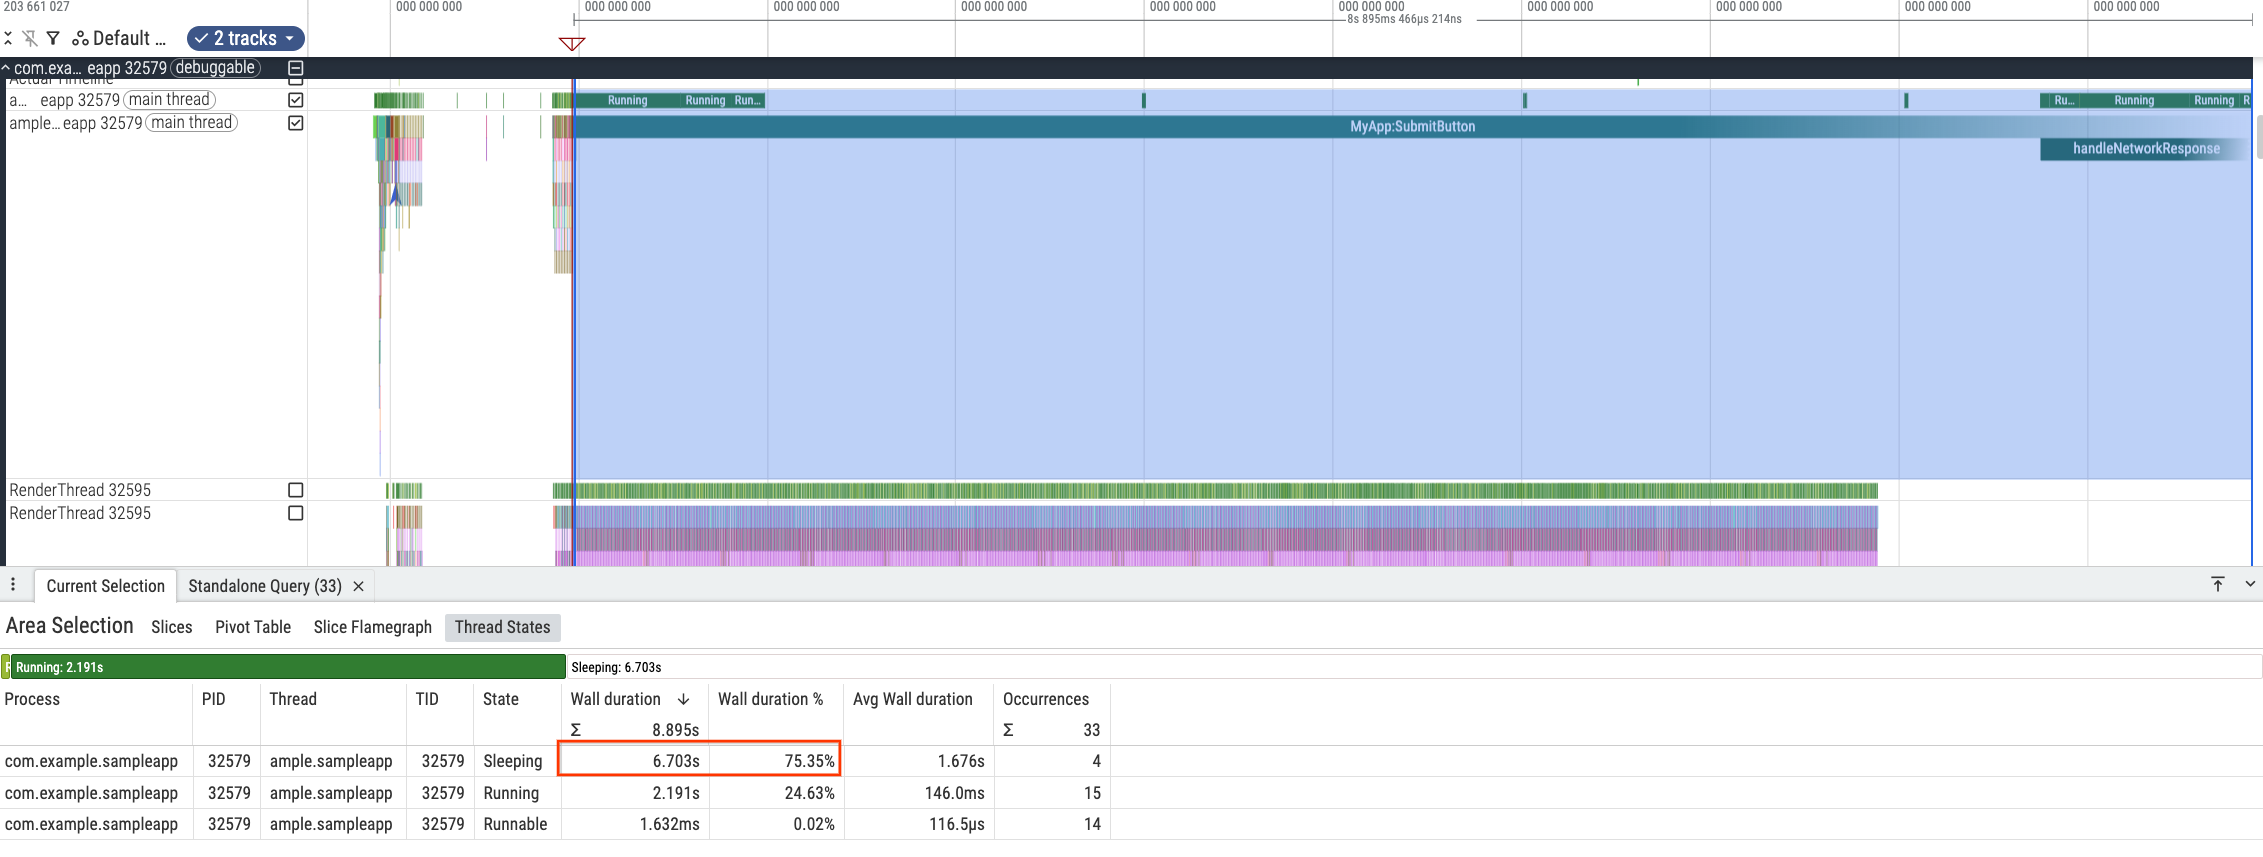
MyApp:SubmitButton.Esto indica que la causa principal del error de ANR fue la espera, no el procesamiento. Examina los eventos de sueño individuales para encontrar un patrón.

MyApp:SubmitButton.
MyApp:SubmitButton.
MyApp:SubmitButton.
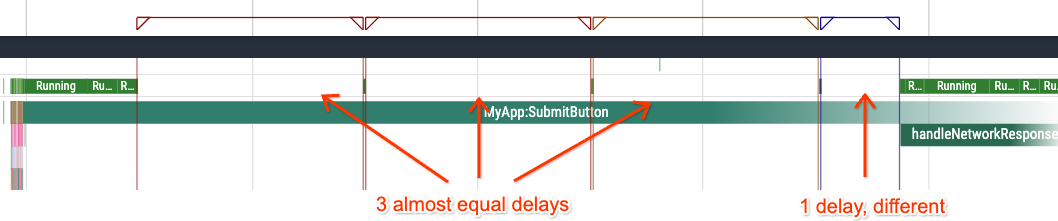
MyApp:SubmitButton.Los primeros tres intervalos de suspensión (figuras 6 a 8) son de aproximadamente 2 segundos cada uno, y el cuarto intervalo (figura 9) es de 0.7 segundos. Las pausas repetidas de 2 segundos sugieren con fuerza un tiempo de espera programado que se reintentó tres veces antes de tener éxito en el cuarto intento, lo que acumuló suficiente retraso para activar un error de ANR (figura 10).
MyApp:SubmitButton.Identifica la causa raíz en el código
Para verificar esta hipótesis, inspecciona el código asociado con la sección de seguimiento MyApp:SubmitButton:
Kotlin
fun setupButtonCallback() { findViewById<View>(R.id.submit).setOnClickListener { trace("MyApp:SubmitButton") { onClickSubmit() } } } fun onClickSubmit() { prepareNetworkRequest() var networkRequestSuccess = false var maxAttempts = 10 while (!networkRequestSuccess && maxAttempts > 0) { networkRequestSuccess = performNetworkRequest(NETWORK_TIMEOUT_MILLISECS) maxAttempts-- } if (networkRequestSuccess) { handleNetworkResponse() } } fun performNetworkRequest(timeoutMilliseconds: Int): Boolean { // ... } fun prepareNetworkRequest() { // ... } fun handleNetworkResponse() { trace("handleNetworkResponse") { // ... } } companion object { private const val NETWORK_TIMEOUT_MILLISECS = 2000 }
Java
private static final int NETWORK_TIMEOUT_MILLISECS = 2000; public void setupButtonCallback() { findViewById(R.id.submit).setOnClickListener(submitButtonView -> { Trace.beginSection("MyApp:SubmitButton"); onClickSubmit(); Trace.endSection(); }); } public void onClickSubmit() { prepareNetworkRequest(); boolean networkRequestSuccess = false; int maxAttempts = 10; while (!networkRequestSuccess && maxAttempts > 0) { networkRequestSuccess = performNetworkRequest(NETWORK_TIMEOUT_MILLISECS); maxAttempts--; } if (networkRequestSuccess) { handleNetworkResponse(); } } boolean performNetworkRequest(int timeoutMiliseconds) { // ... } void prepareNetworkRequest() { // ... } public void handleNetworkResponse() { Trace.beginSection("handleNetworkResponse"); // ... Trace.endSection(); }
El código confirma esta hipótesis. El método onClickSubmit ejecuta una solicitud de red en el subproceso de IU con un NETWORK_TIMEOUT_MILLISECS codificado de 2,000 ms.
Es fundamental que se ejecute dentro de un bucle while que reintente hasta 10 veces.
En este seguimiento específico, es probable que el usuario haya tenido una mala conectividad de red. Los primeros
tres intentos fallaron, lo que causó tres tiempos de espera de 2 segundos (un total de 6 segundos).
El cuarto intento se realizó correctamente después de 0.7 segundos, lo que permitió que el código continuara con
handleNetworkResponse. Sin embargo, el tiempo de espera acumulado ya activó el error de ANR.
Corrige el error de ANR
Para evitar este tipo de ANR, mueve las operaciones relacionadas con la red que tienen latencias variables a un subproceso en segundo plano en lugar de ejecutarlas en el subproceso principal. Esto mantiene la IU responsiva incluso con una conectividad deficiente, lo que elimina esta clase de ANR.
Automatiza la investigación de ANR con un agente de IA
En lugar de inspeccionar manualmente los cronogramas y los intervalos de suspensión en la IU de Perfetto, puedes usar un agente de programación de IA configurado con la habilidad de IA de Perfetto para consultar el seguimiento de ANR y correlacionarlo con tu base de código:
Analyze the Perfetto system trace at </path/to/trace.perfetto-trace>, which
corresponds to an ANR trace, and find the root cause of the ANR using the
Perfetto AI skill. The codebase is located at </path/to/codebase>.
El agente consulta el seguimiento con trace_processor y llega a la misma
conclusión que la investigación manual, sin dejarse engañar por la porción de handleNetworkResponse
sin terminar al final del seguimiento. Identifica que
MyApp:SubmitButton bloqueó el subproceso principal durante más de 9.2 segundos, reconstruye
los tres tiempos de espera de red de 2 segundos y el cuarto intento de 0.7 segundos en
performNetworkRequest junto con los bucles de espera ocupada de la CPU en
prepareNetworkRequest y handleNetworkResponse, y asigna cada fase a
ProfilingManagerJavaSnippets.java con una recomendación para mover
onClickSubmit fuera del subproceso de IU:
# Perfetto ANR Root-Cause Analysis Report

* **Source Code:** `ProfilingManagerJavaSnippets.java`
* **Target Process:** `com.example.sampleapp` (`pid = 32579`, `upid = 27`)
* **Blocked Thread:** Main UI thread `ample.sampleapp` (`tid = 32579`, `utid = 760`)
* **Collection Mechanism:** Android `ProfilingManager` (`ProfilingTrigger.TRIGGER_TYPE_ANR`)

---

## 1. Executive Summary

> **Important:** The ANR in `com.example.sampleapp` is caused by executing **synchronous, blocking network retry logic (`Thread.sleep`) and heavy CPU busy-wait loops (`cpuIntensiveComputation`) directly on the main UI thread** inside the submit button click listener (`MyApp:SubmitButton` -> `onClickSubmit()`).

When the user taps the submit button at `7,967.78 ms` into the trace (`ts = 80459171444519`), the main UI thread is blocked continuously for **more than `9,281.30 ms`** (still unfinished when the trace ends at `17,249.08 ms`):

1. **`prepareNetworkRequest()`** runs a CPU busy-wait loop on the main thread for **`~1,019 ms`**.
2. **`performNetworkRequest(2000)`** executes in a synchronous `while` retry loop on the main thread. Each attempt begins with **`20 ms`** of CPU busy-waiting followed by a `Thread.sleep()`. The request times out (`2,000 ms` sleep) **3 times in a row** and succeeds on the **4th attempt** (`~701 ms` sleep), blocking the main thread for **`~6,764 ms`** across the 4 attempts (`6,703.18 ms` sleeping + `~60 ms` CPU).
3. **`handleNetworkResponse()`** begins at **`+7,783.44 ms`** after the button click and runs another `2,000 ms` CPU busy-wait loop on the main thread (`1,497.86 ms` captured before the trace ends).

    [Touch UP & Click (t = +0 ms)]
      -> prepareNetworkRequest() (~1,000 ms CPU Busy-Wait)
      -> Attempt #1 (Timeout: 20 ms CPU + 2,001 ms Sleep)
      -> Attempt #2 (Timeout: 20 ms CPU + 2,001 ms Sleep)
      -> Attempt #3 (Timeout: 20 ms CPU + 2,001 ms Sleep, crosses 5s ANR threshold)
      -> Attempt #4 (Success: 20 ms CPU + 701 ms Sleep)
      -> handleNetworkResponse() (1,498 ms CPU, unfinished at trace end)
## 2. PerfettoSQL Trace Analysis

### 2.1 Open Main-Thread Slices at Trace End

Querying `thread_or_process_slice` on the main thread (`utid = 760`) around and after the touch event shows that `MyApp:SubmitButton` and its nested slice `handleNetworkResponse` both have `dur = -1` (still open when the trace completed):

```sql
INCLUDE PERFETTO MODULE slices.with_context;

SELECT
  id,
  ts,
  (ts - trace_start()) / 1e6 AS rel_ts_ms,
  dur,
  IIF(dur = -1, trace_end() - ts, dur) / 1e6 AS effective_dur_ms,
  depth,
  name
FROM thread_or_process_slice
WHERE utid = 760 AND ts >= 80459169800000
ORDER BY ts;
```

| Slice ID | Slice Name | Start (`ts` ns) | Offset from Trace Start | Raw `dur` | Effective Duration (to trace end) | Depth |
| :--- | :--- | :--- | :--- | :--- | :--- | :--- |
| `40070` | `dispatchInputEvent MotionEvent UP` | `80459169801575` | `7,966.14 ms` | `190,633 ns` | `0.19 ms` | `0` |
| `40156` | **`MyApp:SubmitButton`** | `80459171444519` | `7,967.78 ms` | `-1` | **`9,281.30 ms`** | `0` |
| `97500` | **`handleNetworkResponse`** | `80466954886580` | `15,751.23 ms` | `-1` | **`1,497.86 ms`** | `1` |

---

### 2.2 Aggregate Main-Thread State (`thread_state`) During `MyApp:SubmitButton`

Aggregating `thread_state` for `utid = 760` from the start of `MyApp:SubmitButton` (`ts >= 80459171444519`) to the end of the trace reveals that the main thread spent **72.3%** of the time sleeping (`S`) and **27.6%** actively spinning on CPU (`Running`):

```sql
SELECT
  state,
  COUNT(*) AS cnt,
  SUM(dur) / 1e6 AS total_dur_ms,
  MIN(dur) / 1e6 AS min_dur_ms,
  MAX(dur) / 1e6 AS max_dur_ms
FROM thread_state
WHERE utid = 760 AND ts >= 80459171444519
GROUP BY state
ORDER BY total_dur_ms DESC;
```

| Thread State | Interval Count | Total Duration | Min Duration | Max Duration | Cause in Code |
| :--- | :--- | :--- | :--- | :--- | :--- |
| **`S` (Sleeping)** | `4` | **`6,703.18 ms`** | `700.78 ms` | `2,000.82 ms` | 4 `Thread.sleep()` calls in `performNetworkRequest()` |
| **`Running` (On CPU)** | `20` | **`2,559.81 ms`** | `0.00 ms` | `578.77 ms` | Busy-wait `while` loops in `cpuIntensiveComputation()` |
| **`R` (Runnable)** | `20` | **`2.11 ms`** | `0.01 ms` | `1.21 ms` | Scheduler wakeups and brief preemptions |

---

### 2.3 Phase-by-Phase Reconstruction (`thread_state` Intervals)

Querying individual `thread_state` intervals (`dur > 2 ms`) shows the exact sequence of CPU bursts and sleeps on the main thread:

```sql
SELECT
  ts,
  (ts - 80459171444519) / 1e6 AS ms_since_submit,
  dur / 1e6 AS dur_ms,
  state
FROM thread_state
WHERE utid = 760 AND ts >= 80459171444519 AND dur > 2e6
ORDER BY ts;
```

| Phase | Offset from Submit (`ms_since_submit`) | State | Duration (`dur_ms`) | Corresponding Code Execution |
| :--- | :--- | :--- | :--- | :--- |
| **1. Request Prep + Attempt #1 CPU** | `+0.63 ms` -> `+1,019.36 ms` | `Running` | **`1,018.68 ms`** *(across 5 slices)* | `prepareNetworkRequest()` (`1,000 ms` CPU) + Attempt #1 `cpuIntensiveComputation(20)` |
| **2. Network Attempt #1 (Timeout)** | `+1,019.36 ms` -> `+3,020.18 ms` | `S` (Sleep) | **`2,000.82 ms`** | `performNetworkRequest(2000)` -> `Thread.sleep(2000)` (`return false`) |
| **3. Network Attempt #2 (CPU)** | `+3,020.23 ms` -> `+3,040.24 ms` | `Running` | **`20.00 ms`** | Attempt #2 `cpuIntensiveComputation(20)` |
| **4. Network Attempt #2 (Timeout)** | `+3,040.24 ms` -> `+5,041.01 ms` | `S` (Sleep) | **`2,000.78 ms`** | `performNetworkRequest(2000)` -> `Thread.sleep(2000)` (`return false`) -- **5s input ANR threshold crossed** |
| **5. Network Attempt #3 (CPU)** | `+5,041.06 ms` -> `+5,061.30 ms` | `Running` | **`20.11 ms`** *(8.05 + 7.93 + 4.14 ms)* | Attempt #3 `cpuIntensiveComputation(20)` |
| **6. Network Attempt #3 (Timeout)** | `+5,061.30 ms` -> `+7,062.09 ms` | `S` (Sleep) | **`2,000.80 ms`** | `performNetworkRequest(2000)` -> `Thread.sleep(2000)` (`return false`) |
| **7. Network Attempt #4 (CPU)** | `+7,062.15 ms` -> `+7,082.38 ms` | `Running` | **`20.22 ms`** | Attempt #4 `cpuIntensiveComputation(20)` |
| **8. Network Attempt #4 (Success)** | `+7,082.38 ms` -> `+7,783.16 ms` | `S` (Sleep) | **`700.78 ms`** | `performNetworkRequest(2000)` hits `Math.random() < 0.2`, sleeps `~700 ms`, `return true` |
| **9. Handle Response (CPU)** | `+7,783.21 ms` -> `+9,281.30 ms` | `Running` | **`1,479.68 ms`** *(across 6 slices)* | `handleNetworkResponse()` (`Trace.beginSection("handleNetworkResponse")` at `+7,783.44 ms`) runs `cpuIntensiveComputation(2000)` until trace ends |

---

## 3. Code Mapping (`ProfilingManagerJavaSnippets.java`)

In `ProfilingManagerJavaSnippets.java` (lines `38` and `158-221`), the `OnClickListener` for `R.id.submit` runs `onClickSubmit()` directly on the main UI thread:

```java
private static final int NETWORK_TIMEOUT_MILLISECS = 2000;

public void setupButtonCallback() {
  findViewById(R.id.submit).setOnClickListener(submitButtonView -> {
    Trace.beginSection("MyApp:SubmitButton");
    onClickSubmit();
    Trace.endSection();
  });
}

public void onClickSubmit() {
  // 1. Blocks main thread on CPU for 1,000 ms
  prepareNetworkRequest();

  // 2. Synchronous retry loop on main thread (up to 10 attempts * 2,020 ms = 20.2 seconds!)
  boolean networkRequestSuccess = false;
  int maxAttempts = 10;
  while (!networkRequestSuccess && maxAttempts > 0) {
    networkRequestSuccess = performNetworkRequest(NETWORK_TIMEOUT_MILLISECS);
    maxAttempts--;
  }

  // 3. Blocks main thread on CPU for another 2,000 ms
  if (networkRequestSuccess) {
    handleNetworkResponse();
  }
}

boolean performNetworkRequest(int timeoutMilliseconds) {
  cpuIntensiveComputation(20);
  try {
    if (Math.random() < 0.2) {
      // Simulate performing a network request by waiting a random period of time
      int networkRequestTimeMs = (int) (Math.random() * timeoutMilliseconds);
      Thread.sleep(networkRequestTimeMs);
      return true;
    } else {
      // Simulate a timeout
      Thread.sleep(timeoutMilliseconds);
    }
  } catch (InterruptedException e) {
  }
  return false;
}

void cpuIntensiveComputation(int durationMs) {
  long start = System.currentTimeMillis();
  while (System.currentTimeMillis() - start < durationMs) {
  }
}

void prepareNetworkRequest() {
  cpuIntensiveComputation(1000);
}

public void handleNetworkResponse() {
  Trace.beginSection("handleNetworkResponse");
  cpuIntensiveComputation(2000);
  Trace.endSection();
}
```

---

## 4. Recommended Remediation

> **Tip:** Never perform network I/O, `Thread.sleep()`, or multi-hundred-millisecond CPU computations on the Android main UI thread.

1. **Offload `onClickSubmit()` to a Background Thread / Coroutine:**
   * In Java, dispatch `prepareNetworkRequest()`, the `performNetworkRequest()` retry loop, and heavy response processing in `handleNetworkResponse()` to a background `ExecutorService` (e.g., `Executors.newSingleThreadExecutor()`), then marshal only lightweight UI updates back to the main thread via `runOnUiThread(...)` or `View.post(...)`.
   * In Kotlin, use `lifecycleScope.launch(Dispatchers.IO)` (for network waiting) and `withContext(Dispatchers.Default)` (for CPU-intensive preparation/parsing).
2. **Use Non-Blocking / Asynchronous Retries with Backoff:**
   * Avoid holding threads with `Thread.sleep()` inside tight retry loops; use asynchronous HTTP client timeouts/retries or `WorkManager` for deferrable background network tasks.