

توضّح هذه الصفحة كيفية تصحيح أخطاء التطبيق لا يستجيب (ANR)
باستخدام ProfilingManager مع مثال على سجلّ تتبّع النظام.
إعداد التطبيق لجمع أخطاء ANR
ابدأ بإعداد عامل تشغيل خطأ ANR في تطبيقك:
Kotlin
fun addANRTrigger() { val profilingManager = applicationContext.getSystemService(ProfilingManager::class.java) ?: return val triggers = ArrayList<ProfilingTrigger>() val triggerBuilder = ProfilingTrigger.Builder(ProfilingTrigger.TRIGGER_TYPE_ANR) triggers.add(triggerBuilder.build()) val callbackExecutor: Executor = Executors.newSingleThreadExecutor() val resultCallback = Consumer<ProfilingResult> { profilingResult -> // Handle uploading trace to your back-end } profilingManager.registerForAllProfilingResults(callbackExecutor, resultCallback) profilingManager.addProfilingTriggers(triggers) }
Java
public void addANRTrigger() { ProfilingManager profilingManager = getApplicationContext().getSystemService( ProfilingManager.class); List<ProfilingTrigger> triggers = new ArrayList<>(); ProfilingTrigger.Builder triggerBuilder = new ProfilingTrigger.Builder( ProfilingTrigger.TRIGGER_TYPE_ANR); triggers.add(triggerBuilder.build()); Executor callbackExecutor = Executors.newSingleThreadExecutor(); Consumer<ProfilingResult> resultCallback = profilingResult -> { // Handle uploading trace to your back-end }; profilingManager.registerForAllProfilingResults(callbackExecutor, resultCallback); profilingManager.addProfilingTriggers(triggers); }
بعد تسجيل عملية تتبُّع خطأ ANR وتحميلها، يمكنك فحصها يدويًا في واجهة مستخدم Perfetto كما هو موضّح في الخطوات التالية، أو التحقيق في خطأ ANR تلقائيًا باستخدام وكيل الذكاء الاصطناعي.
تحليل آثار الأنشطة
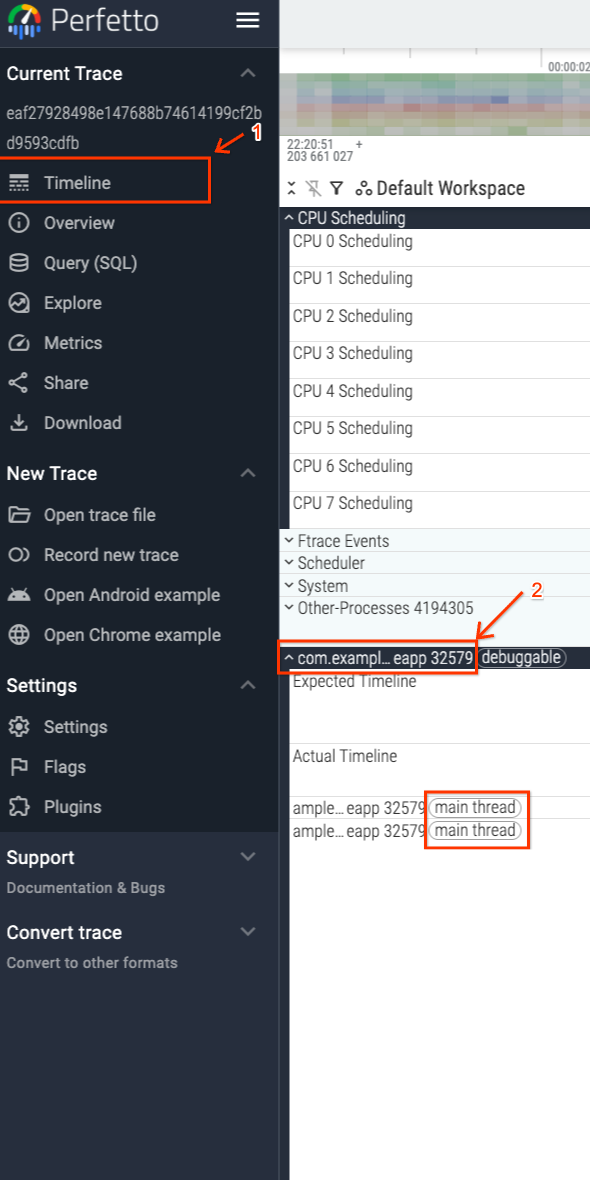
بما أنّ خطأ ANR هو الذي بدأ عملية التتبُّع، فستعرف أنّ عملية التتبُّع انتهت عندما رصد النظام عدم استجابة في سلسلة التعليمات الرئيسية لتطبيقك (أو عند حدوث مهلة أخرى). يوضّح الشكل 1 كيفية الانتقال إلى سلسلة التعليمات الرئيسية لتطبيقك، والتي يتم وضع علامة عليها وفقًا لذلك داخل واجهة المستخدم.
تتطابق نهاية التتبُّع مع الطابع الزمني لخطأ ANR، كما هو موضّح في الشكل 2.

عند حدوث خطأ ANR، كانت سلسلة التعليمات الرئيسية تنفّذ الجزء handleNetworkResponse داخل MyApp:SubmitButton، والذي استهلك 1.48 ثانية من وقت وحدة المعالجة المركزية (الشكل 3).

قد يؤدي الاعتماد فقط على تفريغ تسلسل استدعاء الدوال البرمجية الذي تم إجراؤه في لحظة حدوث خطأ ANR إلى نسب
التجميد بالكامل إلى handleNetworkResponse. ومع ذلك، فإنّ 1.48 ثانية ليست مدة كافية بمفردها لتشغيل خطأ ANR، لذا عليك فحص ما حظر سلسلة التعليمات الرئيسية في وقت سابق.
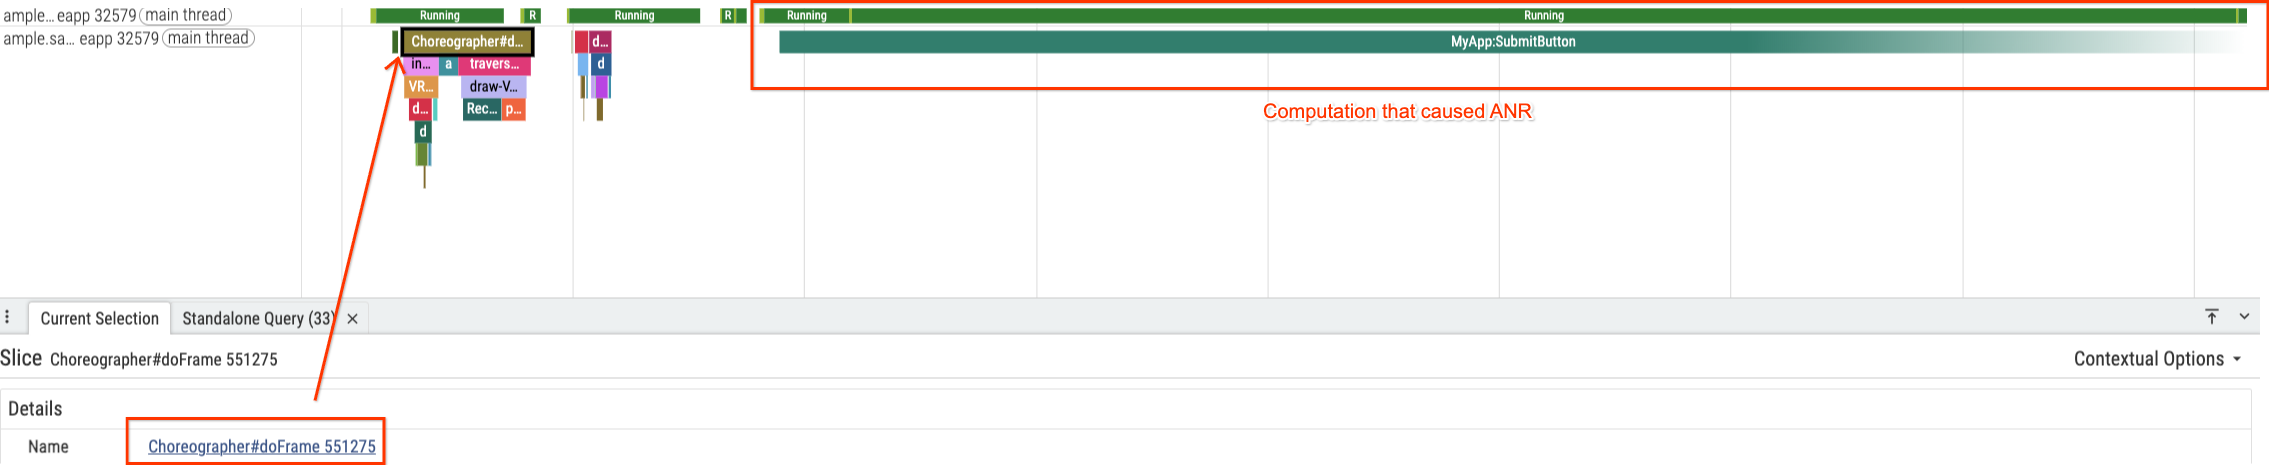
ابدأ بتحديد موقع آخر إطار لواجهة المستخدم تم عرضه قبل التجميد
(Choreographer#doFrame 551275)، والذي يسبق مباشرةً
شريحة MyApp:SubmitButton (الشكل 4).
لفهم سبب الحظر، يمكنك التصغير لفحص شريحة MyApp:SubmitButton بالكامل. ستلاحظ تفاصيل مهمة في حالات سلاسل المحادثات للنطاق المحدّد يدويًا في الشكل 5: قضت سلسلة المحادثات حوالي %75 من الوقت (6.7 ثوانٍ) في حالة Sleeping و%24 فقط من الوقت في حالة Running.
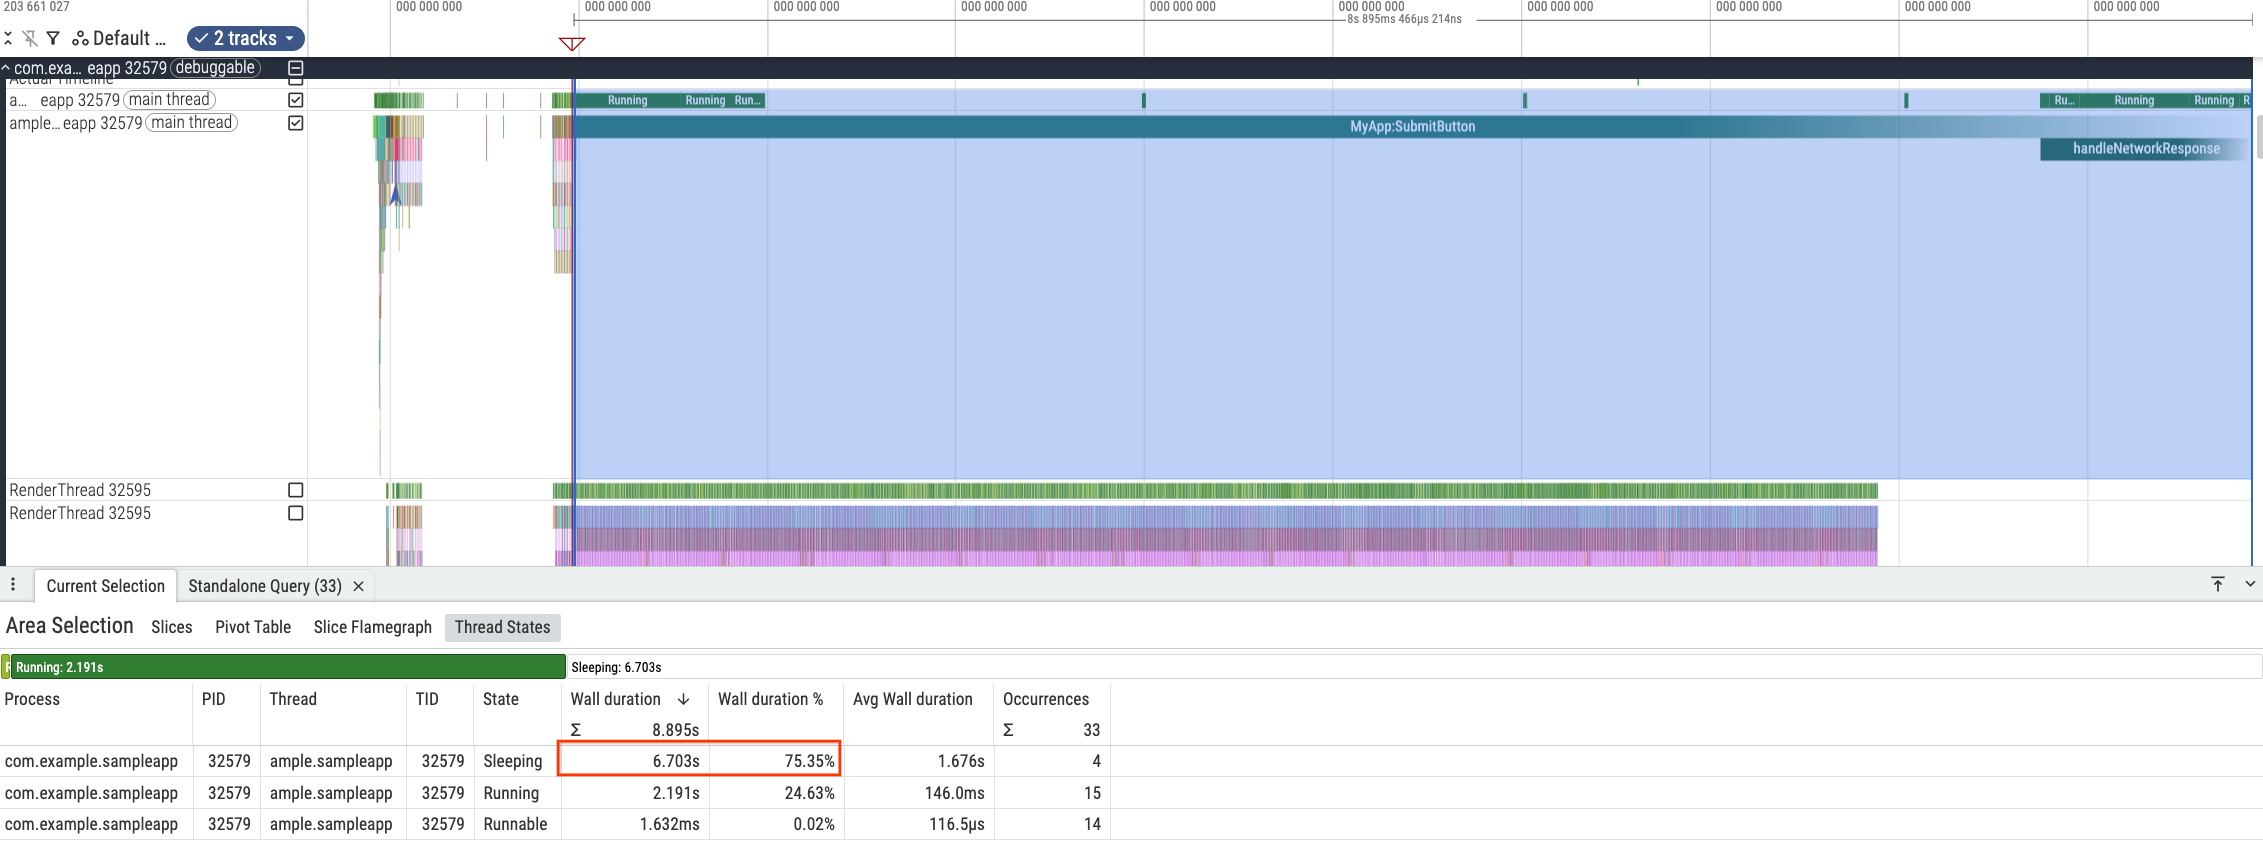
MyApp:SubmitButtonيشير ذلك إلى أنّ السبب الأساسي لحدوث خطأ ANR هو الانتظار، وليس العمليات الحسابية. افحص حالات النوم الفردية للعثور على نمط.

MyApp:SubmitButton.
MyApp:SubmitButton.
MyApp:SubmitButton.
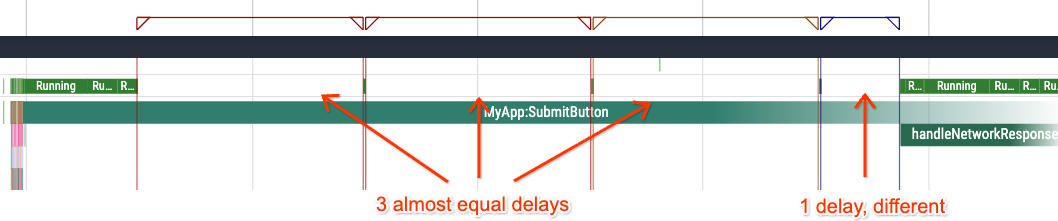
MyApp:SubmitButton.تبلغ مدة كل من فترات السكون الثلاث الأولى (الأشكال من 6 إلى 8) ثانيتين تقريبًا، وتبلغ مدة الفترة الرابعة (الشكل 9) 0.7 ثانية. تشير فترات الإيقاف المؤقت المتكررة لمدة ثانيتين بقوة إلى مهلة مبرمَجة تمت إعادة محاولتها ثلاث مرات قبل النجاح في المحاولة الرابعة، ما يؤدي إلى تراكم تأخير كافٍ لتشغيل خطأ ANR (الشكل 10).
MyApp:SubmitButtonتحديد السبب الأساسي في الرمز البرمجي
للتحقّق من هذه الفرضية، افحص الرمز المرتبط بقسم تتبُّع MyApp:SubmitButton:
Kotlin
fun setupButtonCallback() { findViewById<View>(R.id.submit).setOnClickListener { trace("MyApp:SubmitButton") { onClickSubmit() } } } fun onClickSubmit() { prepareNetworkRequest() var networkRequestSuccess = false var maxAttempts = 10 while (!networkRequestSuccess && maxAttempts > 0) { networkRequestSuccess = performNetworkRequest(NETWORK_TIMEOUT_MILLISECS) maxAttempts-- } if (networkRequestSuccess) { handleNetworkResponse() } } fun performNetworkRequest(timeoutMilliseconds: Int): Boolean { // ... } fun prepareNetworkRequest() { // ... } fun handleNetworkResponse() { trace("handleNetworkResponse") { // ... } } companion object { private const val NETWORK_TIMEOUT_MILLISECS = 2000 }
Java
private static final int NETWORK_TIMEOUT_MILLISECS = 2000; public void setupButtonCallback() { findViewById(R.id.submit).setOnClickListener(submitButtonView -> { Trace.beginSection("MyApp:SubmitButton"); onClickSubmit(); Trace.endSection(); }); } public void onClickSubmit() { prepareNetworkRequest(); boolean networkRequestSuccess = false; int maxAttempts = 10; while (!networkRequestSuccess && maxAttempts > 0) { networkRequestSuccess = performNetworkRequest(NETWORK_TIMEOUT_MILLISECS); maxAttempts--; } if (networkRequestSuccess) { handleNetworkResponse(); } } boolean performNetworkRequest(int timeoutMiliseconds) { // ... } void prepareNetworkRequest() { // ... } public void handleNetworkResponse() { Trace.beginSection("handleNetworkResponse"); // ... Trace.endSection(); }
يؤكد الرمز هذه الفرضية. تنفّذ طريقة onClickSubmit طلب شبكة على سلسلة واجهة المستخدم مع NETWORK_TIMEOUT_MILLISECS مضمّن في الرمز البرمجي مدته 2000 ملي ثانية.
والأهم من ذلك، يتم تشغيلها داخل حلقة while التي تعيد المحاولة حتى 10 مرات.
في هذا التتبُّع المحدّد، من المرجّح أنّ اتصال المستخدم بالشبكة كان ضعيفًا. فشلت المحاولات الثلاث الأولى، مما تسبب في ثلاث مهلات مدتها ثانيتان (إجمالي 6 ثوانٍ).
نجحت المحاولة الرابعة بعد 0.7 ثانية، ما سمح للرمز البرمجي بالانتقال إلى
handleNetworkResponse. ومع ذلك، فإن وقت الانتظار المتراكم قد أدى بالفعل إلى تشغيل
ANR.
إصلاح خطأ ANR
يمكنك تجنُّب هذا النوع من أخطاء ANR من خلال نقل العمليات المتعلقة بالشبكة والتي تتفاوت فيها فترات الاستجابة إلى سلسلة تعليمات في الخلفية بدلاً من تنفيذها في سلسلة التعليمات الرئيسية. يؤدي ذلك إلى الحفاظ على استجابة واجهة المستخدم حتى في حال ضعف الاتصال، ما يمنع حدوث هذه الفئة من أخطاء ANR.
أتمِتة التحقيق في أخطاء ANR باستخدام وكيل الذكاء الاصطناعي
بدلاً من فحص المخططات الزمنية وفترات السكون يدويًا في واجهة مستخدم Perfetto، يمكنك استخدام وكيل ترميز مستند إلى الذكاء الاصطناعي تم ضبطه باستخدام مهارة Perfetto AI لطلب تتبُّع ANR وربطه بقاعدة الرموز البرمجية:
Analyze the Perfetto system trace at </path/to/trace.perfetto-trace>, which
corresponds to an ANR trace, and find the root cause of the ANR using the
Perfetto AI skill. The codebase is located at </path/to/codebase>.
يستعلم الوكيل عن التتبُّع باستخدام trace_processor ويتوصّل إلى النتيجة نفسها التي توصّل إليها التحقيق اليدوي، بدون أن يتم تضليله من خلال شريحة handleNetworkResponse غير المكتملة في نهاية التتبُّع. تحدِّد هذه الأداة أنّ
MyApp:SubmitButton حظر سلسلة التعليمات الرئيسية لأكثر من 9.2 ثانية، وتعيد إنشاء
المهلات الثلاث للشبكة التي تبلغ مدتها ثانيتين والمحاولة الرابعة التي تبلغ مدتها 0.7 ثانية في
performNetworkRequest إلى جانب حلقات الانتظار النشط لوحدة المعالجة المركزية في
prepareNetworkRequest وhandleNetworkResponse، وتعيّن كل مرحلة إلى
ProfilingManagerJavaSnippets.java مع اقتراح بنقل
onClickSubmit خارج سلسلة واجهة المستخدم:
# Perfetto ANR Root-Cause Analysis Report

* **Source Code:** `ProfilingManagerJavaSnippets.java`
* **Target Process:** `com.example.sampleapp` (`pid = 32579`, `upid = 27`)
* **Blocked Thread:** Main UI thread `ample.sampleapp` (`tid = 32579`, `utid = 760`)
* **Collection Mechanism:** Android `ProfilingManager` (`ProfilingTrigger.TRIGGER_TYPE_ANR`)

---

## 1. Executive Summary

> **Important:** The ANR in `com.example.sampleapp` is caused by executing **synchronous, blocking network retry logic (`Thread.sleep`) and heavy CPU busy-wait loops (`cpuIntensiveComputation`) directly on the main UI thread** inside the submit button click listener (`MyApp:SubmitButton` -> `onClickSubmit()`).

When the user taps the submit button at `7,967.78 ms` into the trace (`ts = 80459171444519`), the main UI thread is blocked continuously for **more than `9,281.30 ms`** (still unfinished when the trace ends at `17,249.08 ms`):

1. **`prepareNetworkRequest()`** runs a CPU busy-wait loop on the main thread for **`~1,019 ms`**.
2. **`performNetworkRequest(2000)`** executes in a synchronous `while` retry loop on the main thread. Each attempt begins with **`20 ms`** of CPU busy-waiting followed by a `Thread.sleep()`. The request times out (`2,000 ms` sleep) **3 times in a row** and succeeds on the **4th attempt** (`~701 ms` sleep), blocking the main thread for **`~6,764 ms`** across the 4 attempts (`6,703.18 ms` sleeping + `~60 ms` CPU).
3. **`handleNetworkResponse()`** begins at **`+7,783.44 ms`** after the button click and runs another `2,000 ms` CPU busy-wait loop on the main thread (`1,497.86 ms` captured before the trace ends).

    [Touch UP & Click (t = +0 ms)]
      -> prepareNetworkRequest() (~1,000 ms CPU Busy-Wait)
      -> Attempt #1 (Timeout: 20 ms CPU + 2,001 ms Sleep)
      -> Attempt #2 (Timeout: 20 ms CPU + 2,001 ms Sleep)
      -> Attempt #3 (Timeout: 20 ms CPU + 2,001 ms Sleep, crosses 5s ANR threshold)
      -> Attempt #4 (Success: 20 ms CPU + 701 ms Sleep)
      -> handleNetworkResponse() (1,498 ms CPU, unfinished at trace end)
## 2. PerfettoSQL Trace Analysis

### 2.1 Open Main-Thread Slices at Trace End

Querying `thread_or_process_slice` on the main thread (`utid = 760`) around and after the touch event shows that `MyApp:SubmitButton` and its nested slice `handleNetworkResponse` both have `dur = -1` (still open when the trace completed):

```sql
INCLUDE PERFETTO MODULE slices.with_context;

SELECT
  id,
  ts,
  (ts - trace_start()) / 1e6 AS rel_ts_ms,
  dur,
  IIF(dur = -1, trace_end() - ts, dur) / 1e6 AS effective_dur_ms,
  depth,
  name
FROM thread_or_process_slice
WHERE utid = 760 AND ts >= 80459169800000
ORDER BY ts;
```

| Slice ID | Slice Name | Start (`ts` ns) | Offset from Trace Start | Raw `dur` | Effective Duration (to trace end) | Depth |
| :--- | :--- | :--- | :--- | :--- | :--- | :--- |
| `40070` | `dispatchInputEvent MotionEvent UP` | `80459169801575` | `7,966.14 ms` | `190,633 ns` | `0.19 ms` | `0` |
| `40156` | **`MyApp:SubmitButton`** | `80459171444519` | `7,967.78 ms` | `-1` | **`9,281.30 ms`** | `0` |
| `97500` | **`handleNetworkResponse`** | `80466954886580` | `15,751.23 ms` | `-1` | **`1,497.86 ms`** | `1` |

---

### 2.2 Aggregate Main-Thread State (`thread_state`) During `MyApp:SubmitButton`

Aggregating `thread_state` for `utid = 760` from the start of `MyApp:SubmitButton` (`ts >= 80459171444519`) to the end of the trace reveals that the main thread spent **72.3%** of the time sleeping (`S`) and **27.6%** actively spinning on CPU (`Running`):

```sql
SELECT
  state,
  COUNT(*) AS cnt,
  SUM(dur) / 1e6 AS total_dur_ms,
  MIN(dur) / 1e6 AS min_dur_ms,
  MAX(dur) / 1e6 AS max_dur_ms
FROM thread_state
WHERE utid = 760 AND ts >= 80459171444519
GROUP BY state
ORDER BY total_dur_ms DESC;
```

| Thread State | Interval Count | Total Duration | Min Duration | Max Duration | Cause in Code |
| :--- | :--- | :--- | :--- | :--- | :--- |
| **`S` (Sleeping)** | `4` | **`6,703.18 ms`** | `700.78 ms` | `2,000.82 ms` | 4 `Thread.sleep()` calls in `performNetworkRequest()` |
| **`Running` (On CPU)** | `20` | **`2,559.81 ms`** | `0.00 ms` | `578.77 ms` | Busy-wait `while` loops in `cpuIntensiveComputation()` |
| **`R` (Runnable)** | `20` | **`2.11 ms`** | `0.01 ms` | `1.21 ms` | Scheduler wakeups and brief preemptions |

---

### 2.3 Phase-by-Phase Reconstruction (`thread_state` Intervals)

Querying individual `thread_state` intervals (`dur > 2 ms`) shows the exact sequence of CPU bursts and sleeps on the main thread:

```sql
SELECT
  ts,
  (ts - 80459171444519) / 1e6 AS ms_since_submit,
  dur / 1e6 AS dur_ms,
  state
FROM thread_state
WHERE utid = 760 AND ts >= 80459171444519 AND dur > 2e6
ORDER BY ts;
```

| Phase | Offset from Submit (`ms_since_submit`) | State | Duration (`dur_ms`) | Corresponding Code Execution |
| :--- | :--- | :--- | :--- | :--- |
| **1. Request Prep + Attempt #1 CPU** | `+0.63 ms` -> `+1,019.36 ms` | `Running` | **`1,018.68 ms`** *(across 5 slices)* | `prepareNetworkRequest()` (`1,000 ms` CPU) + Attempt #1 `cpuIntensiveComputation(20)` |
| **2. Network Attempt #1 (Timeout)** | `+1,019.36 ms` -> `+3,020.18 ms` | `S` (Sleep) | **`2,000.82 ms`** | `performNetworkRequest(2000)` -> `Thread.sleep(2000)` (`return false`) |
| **3. Network Attempt #2 (CPU)** | `+3,020.23 ms` -> `+3,040.24 ms` | `Running` | **`20.00 ms`** | Attempt #2 `cpuIntensiveComputation(20)` |
| **4. Network Attempt #2 (Timeout)** | `+3,040.24 ms` -> `+5,041.01 ms` | `S` (Sleep) | **`2,000.78 ms`** | `performNetworkRequest(2000)` -> `Thread.sleep(2000)` (`return false`) -- **5s input ANR threshold crossed** |
| **5. Network Attempt #3 (CPU)** | `+5,041.06 ms` -> `+5,061.30 ms` | `Running` | **`20.11 ms`** *(8.05 + 7.93 + 4.14 ms)* | Attempt #3 `cpuIntensiveComputation(20)` |
| **6. Network Attempt #3 (Timeout)** | `+5,061.30 ms` -> `+7,062.09 ms` | `S` (Sleep) | **`2,000.80 ms`** | `performNetworkRequest(2000)` -> `Thread.sleep(2000)` (`return false`) |
| **7. Network Attempt #4 (CPU)** | `+7,062.15 ms` -> `+7,082.38 ms` | `Running` | **`20.22 ms`** | Attempt #4 `cpuIntensiveComputation(20)` |
| **8. Network Attempt #4 (Success)** | `+7,082.38 ms` -> `+7,783.16 ms` | `S` (Sleep) | **`700.78 ms`** | `performNetworkRequest(2000)` hits `Math.random() < 0.2`, sleeps `~700 ms`, `return true` |
| **9. Handle Response (CPU)** | `+7,783.21 ms` -> `+9,281.30 ms` | `Running` | **`1,479.68 ms`** *(across 6 slices)* | `handleNetworkResponse()` (`Trace.beginSection("handleNetworkResponse")` at `+7,783.44 ms`) runs `cpuIntensiveComputation(2000)` until trace ends |

---

## 3. Code Mapping (`ProfilingManagerJavaSnippets.java`)

In `ProfilingManagerJavaSnippets.java` (lines `38` and `158-221`), the `OnClickListener` for `R.id.submit` runs `onClickSubmit()` directly on the main UI thread:

```java
private static final int NETWORK_TIMEOUT_MILLISECS = 2000;

public void setupButtonCallback() {
  findViewById(R.id.submit).setOnClickListener(submitButtonView -> {
    Trace.beginSection("MyApp:SubmitButton");
    onClickSubmit();
    Trace.endSection();
  });
}

public void onClickSubmit() {
  // 1. Blocks main thread on CPU for 1,000 ms
  prepareNetworkRequest();

  // 2. Synchronous retry loop on main thread (up to 10 attempts * 2,020 ms = 20.2 seconds!)
  boolean networkRequestSuccess = false;
  int maxAttempts = 10;
  while (!networkRequestSuccess && maxAttempts > 0) {
    networkRequestSuccess = performNetworkRequest(NETWORK_TIMEOUT_MILLISECS);
    maxAttempts--;
  }

  // 3. Blocks main thread on CPU for another 2,000 ms
  if (networkRequestSuccess) {
    handleNetworkResponse();
  }
}

boolean performNetworkRequest(int timeoutMilliseconds) {
  cpuIntensiveComputation(20);
  try {
    if (Math.random() < 0.2) {
      // Simulate performing a network request by waiting a random period of time
      int networkRequestTimeMs = (int) (Math.random() * timeoutMilliseconds);
      Thread.sleep(networkRequestTimeMs);
      return true;
    } else {
      // Simulate a timeout
      Thread.sleep(timeoutMilliseconds);
    }
  } catch (InterruptedException e) {
  }
  return false;
}

void cpuIntensiveComputation(int durationMs) {
  long start = System.currentTimeMillis();
  while (System.currentTimeMillis() - start < durationMs) {
  }
}

void prepareNetworkRequest() {
  cpuIntensiveComputation(1000);
}

public void handleNetworkResponse() {
  Trace.beginSection("handleNetworkResponse");
  cpuIntensiveComputation(2000);
  Trace.endSection();
}
```

---

## 4. Recommended Remediation

> **Tip:** Never perform network I/O, `Thread.sleep()`, or multi-hundred-millisecond CPU computations on the Android main UI thread.

1. **Offload `onClickSubmit()` to a Background Thread / Coroutine:**
   * In Java, dispatch `prepareNetworkRequest()`, the `performNetworkRequest()` retry loop, and heavy response processing in `handleNetworkResponse()` to a background `ExecutorService` (e.g., `Executors.newSingleThreadExecutor()`), then marshal only lightweight UI updates back to the main thread via `runOnUiThread(...)` or `View.post(...)`.
   * In Kotlin, use `lifecycleScope.launch(Dispatchers.IO)` (for network waiting) and `withContext(Dispatchers.Default)` (for CPU-intensive preparation/parsing).
2. **Use Non-Blocking / Asynchronous Retries with Backoff:**
   * Avoid holding threads with `Thread.sleep()` inside tight retry loops; use asynchronous HTTP client timeouts/retries or `WorkManager` for deferrable background network tasks.