تنظيم صفحاتك في مجموعات
يمكنك حفظ المحتوى وتصنيفه حسب إعداداتك المفضّلة.
الشكل 1. جزء الأداء
يعرض جزء الأداء أداء وحدة معالجة الرسومات لأحداث العرض المختلفة.
هناك ثلاثة مكونات في هذا الجزء:
شريط الأدوات: يحتوي على أزرار وظيفية لتخصيص جدول الأداء
أو لبدء تجربة.
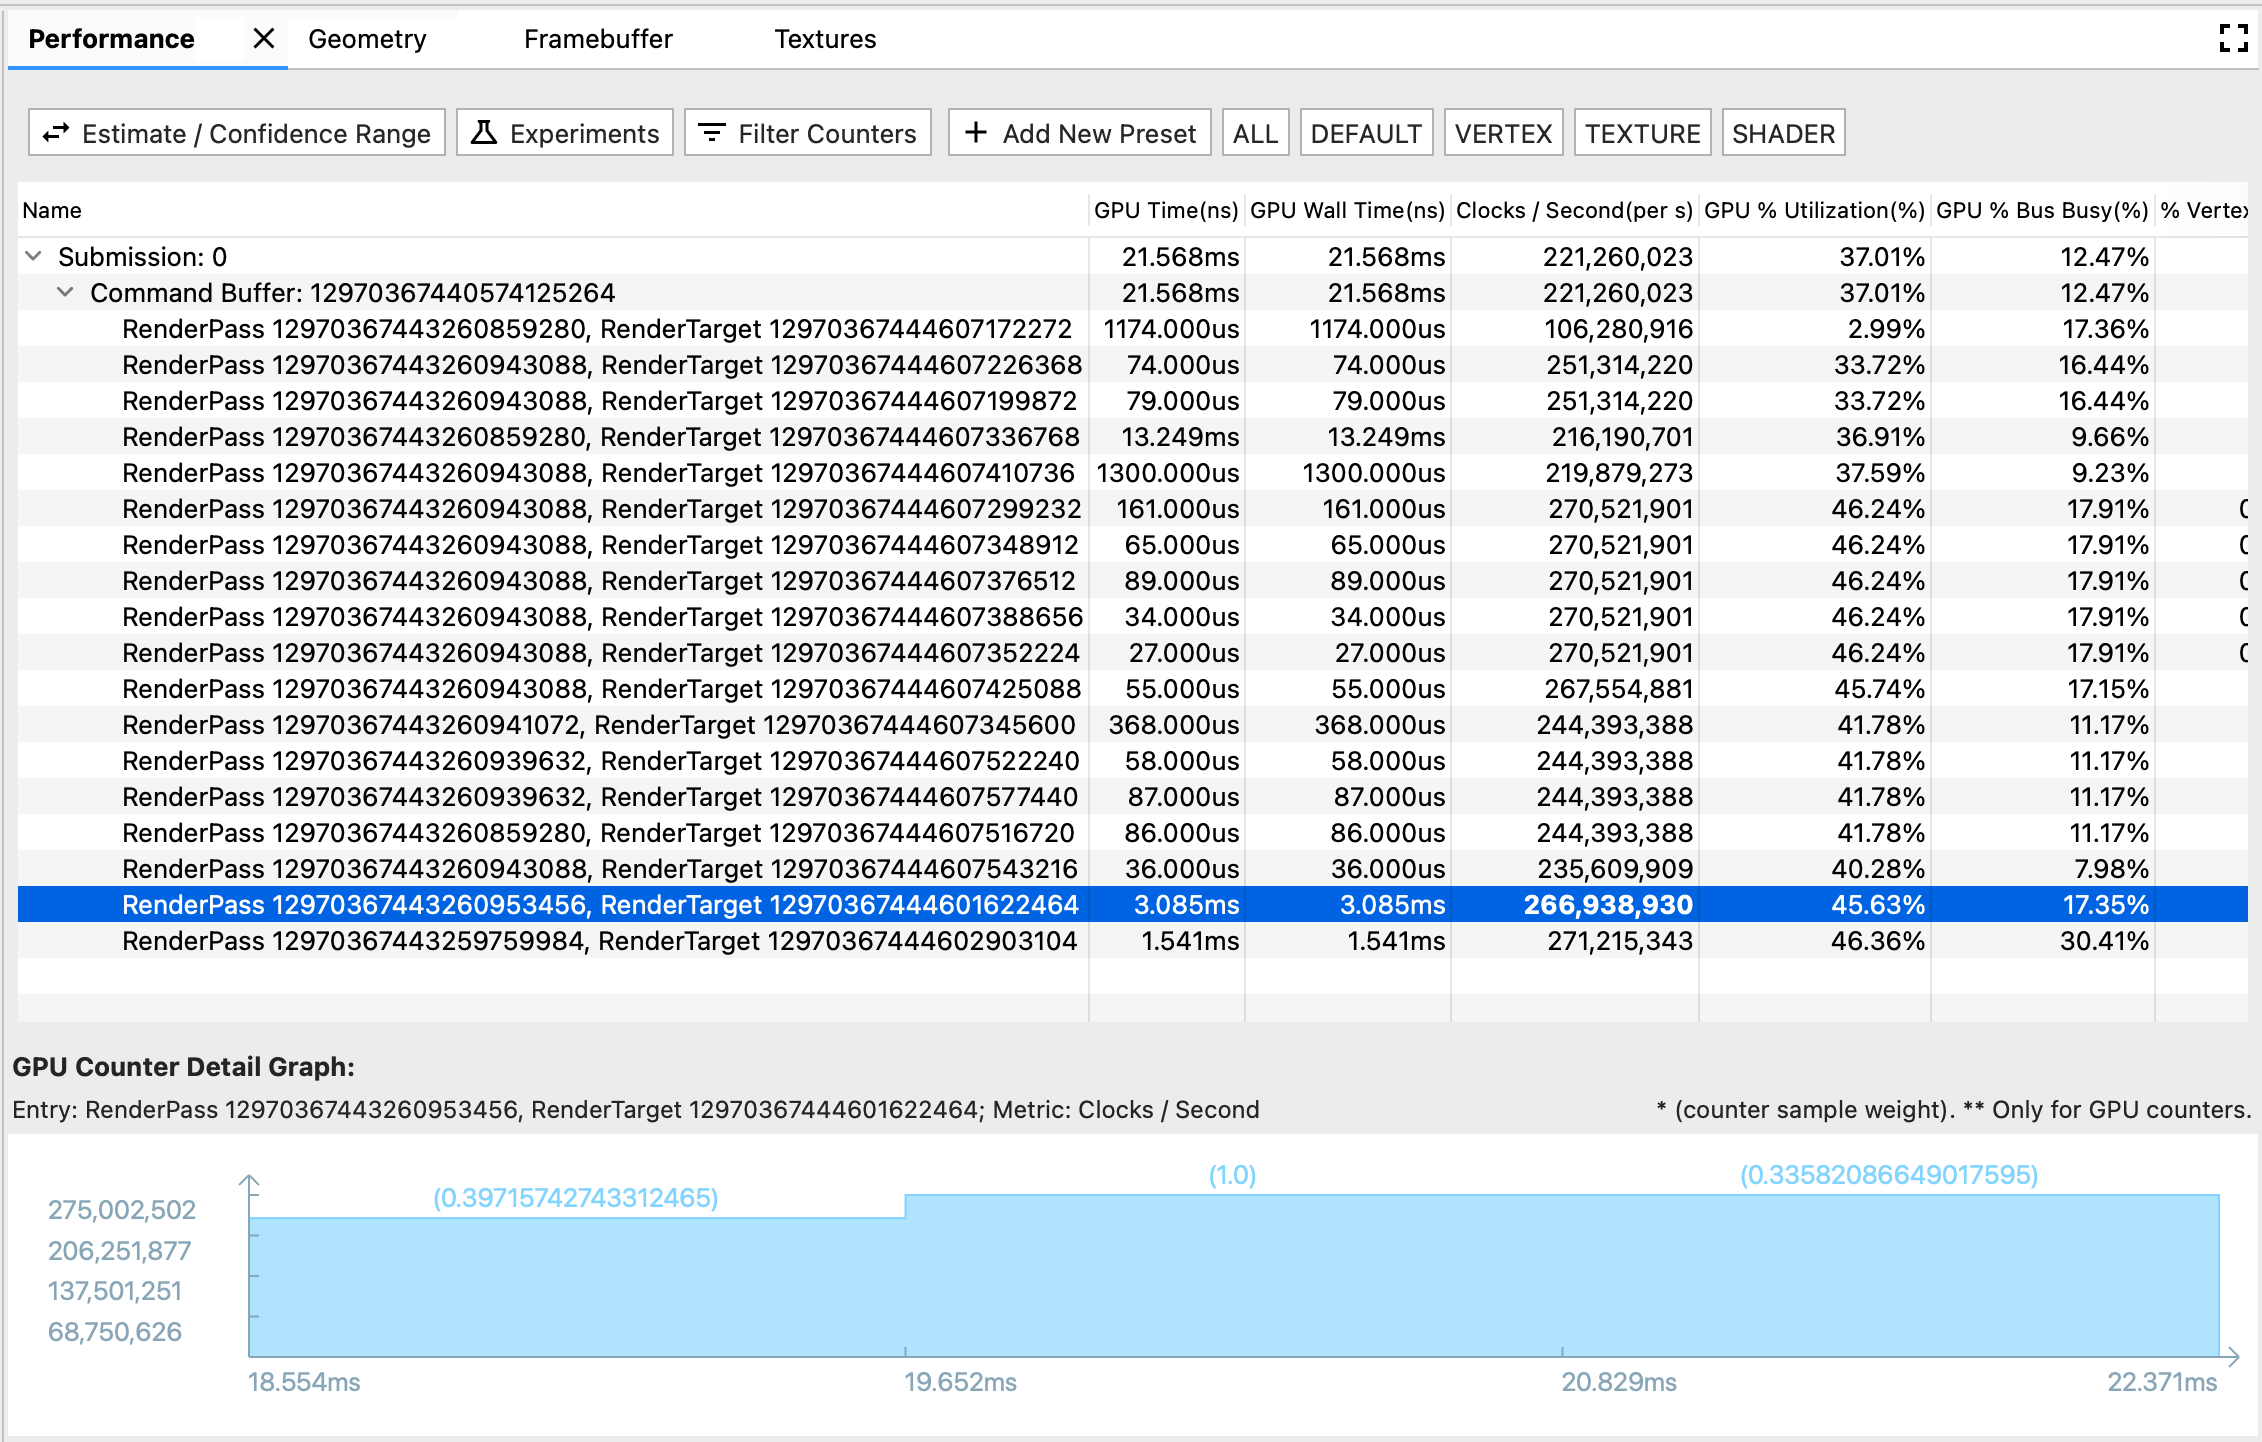
جدول الأداء: عرض الجدول الرئيسي في علامة التبويب الأداء. يمثل كل صف حدث عرض، ويمثل كل عمود مقياس وحدة معالجة الرسومات (وقت وحدة معالجة الرسومات أو عدّاد وحدة معالجة الرسومات). بهذه الطريقة، تمثل خلية عددية معينة أداء
مقياس وحدة معالجة الرسومات المحدد في حدث العرض المحدد.
رسم بياني تفصيلي لعدّاد وحدة معالجة الرسومات: يعرض بالتفصيل تغيُّر مقياس وحدة معالجة الرسومات أثناء وقت حدوث حدث العرض. تتم إعادة تحميل الرسم البياني لمقاييس عدّاد وحدة معالجة الرسومات فقط، وليس لمقاييس الوقت الخاصة بوحدة معالجة الرسومات، لأنّ مقياس الوقت واضح ولا يتغير مع مرور الوقت.
شريط الأدوات
زر التقدير / نطاق الثقة: لتبديل كيفية عرض رقم الأداء. ونظرًا لأن عيّنات عدّاد وحدة معالجة الرسومات يتم أخذها بالوتيرة التي تناسبها،
قد لا يتوافق الإطار الزمني تمامًا مع الإطار الزمني لحدث العرض. وعندما
يكون هناك تداخل جزئي، قد تكون هناك تفسيرات متعددة لمقدار
مساهمة العيّنة المضادة في حدث العرض، وتتراوح من
مساهمة صفرية إلى مساهمة كاملة. استنادًا إلى الحالات الهامشية،
حسبنا نطاق الثقة، واستنادًا إلى وزن الوقت المتداخل،
حسبنا التقدير.
التجربة: يتم فتح مربّع حوار لاختيار التجربة التي تريد تنفيذها. يمنحك AGI خيارات لتجربة بعض ممارسات التحسين الشائعة بدون الحاجة إلى إعادة تجميع تطبيقك. وعند بدء تجربة، يعيد AGI تشغيل الإطار وفقًا للإعدادات الجديدة، ويحدث جدول أداء وحدة معالجة الرسومات وفقًا لذلك.
عدّادات الفلاتر: تفتح مربّع حوار لاختيار أعمدة المقاييس التي تريد عرضها في جدول الأداء.
شريط الإعدادات المسبقة: يتكون من زر إضافة إعداد مسبق جديد مع اتباع أزرار مخصصة معدّة مسبقًا. الإعداد المسبق هو تركيبة محددة مسبقًا من مقاييس وحدة معالجة الرسومات. عند النقر على زر معدّ مسبقًا، يعرض جدول الأداء
قائمة تمت فلترتها للمقاييس المحدَّدة مسبقًا. يمكنك أيضًا إدارة الإعدادات المسبقة في مربّع الحوار
إضافة إعداد مسبق جديد.
جدول الأداء
يرتبط هذا الجدول بلوحة الملف الشخصي ولوحة الأوامر. يشتمل حدث العرض على ثلاثة تنسيقات تمثيل في سجلّ التتبُّع: صف في لوحة الأداء وشريحة في لوحة الملف الشخصي وعقدة في لوحة الأوامر. لتسهيل عملية التصفح، عند تحديد أحد التنسيقين، يتم تمييز التنسيقين الآخرين أيضًا. على سبيل المثال، إذا كنت مهتمًا بالشريحة الأطول في لوحة الملف الشخصي، يمكنك تحديدها والانتقال إلى صف الأداء المميّز لإلقاء نظرة على الأداء التفصيلي لعدّاد وحدة معالجة الرسومات لهذا الحدث.
رسم بياني تفصيلي لعدّاد وحدة معالجة الرسومات
ويعرض المحور س الطوابع الزمنية للعيّنات المضادة. يُرجى العِلم أنّ الوقت يستند إلى وقت بدء أول حدث عرض، لذا قد ترى أحيانًا طابعًا زمنيًا سلبيًا في الرسم البياني لتفاصيل العدّاد للنموذج المقابل الأول، والذي يتداخل جزئيًا مع حدث العرض الأول.
أما المحور ص، فيعرض قيمة أداء مقاييس العيّنات العدّاد.
ويشير الرقم بين قوسَين فوق كل شريط إلى وزن العيّنة المقابلة أو مقدار المساهمة التي نقدِّمها العيّنة في حدث العرض، وذلك في السيناريو المقدَّر.
يخضع كل من المحتوى وعيّنات التعليمات البرمجية في هذه الصفحة للتراخيص الموضحّة في ترخيص استخدام المحتوى. إنّ Java وOpenJDK هما علامتان تجاريتان مسجَّلتان لشركة Oracle و/أو الشركات التابعة لها.
تاريخ التعديل الأخير: 2025-07-27 (حسب التوقيت العالمي المتفَّق عليه)
[null,null,["تاريخ التعديل الأخير: 2025-07-27 (حسب التوقيت العالمي المتفَّق عليه)"],[],[],null,["# Performance pane\n\n**Figure 1.**Performance pane\n\nThe **Performance** pane displays GPU performance for different rendering events.\n\nThere are three components in this pane:\n\n- Toolbar: contains functional buttons for customizing the **Performance Table** or kicking off an experiment.\n- **Performance Table** : **Performance** tab's main tabular view. Each row represents a rendering event, and each column represents a GPU metric (GPU time or GPU counter). In this way, a specific numerical cell represents the specific GPU metric's performance at the specific rendering event.\n- **GPU Counter Detail Graph**: displays in detail how a GPU metric fluctuates during the time when a rendering event happens. The graph only refreshes for GPU counter metrics but not for GPU time metrics, since the time metric is self-explaining and doesn't fluctuate with time.\n\nToolbar\n-------\n\n- **Estimate / Confidence Range** button: toggles how the performance number is shown. Since GPU counter samples are polled at their own pace, its timeframe may not align perfectly with a rendering event's timeframe. When they are partially overlapped, there may be multiple interpretations of how much the counter sample contributes to the rendering event, ranging from zero contribution to full contribution. Based on the edge cases, we calculated the **Confidence Range** ; and based on overlapped time's weight, we calculated the **Estimate**.\n- **Experiment**: opens a dialog for choosing the experiment you'd like to run. AGI give you options to try out some common optimization practices with no need of re-compiling your application. When you kick off an experiment, AGI replays the frame based with the new setting, and update the GPU performance table accordingly.\n- **Filter Counters** : opens a dialog for choosing which metric columns you'd like to show in the **Performance Table**.\n- **Presets Bar** : composed by an **Add New Preset** button with following customized preset buttons. A preset is a pre-defined combination of GPU metrics. When you click a preset button, the **Performance Table** shows a filtered list of the pre-defined metrics. You can also manage presets in the **Add New Preset** dialog.\n\nPerformance Table\n-----------------\n\nThis table links with **Profile** pane and **Command** pane. A rendering event has three representation formats in a trace: a row in **Performance** pane, a slice in **Profile** pane, and a node in **Command** pane. To make it easier for browsing, when you select either one of the formats, the other two are highlighted as well. For example, if you are interested in the longest slice in **Profile** pane, you could select it, and navigate to the highlighted **Performance** row to look at detailed GPU counter performances for this event.\n\nGPU counter detail graph\n------------------------\n\n- The x-axis shows counter samples' timestamps. Note that the time is based on the start time of the very first rendering event, so sometimes you may see negative timestamp in the counter detail graph for the first counter sample, which partially overlaps with the first rendering event.\n- The y-axis shows counter samples' metric performance value.\n- The parenthesized number above each bar shows the counter sample's weight, or how much contribution we consider the sample provides towards the rendering event, in the estimated scenario."]]