Tetap teratur dengan koleksi
Simpan dan kategorikan konten berdasarkan preferensi Anda.
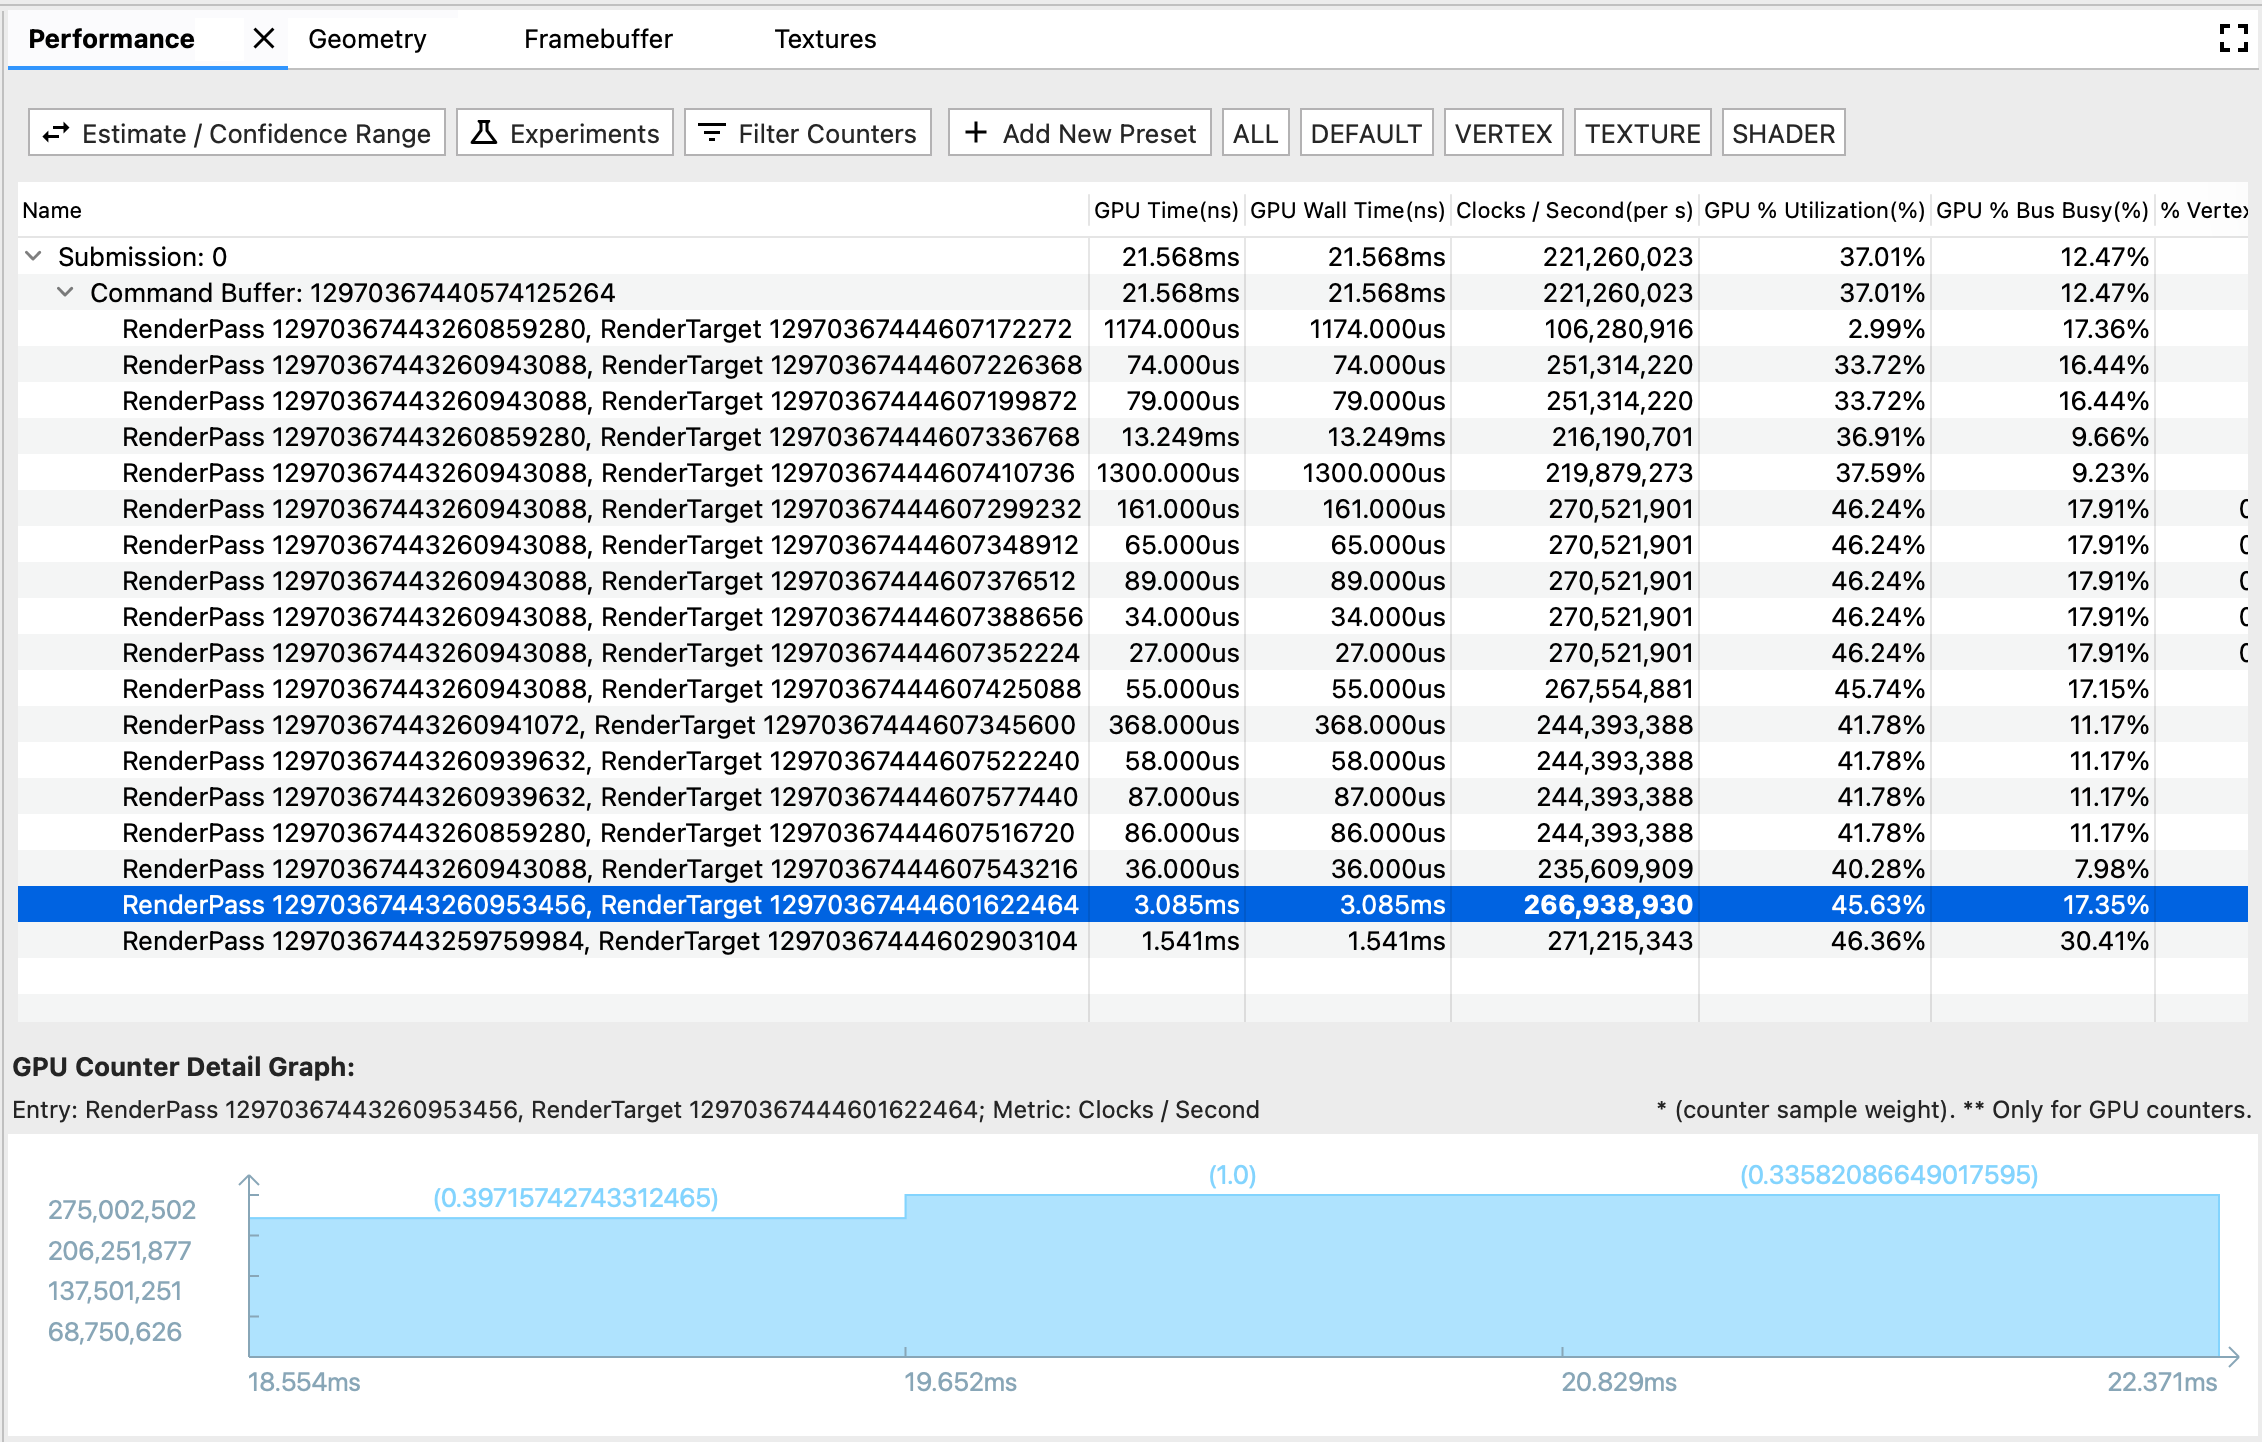
Gambar 1. Panel performa
Panel Performance menampilkan performa GPU untuk berbagai peristiwa rendering.
Ada tiga komponen dalam panel ini:
Toolbar: berisi tombol fungsional untuk menyesuaikan Tabel Performa
atau memulai eksperimen.
Tabel Performa: Tampilan tabel utama tab Performa. Setiap baris
mewakili peristiwa rendering, dan setiap kolom mewakili metrik GPU (waktu
GPU atau penghitung GPU). Dengan cara ini, sel numerik tertentu mewakili performa metrik GPU tertentu pada peristiwa rendering tertentu.
GPU Counter Detail Graph: menampilkan secara detail fluktuasi metrik GPU
selama waktu terjadinya peristiwa rendering. Grafik hanya dimuat ulang untuk
metrik penghitung GPU, tetapi tidak untuk metrik waktu GPU, karena metrik waktu
dapat menjelaskan dengan sendirinya dan tidak berfluktuasi seiring waktu.
Toolbar
Tombol Estimasi / Rentang Keyakinan: mengubah cara angka performa ditampilkan. Karena sampel penghitung GPU di-polling dengan kecepatannya sendiri, jangka waktunya mungkin tidak sempurna dengan jangka waktu peristiwa rendering. Jika tumpang tindih sebagian, mungkin ada beberapa interpretasi tentang seberapa banyak sampel penghitung berkontribusi pada peristiwa rendering, mulai dari kontribusi nol hingga kontribusi penuh. Berdasarkan kasus ekstrem, kami menghitung Confidence Range; dan berdasarkan bobot waktu yang tumpang-tindih, kami menghitung Estimate.
Experiment: membuka dialog untuk memilih eksperimen yang ingin
dijalankan. AGI memberi Anda opsi untuk mencoba beberapa praktik pengoptimalan umum tanpa perlu mengompilasi ulang aplikasi. Saat Anda memulai eksperimen,
AGI akan memutar ulang frame berdasarkan setelan baru, dan memperbarui tabel
performa GPU sebagaimana mestinya.
Filter Penghitung: membuka dialog untuk memilih kolom metrik yang ingin Anda tampilkan di Tabel Performa.
Panel Preset: disusun oleh tombol Add New Preset dengan tombol
preset yang disesuaikan berikut. Preset adalah kombinasi standar metrik GPU. Saat Anda mengklik tombol preset, Tabel Performa menampilkan
daftar yang difilter berisi metrik yang telah ditentukan sebelumnya. Anda juga dapat mengelola preset dalam
dialog Add New Preset.
Tabel Performa
Tabel ini tertaut dengan panel Profile dan panel Command. Peristiwa rendering memiliki tiga format representasi dalam sebuah rekaman aktivitas: baris di panel Performance, bagian di panel Profile, dan node di panel Command. Untuk mempermudah penjelajahan, saat Anda memilih salah satu format, dua format lainnya juga akan disorot. Misalnya, jika menginginkan potongan terpanjang di panel Profil, Anda dapat memilihnya, dan membuka baris Performa yang ditandai untuk melihat performa penghitung GPU mendetail untuk peristiwa ini.
Grafik detail penghitung GPU
Sumbu x menunjukkan stempel waktu sampel penghitung. Perhatikan bahwa waktu didasarkan pada waktu mulai peristiwa rendering pertama, jadi terkadang Anda mungkin melihat stempel waktu negatif di grafik detail penghitung untuk sampel penghitung pertama, yang sebagian tumpang-tindih dengan peristiwa rendering pertama.
Sumbu y menunjukkan nilai performa metrik sampel penghitung.
Angka dalam tanda kurung di atas setiap batang menunjukkan berat sampel penghitung, atau seberapa besar kontribusi yang kita anggap diberikan sampel terhadap peristiwa rendering, dalam skenario yang diperkirakan.
Konten dan contoh kode di halaman ini tunduk kepada lisensi yang dijelaskan dalam Lisensi Konten. Java dan OpenJDK adalah merek dagang atau merek dagang terdaftar dari Oracle dan/atau afiliasinya.
Terakhir diperbarui pada 2025-07-27 UTC.
[null,null,["Terakhir diperbarui pada 2025-07-27 UTC."],[],[],null,["# Performance pane\n\n**Figure 1.**Performance pane\n\nThe **Performance** pane displays GPU performance for different rendering events.\n\nThere are three components in this pane:\n\n- Toolbar: contains functional buttons for customizing the **Performance Table** or kicking off an experiment.\n- **Performance Table** : **Performance** tab's main tabular view. Each row represents a rendering event, and each column represents a GPU metric (GPU time or GPU counter). In this way, a specific numerical cell represents the specific GPU metric's performance at the specific rendering event.\n- **GPU Counter Detail Graph**: displays in detail how a GPU metric fluctuates during the time when a rendering event happens. The graph only refreshes for GPU counter metrics but not for GPU time metrics, since the time metric is self-explaining and doesn't fluctuate with time.\n\nToolbar\n-------\n\n- **Estimate / Confidence Range** button: toggles how the performance number is shown. Since GPU counter samples are polled at their own pace, its timeframe may not align perfectly with a rendering event's timeframe. When they are partially overlapped, there may be multiple interpretations of how much the counter sample contributes to the rendering event, ranging from zero contribution to full contribution. Based on the edge cases, we calculated the **Confidence Range** ; and based on overlapped time's weight, we calculated the **Estimate**.\n- **Experiment**: opens a dialog for choosing the experiment you'd like to run. AGI give you options to try out some common optimization practices with no need of re-compiling your application. When you kick off an experiment, AGI replays the frame based with the new setting, and update the GPU performance table accordingly.\n- **Filter Counters** : opens a dialog for choosing which metric columns you'd like to show in the **Performance Table**.\n- **Presets Bar** : composed by an **Add New Preset** button with following customized preset buttons. A preset is a pre-defined combination of GPU metrics. When you click a preset button, the **Performance Table** shows a filtered list of the pre-defined metrics. You can also manage presets in the **Add New Preset** dialog.\n\nPerformance Table\n-----------------\n\nThis table links with **Profile** pane and **Command** pane. A rendering event has three representation formats in a trace: a row in **Performance** pane, a slice in **Profile** pane, and a node in **Command** pane. To make it easier for browsing, when you select either one of the formats, the other two are highlighted as well. For example, if you are interested in the longest slice in **Profile** pane, you could select it, and navigate to the highlighted **Performance** row to look at detailed GPU counter performances for this event.\n\nGPU counter detail graph\n------------------------\n\n- The x-axis shows counter samples' timestamps. Note that the time is based on the start time of the very first rendering event, so sometimes you may see negative timestamp in the counter detail graph for the first counter sample, which partially overlaps with the first rendering event.\n- The y-axis shows counter samples' metric performance value.\n- The parenthesized number above each bar shows the counter sample's weight, or how much contribution we consider the sample provides towards the rendering event, in the estimated scenario."]]