Koleksiyonlar ile düzeninizi koruyun
İçeriği tercihlerinize göre kaydedin ve kategorilere ayırın.
Şekil 1. Performans bölmesi
Performans bölmesi, farklı oluşturma etkinlikleri için GPU performansını gösterir.
Bu bölmede üç bileşen bulunur:
Araç Çubuğu: Performans Tablosu'nu özelleştirmek veya bir denemeyi başlatmak için işlevsel düğmeler içerir.
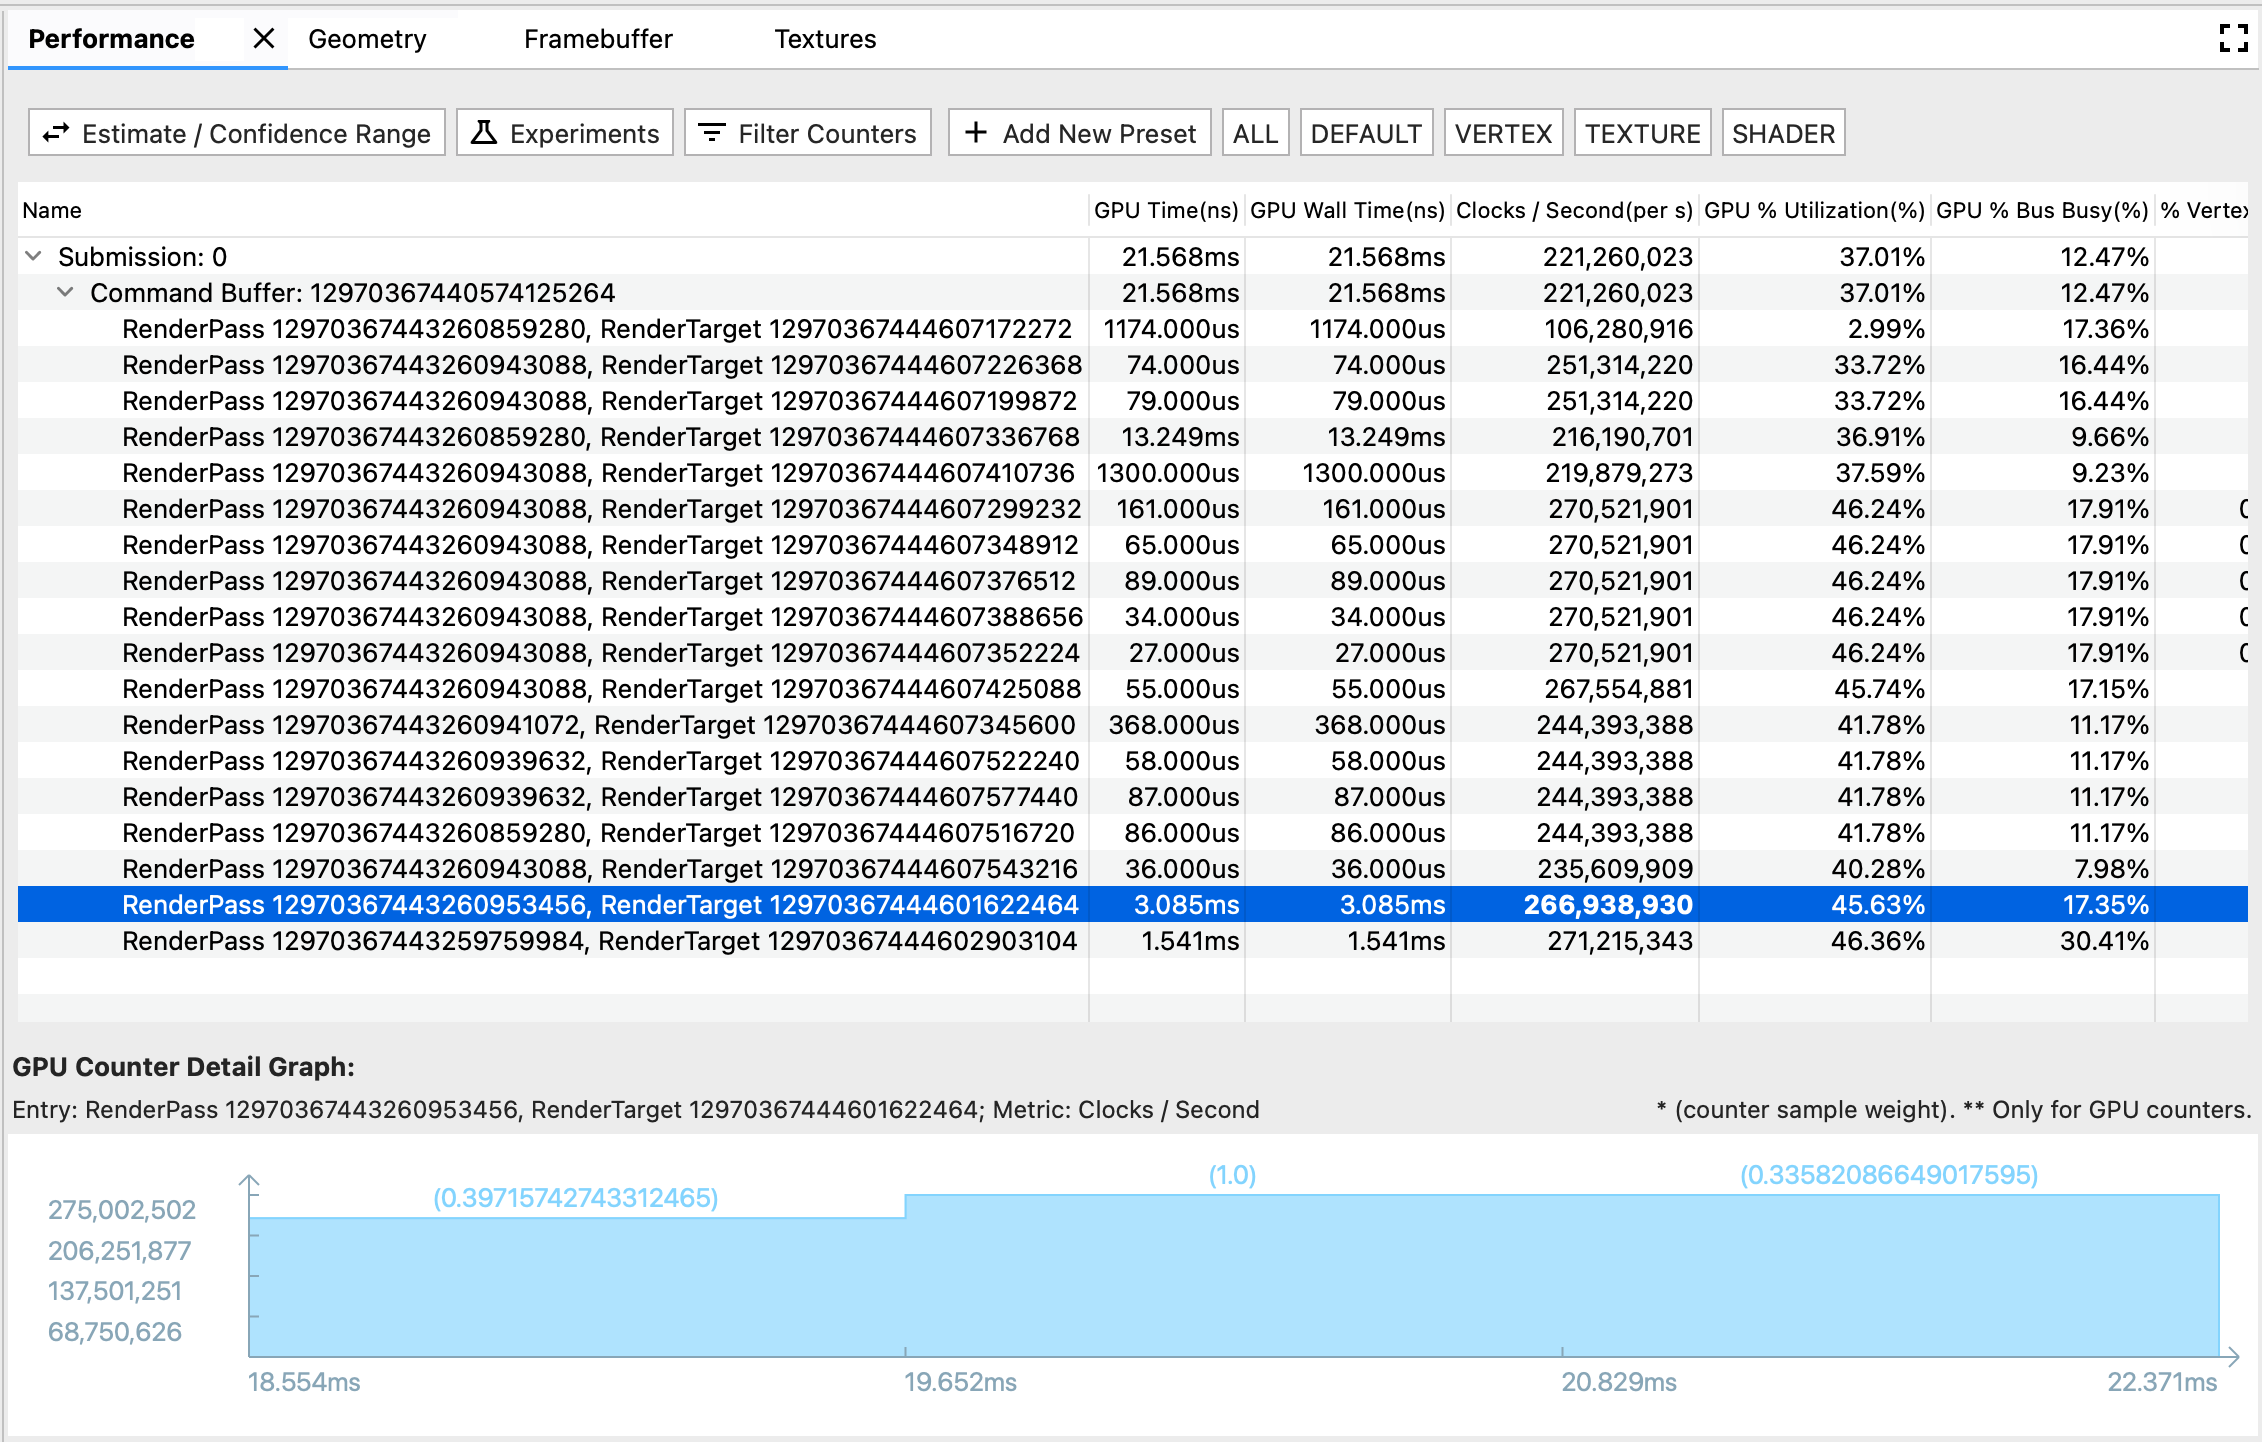
Performans Tablosu: Performans sekmesinin ana tablo görünümüdür. Her satır bir oluşturma etkinliğini, her sütun ise bir GPU metriğini (GPU süresi veya GPU sayacı) temsil eder. Bu şekilde, belirli bir sayısal hücre, belirli bir GPU metriğinin söz konusu oluşturma etkinliğindeki performansını temsil eder.
GPU Sayacı Ayrıntı Grafiği: Oluşturma etkinliği sırasında GPU metriğinin nasıl dalgalandığını ayrıntılı olarak gösterir. Grafik yalnızca GPU sayacı metrikleri için yenilenir ancak GPU süresi metrikleri için yenilenmez. Bunun nedeni, zaman metriğinin kendisini açıklayabilmesi ve zamanla dalgalanmamasıdır.
Araç çubuğu
Tahmin / Güven Aralığı düğmesi: Performans numarasının gösterilme şeklini değiştirir. GPU sayaç örnekleri kendi hızlarında sorgulandığından, zaman aralığı, oluşturma etkinliğinin zaman aralığıyla mükemmel şekilde uyumlu olmayabilir. Bunlar kısmen örtüştüğünde, sayaç örneğinin oluşturma etkinliğine ne kadar katkıda bulunduğuna dair, sıfır katkıdan tam katkıya kadar çeşitli şekillerde yorumlanabilir. Uç durumlara dayanarak Güven Aralığı'nı hesapladık ve çakışan zamanın ağırlığına dayanarak Tahmin'i hesapladık.
Deneme: Çalıştırmak istediğiniz denemeyi seçmeniz için bir iletişim kutusu açar. AGI, uygulamanızı yeniden derlemenize gerek kalmadan bazı yaygın optimizasyon uygulamalarını denemeniz için seçenekler sunar. Bir denemeyi başlattığınızda AGI, kareyi yeni ayara göre yeniden oynatır ve GPU performans tablosunu buna göre günceller.
Sayaçları Filtrele: Performans Tablosu'nda göstermek istediğiniz metrik sütunlarını seçmeniz için bir iletişim kutusu açar.
Hazır Ayar Çubuğu: Aşağıdaki özelleştirilmiş hazır ayar düğmeleriyle birlikte Yeni Hazır Ayar Ekle düğmesinden oluşur. Hazır ayar, GPU metriklerinin önceden tanımlanmış bir kombinasyonudur. Bir hazır ayar düğmesini tıkladığınızda, Performans Tablosu önceden tanımlanmış metriklerin filtrelenmiş bir listesini gösterir. Hazır ayarları Yeni Hazır Ayar Ekle
iletişim kutusunda da yönetebilirsiniz.
Performans Tablosu
Bu tablo, Profil bölmesi ve Komut bölmesiyle bağlanır. Oluşturma etkinliğindeki bir izde üç gösterim biçimi bulunur: Performans bölmesinde bir satır, Profil bölmesinde bir dilim ve Komut bölmesinde bir düğüm. Biçimlerden birini seçtiğinizde, daha kolay göz atabilmeniz için diğer ikisi de vurgulanır. Örneğin, Profil bölmesindeki en uzun dilimle ilgileniyorsanız bu dili seçip vurgulanan Performans satırına giderek bu etkinliğe ilişkin ayrıntılı GPU sayaç performanslarına bakabilirsiniz.
GPU sayacı ayrıntı grafiği
X ekseni, sayaç örneklerinin zaman damgalarını gösterir. Zamanın, ilk oluşturma etkinliğinin başlangıç zamanına göre belirlendiğini unutmayın. Bu nedenle, bazen ilk sayaç örneğinin sayaç ayrıntıları grafiğinde, ilk oluşturma etkinliğiyle kısmen örtüşen negatif zaman damgası görebilirsiniz.
Y ekseni, sayaç örneklerinin metrik performans değerini gösterir.
Her bir çubuğun üzerindeki parantez içindeki sayı, tahmini senaryoda sayaç örneğinin ağırlığını veya örneğin oluşturma etkinliğine ne kadar katkı sağladığını gösterir.
Bu sayfadaki içerik ve kod örnekleri, İçerik Lisansı sayfasında açıklanan lisanslara tabidir. Java ve OpenJDK, Oracle ve/veya satış ortaklarının tescilli ticari markasıdır.
Son güncelleme tarihi: 2025-07-27 UTC.
[null,null,["Son güncelleme tarihi: 2025-07-27 UTC."],[],[],null,["# Performance pane\n\n**Figure 1.**Performance pane\n\nThe **Performance** pane displays GPU performance for different rendering events.\n\nThere are three components in this pane:\n\n- Toolbar: contains functional buttons for customizing the **Performance Table** or kicking off an experiment.\n- **Performance Table** : **Performance** tab's main tabular view. Each row represents a rendering event, and each column represents a GPU metric (GPU time or GPU counter). In this way, a specific numerical cell represents the specific GPU metric's performance at the specific rendering event.\n- **GPU Counter Detail Graph**: displays in detail how a GPU metric fluctuates during the time when a rendering event happens. The graph only refreshes for GPU counter metrics but not for GPU time metrics, since the time metric is self-explaining and doesn't fluctuate with time.\n\nToolbar\n-------\n\n- **Estimate / Confidence Range** button: toggles how the performance number is shown. Since GPU counter samples are polled at their own pace, its timeframe may not align perfectly with a rendering event's timeframe. When they are partially overlapped, there may be multiple interpretations of how much the counter sample contributes to the rendering event, ranging from zero contribution to full contribution. Based on the edge cases, we calculated the **Confidence Range** ; and based on overlapped time's weight, we calculated the **Estimate**.\n- **Experiment**: opens a dialog for choosing the experiment you'd like to run. AGI give you options to try out some common optimization practices with no need of re-compiling your application. When you kick off an experiment, AGI replays the frame based with the new setting, and update the GPU performance table accordingly.\n- **Filter Counters** : opens a dialog for choosing which metric columns you'd like to show in the **Performance Table**.\n- **Presets Bar** : composed by an **Add New Preset** button with following customized preset buttons. A preset is a pre-defined combination of GPU metrics. When you click a preset button, the **Performance Table** shows a filtered list of the pre-defined metrics. You can also manage presets in the **Add New Preset** dialog.\n\nPerformance Table\n-----------------\n\nThis table links with **Profile** pane and **Command** pane. A rendering event has three representation formats in a trace: a row in **Performance** pane, a slice in **Profile** pane, and a node in **Command** pane. To make it easier for browsing, when you select either one of the formats, the other two are highlighted as well. For example, if you are interested in the longest slice in **Profile** pane, you could select it, and navigate to the highlighted **Performance** row to look at detailed GPU counter performances for this event.\n\nGPU counter detail graph\n------------------------\n\n- The x-axis shows counter samples' timestamps. Note that the time is based on the start time of the very first rendering event, so sometimes you may see negative timestamp in the counter detail graph for the first counter sample, which partially overlaps with the first rendering event.\n- The y-axis shows counter samples' metric performance value.\n- The parenthesized number above each bar shows the counter sample's weight, or how much contribution we consider the sample provides towards the rendering event, in the estimated scenario."]]