
Performance 窗格会显示不同渲染事件的 GPU 性能。
此窗格中包含三个组件:
- 工具栏:包含用于自定义效果表或启动实验的功能按钮。
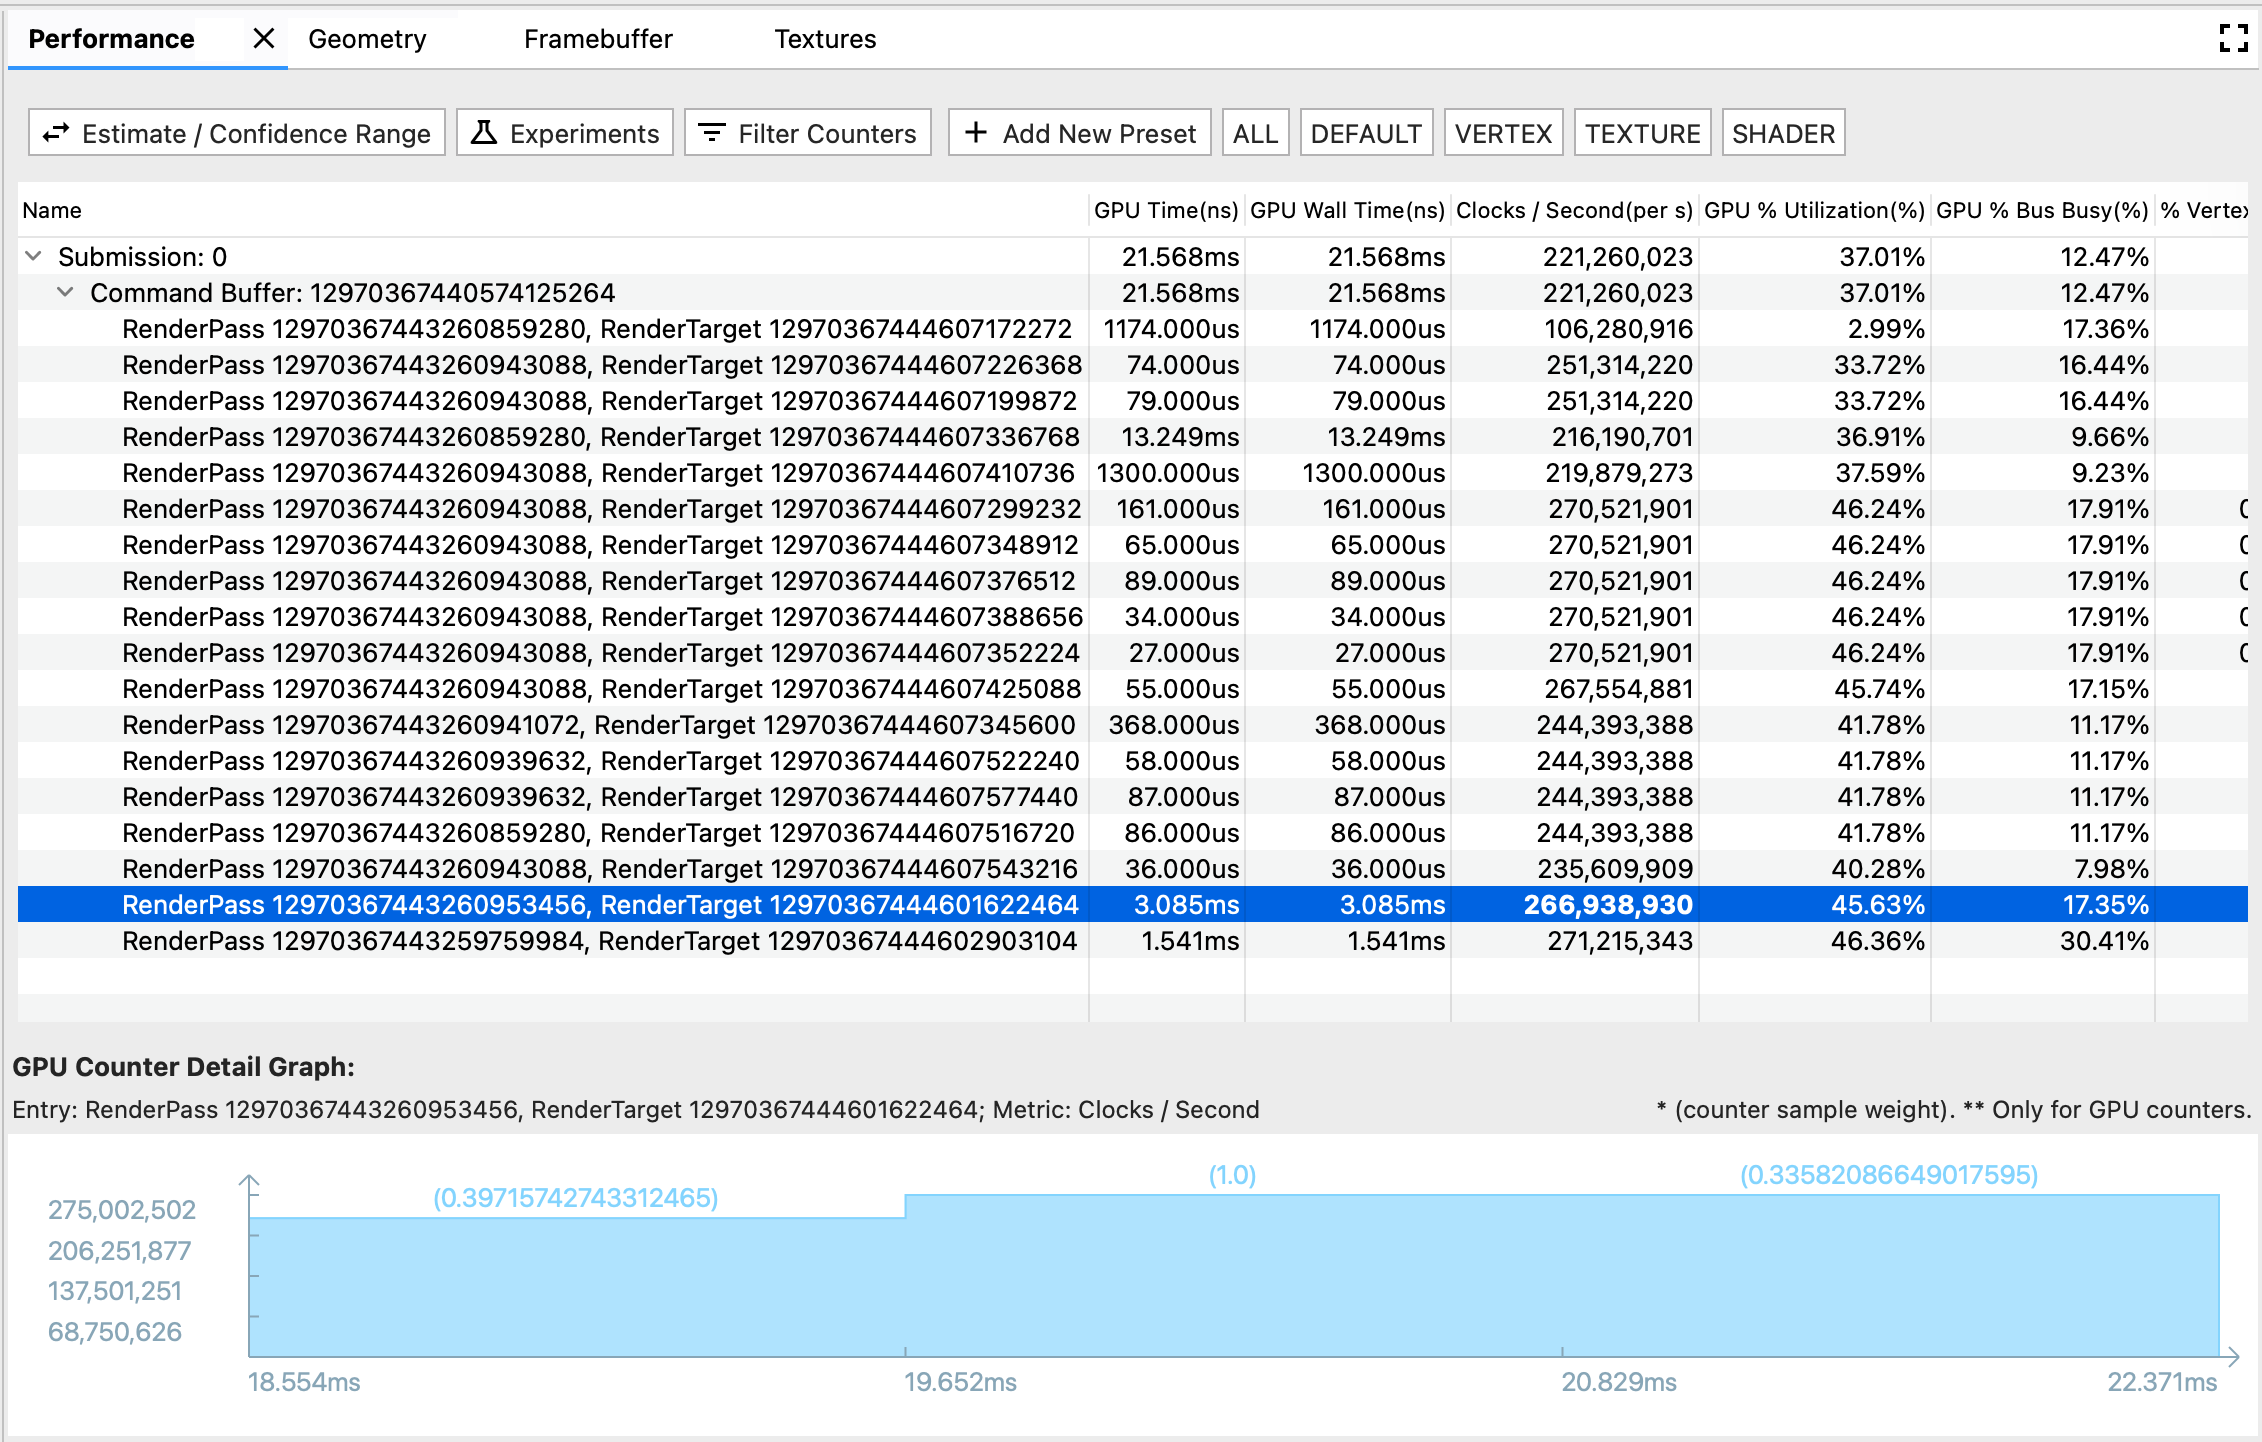
- 效果表格:效果标签页的主表格视图。每行代表一个渲染事件,每列代表一个 GPU 指标(GPU 时间或 GPU 计数器)。这样,特定数字单元格就表示特定渲染事件下特定 GPU 指标的性能。
- GPU 计数器详情图表:详细显示发生渲染事件时 GPU 指标的波动情况。图表仅针对 GPU 计数器指标刷新,而不会针对 GPU 时间指标进行刷新,因为时间指标不言自明,不会随时间而波动。
工具栏
- 估算 / 置信度范围按钮:切换性能数字的显示方式。由于 GPU 计数器样本按自己的速度进行轮询,因此其时间范围可能与渲染事件的时间范围并不完全一致。当它们部分重叠时,可能有多种解释,可解释计数器样本对呈现事件的影响程度,从零贡献到完全贡献不等。我们根据极端情况计算了置信度范围,并根据重叠时间的权重计算了估算。
- 实验:打开一个对话框,选择要运行的实验。AGI 提供了用于尝试一些常见优化做法的选项,让您无需重新编译应用。当您启动实验时,AGI 会根据新设置重放帧,并相应地更新 GPU 性能表。
- 过滤计数器:打开一个对话框,以选择要在性能表中显示的指标列。
- 预设栏:由添加新的预设按钮和下列自定义预设按钮组成。预设值是预定义的 GPU 指标组合。点击预设按钮后,效果表会显示经过过滤的预定义指标列表。您还可以在 Add New Preset 对话框中管理预设。
效果表格
下表链接到了配置文件窗格和命令窗格。渲染事件在轨迹中有三种表示格式:Performance 窗格中有一行,Profile 窗格中有一个 Slice,Command 窗格中有一个节点。为方便您浏览,当您选择其中一种格式时,系统会同时突出显示其他两种格式。例如,如果您对配置文件窗格中最长的切片感兴趣,则可以选择它,然后前往突出显示的性能行,以查看此事件的详细 GPU 计数器性能。
GPU 计数器详情图
- x 轴显示计数器样本的时间戳。请注意,该时间基于第一个渲染事件的开始时间,因此有时您可能会在第一个计数器样本的计数器详情图中看到负时间戳,该时间戳与第一个渲染事件部分重叠。
- y 轴显示的是计数器样本的指标性能值。
- 每个条形上方带括号的数字表示计数器样本的权重,即在估算的情况下,我们认为该样本对呈现事件的影响程度。