借助 AGI 帧性能分析器,您可以检查用于组成应用单个帧的各个渲染通道。它通过拦截并记录执行每个图形 API 调用所需的所有状态来实现此目的。在 Vulkan 上,该操作是使用 Vulkan 的分层系统以原生方式完成的。在 OpenGL 上,系统会使用 ANGLE 拦截命令,后者会将 OpenGL 命令转换为 Vulkan 调用,以便在硬件上执行这些命令。
Adreno 设备
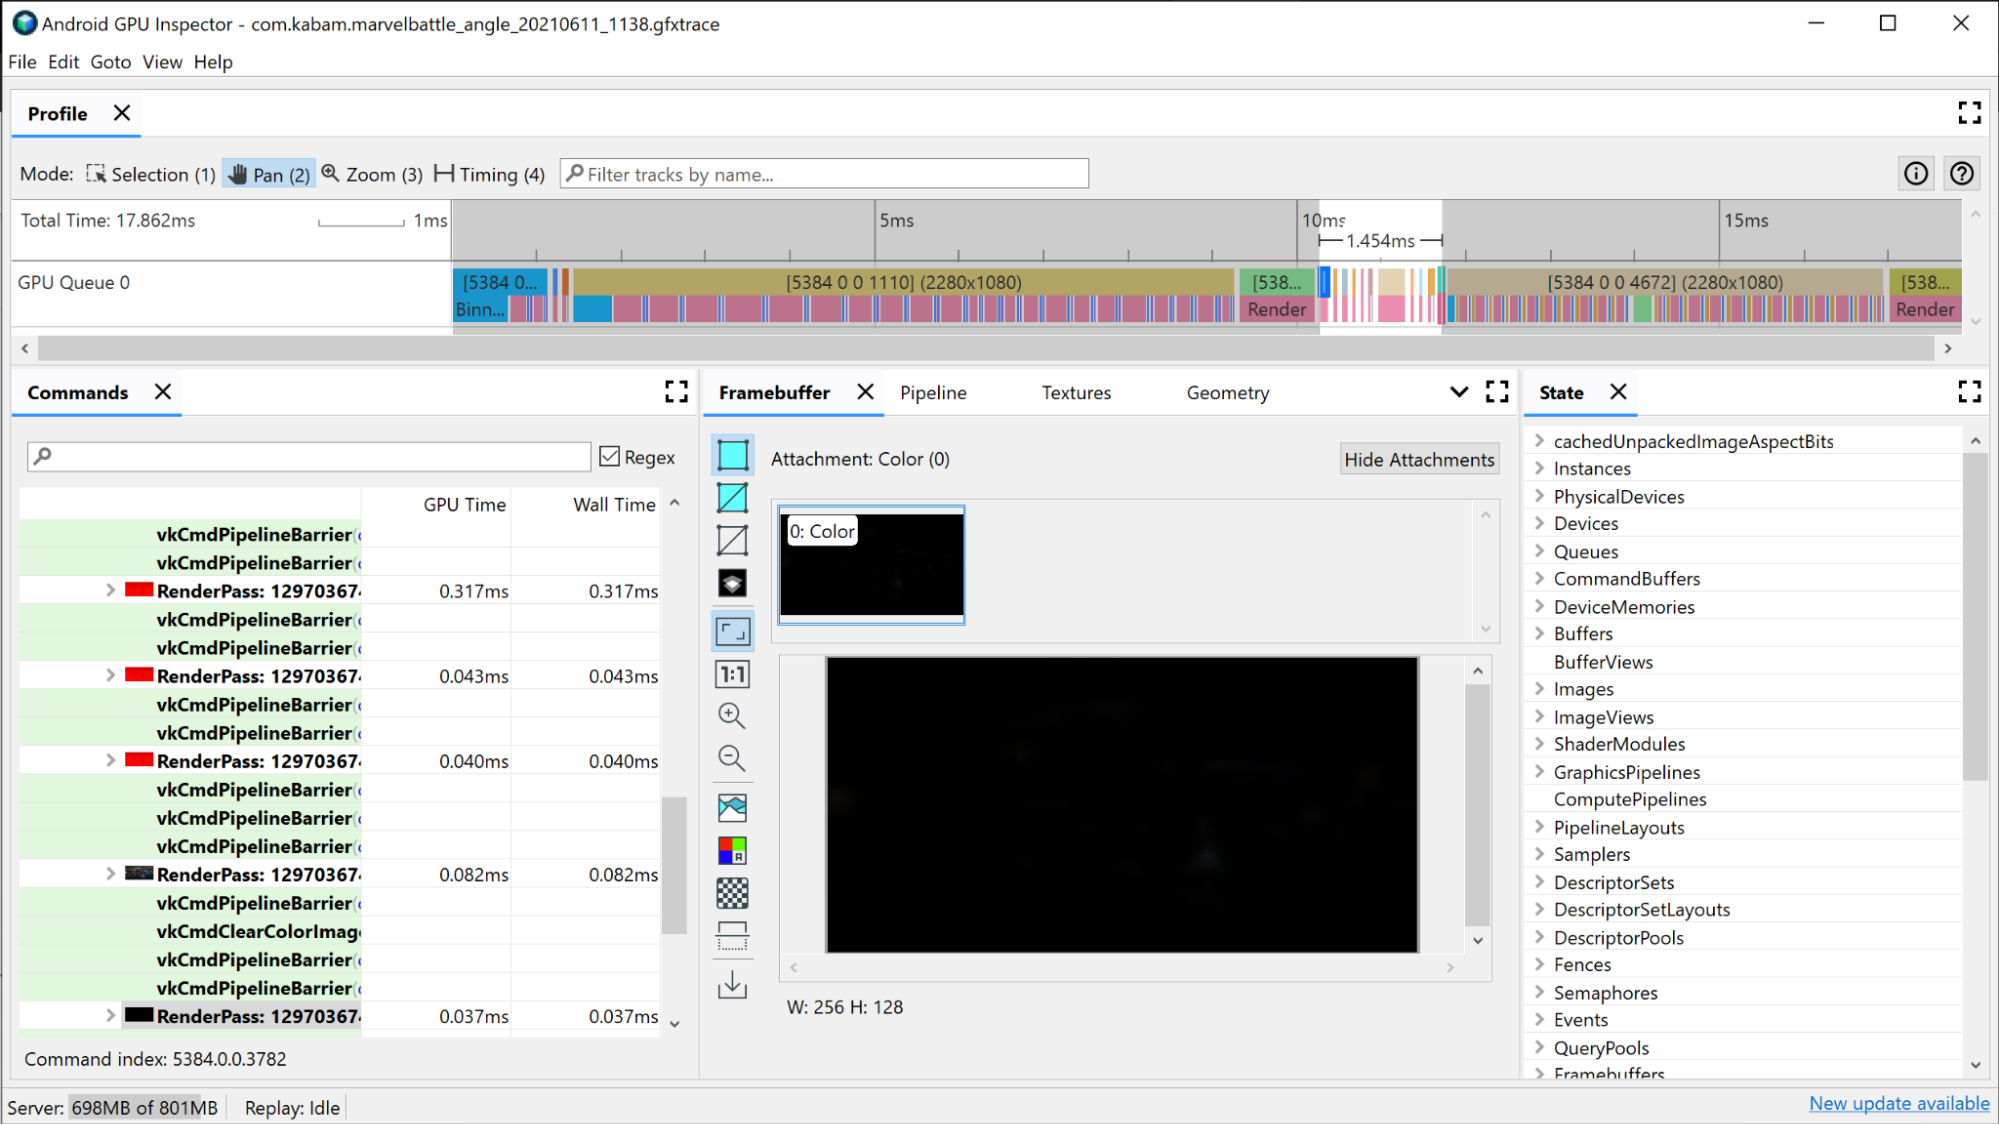
要确定开销高昂的渲染通道,请先查看窗口顶部的 AGI 时间轴视图。这将按时间顺序显示构成给定帧合成的所有渲染通道。此视图与包含 GPU 队列信息时在系统性能分析器中看到的视图相同。此外,它还提供关于渲染通道的基本信息(例如渲染到的帧缓冲区的分辨率),让您可以了解渲染通道本身发生的情况。
调查渲染通道的第一个条件是它们所花费的时间。最长的渲染通道很可能是最有改进潜力的渲染通道,所以先来看一下这个通道。
与相关渲染通道相关的 GPU 切片已经呈现了一些关于渲染通道中发生的情况的信息:
- 分箱:根据顶点在屏幕上落下的位置,将顶点放入分箱的位置
- 渲染:像素或片段被着色的部分
- GMEM 加载/存储:当帧缓冲区的内容从 GPU 内部内存加载或存储到主内存时
您可以查看每个瓶颈在渲染通道中花费的时间,充分了解潜在瓶颈可能在何处。例如:
- 如果分箱占用了大量时间,则表明存在顶点数据瓶颈,这表明顶点过多、大型顶点或与顶点相关的其他问题。
- 如果渲染占用了大部分时间,则表明渲染是瓶颈。可能的原因可能包括着色器复杂、纹理提取过多、在非必要情况下渲染到高分辨率帧缓冲区,或其他相关问题。
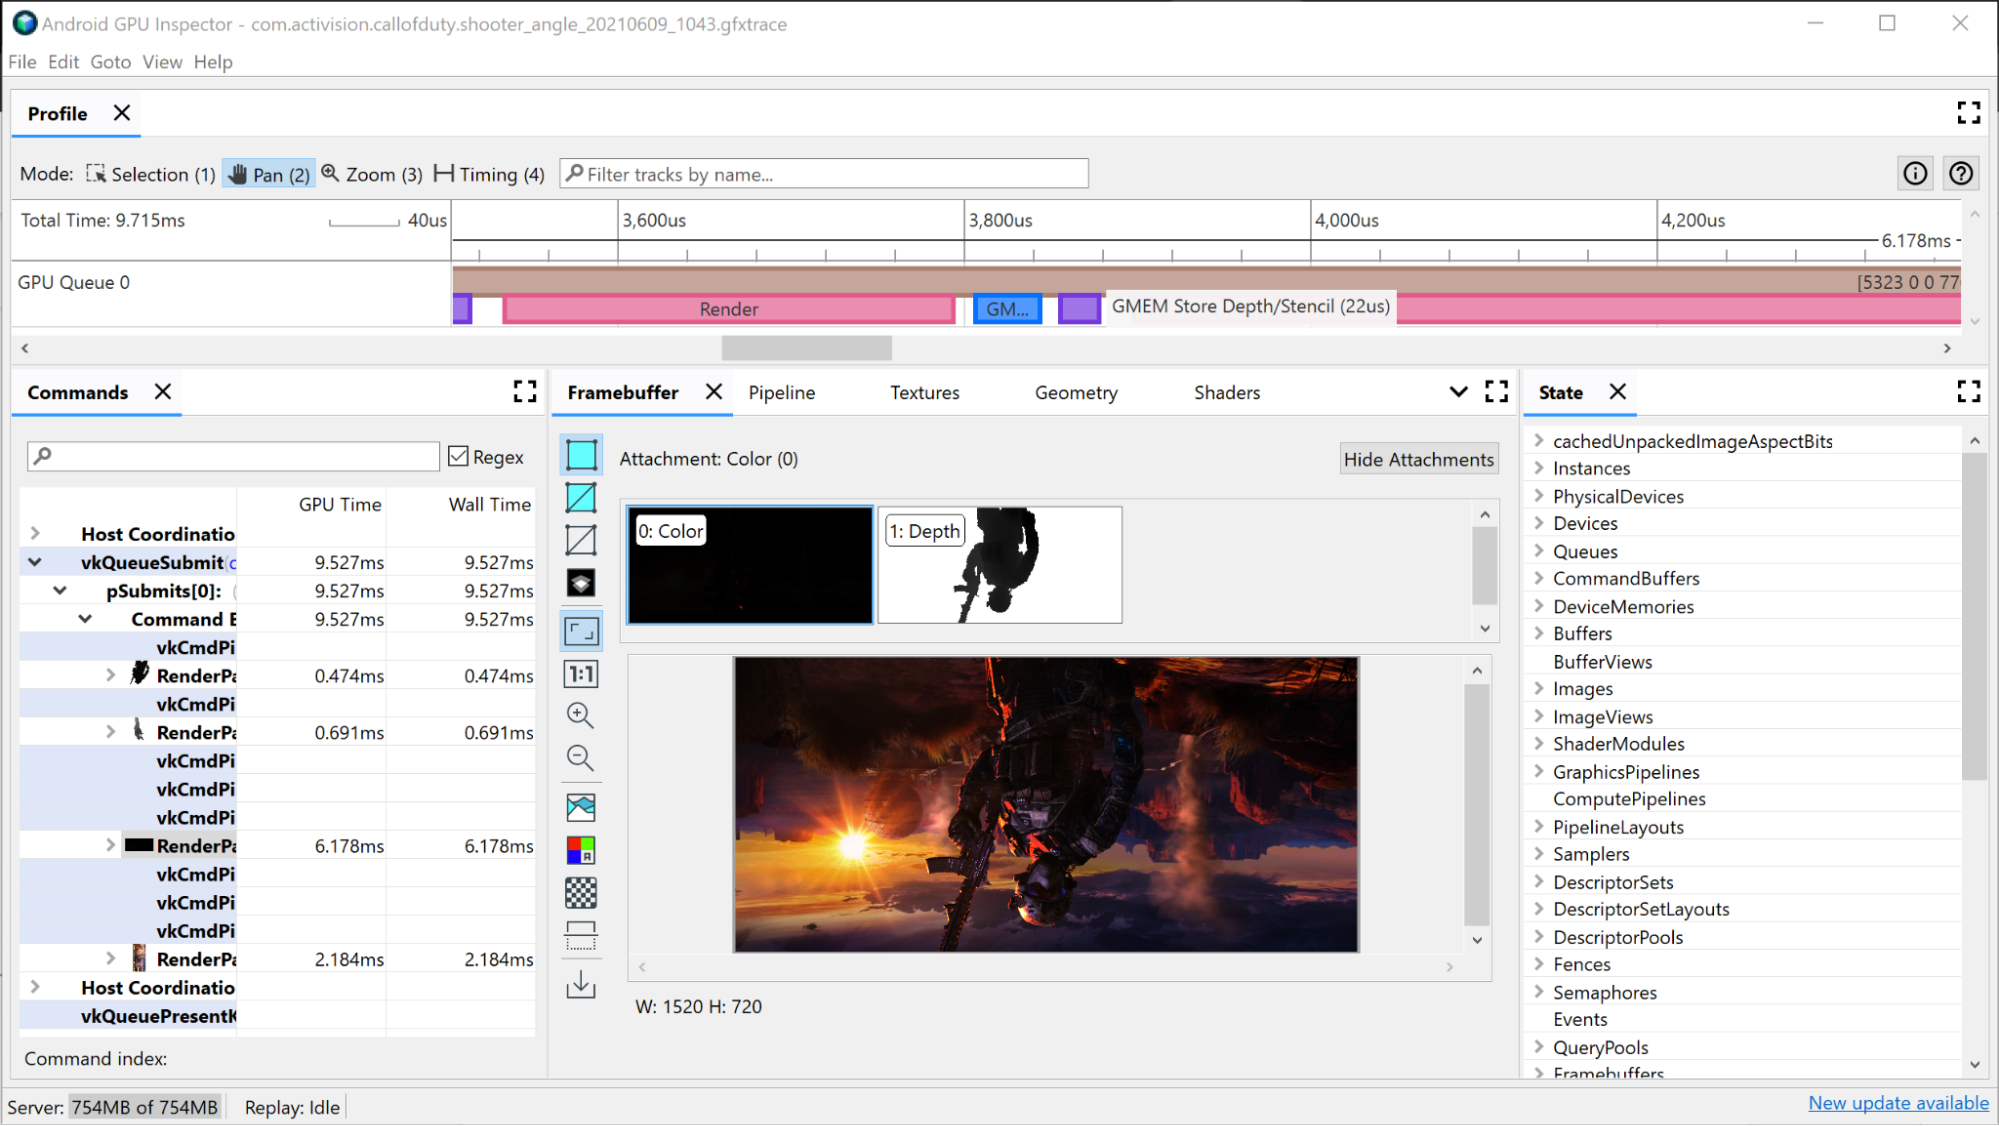
另外,请注意 GMEM 加载和存储。将内容从显存移到主内存的成本很高,因此,尽量减少加载或存储操作量也有助于提高性能。一个常见的示例是 GMEM 存储深度/模板,它会将深度/模板缓冲区写入主内存;如果您在未来的渲染通道中未使用该缓冲区,则可以消除此存储操作,从而节省帧时间和内存带宽。
大型渲染通道调查
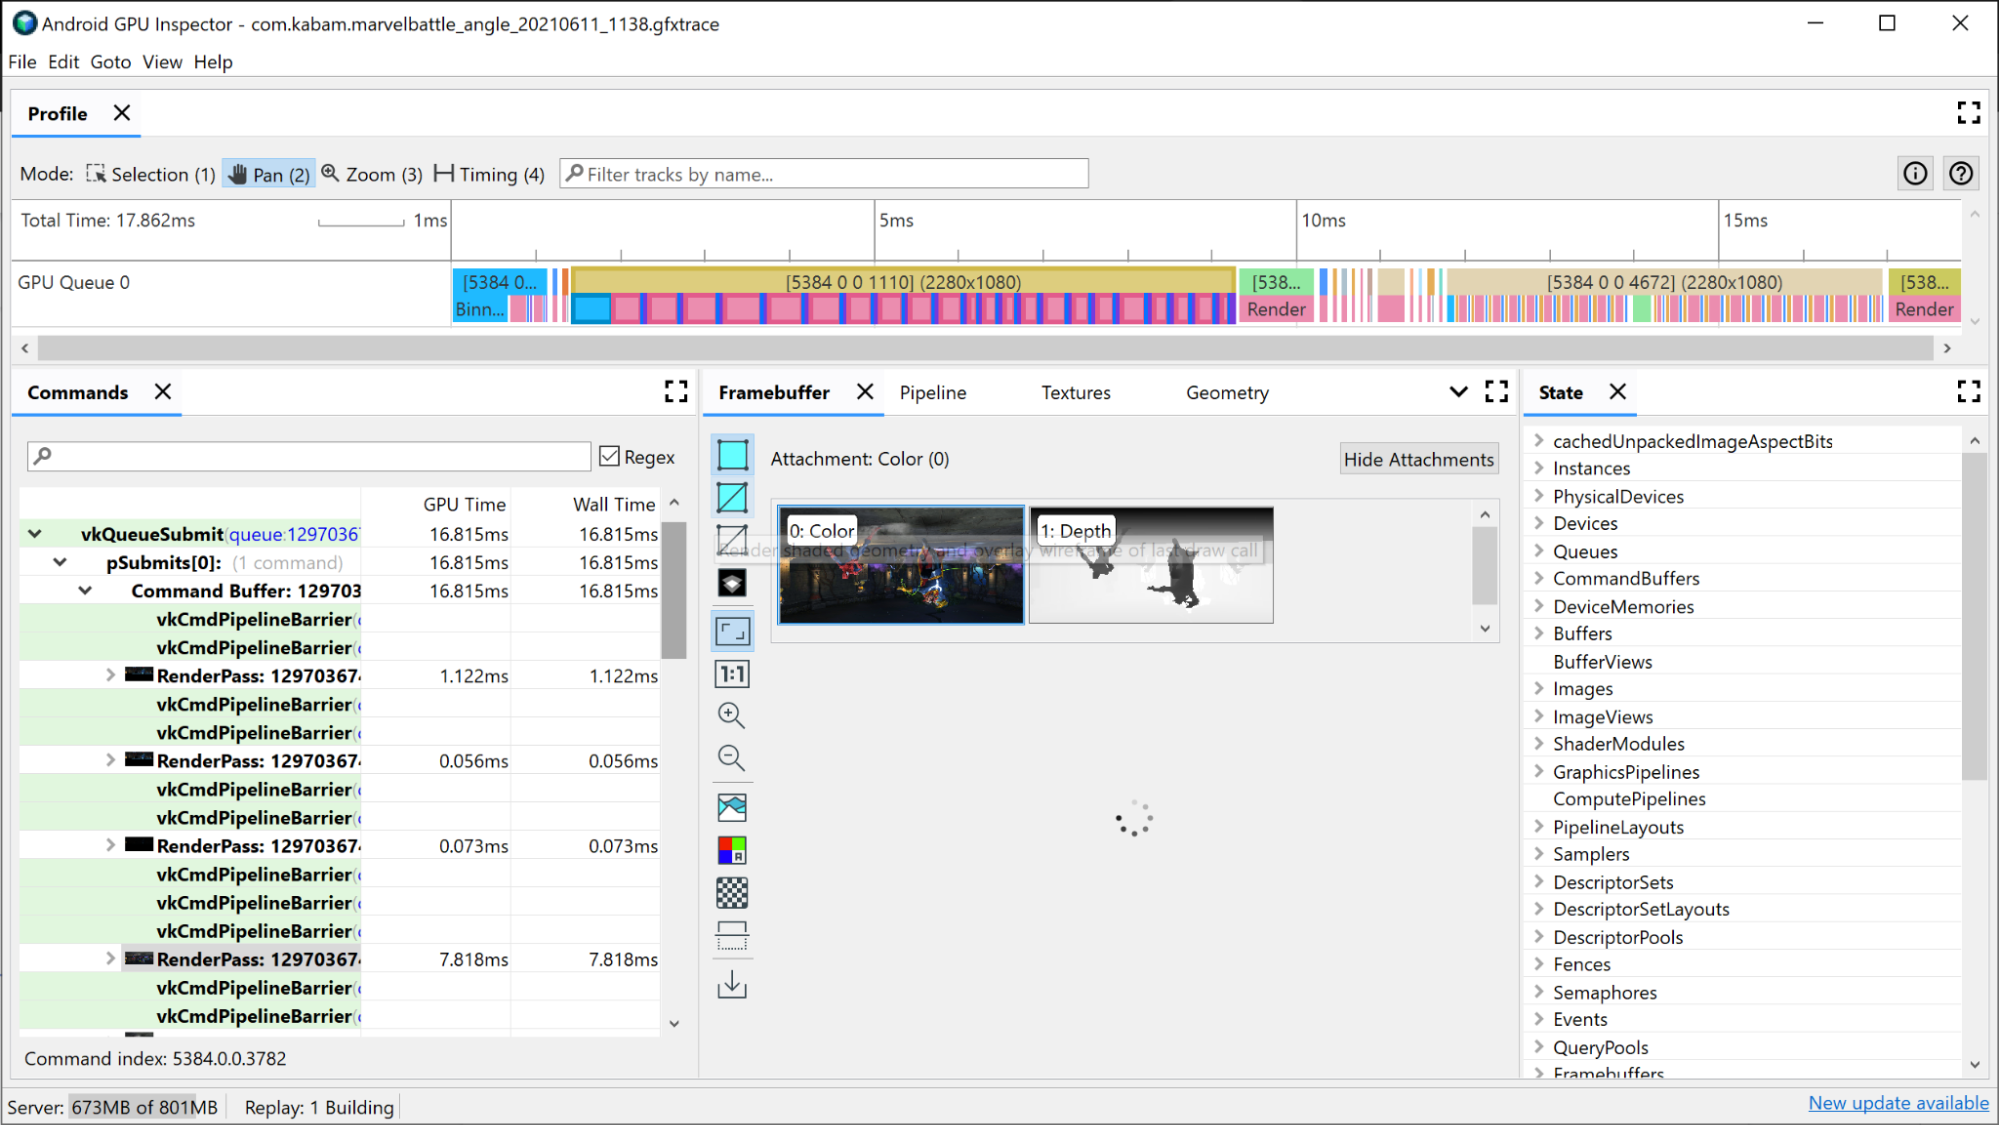
如需查看在渲染传递期间发出的所有单独绘制命令,请执行以下操作:
点击时间轴中的渲染通道。 此操作会在帧性能分析器的 Commands 窗格中的层次结构中打开渲染通道。
点击渲染通道的菜单,其中显示了渲染通道期间发出的所有单个绘制命令。如果是 OpenGL 应用,您可以更进一步,查看 ANGLE 发出的 Vulkan 命令。
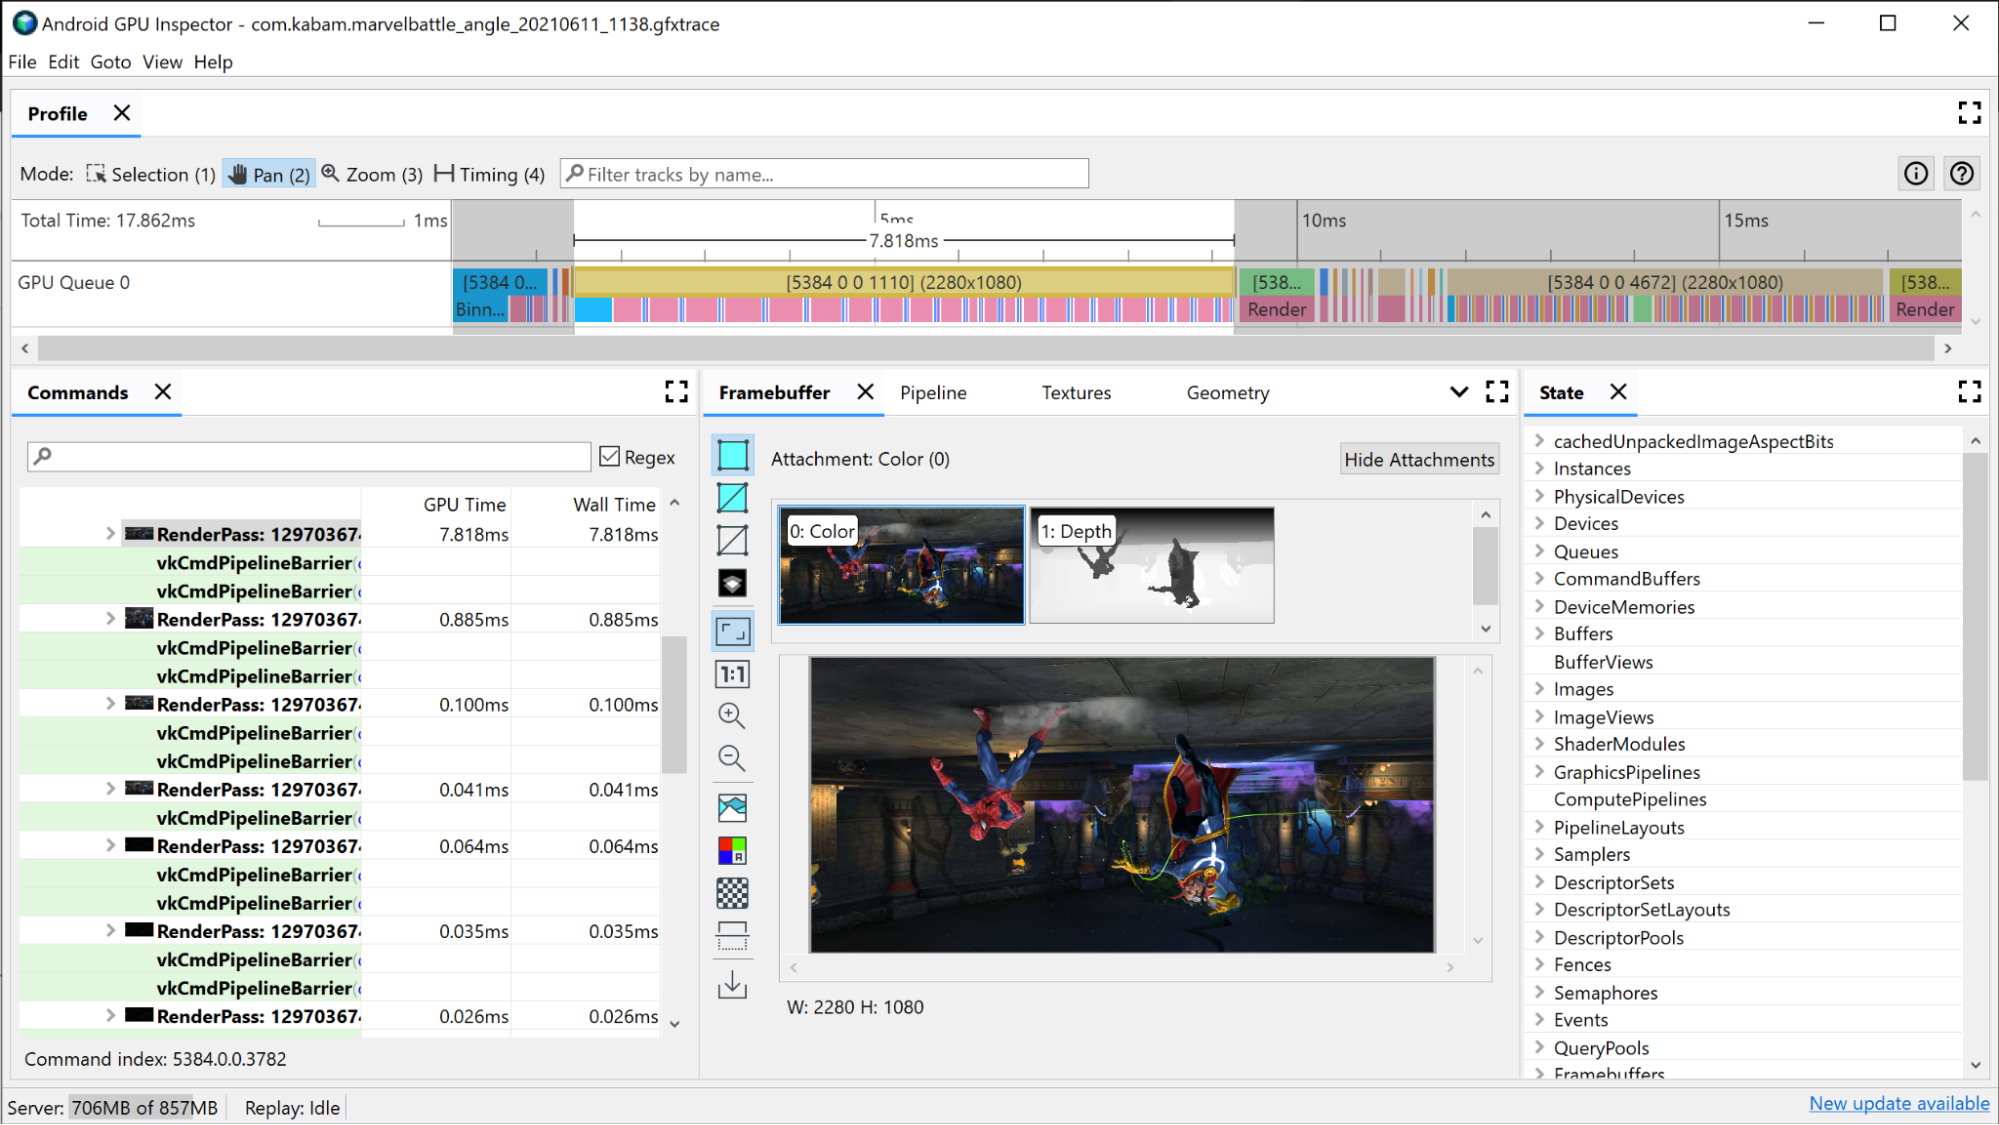
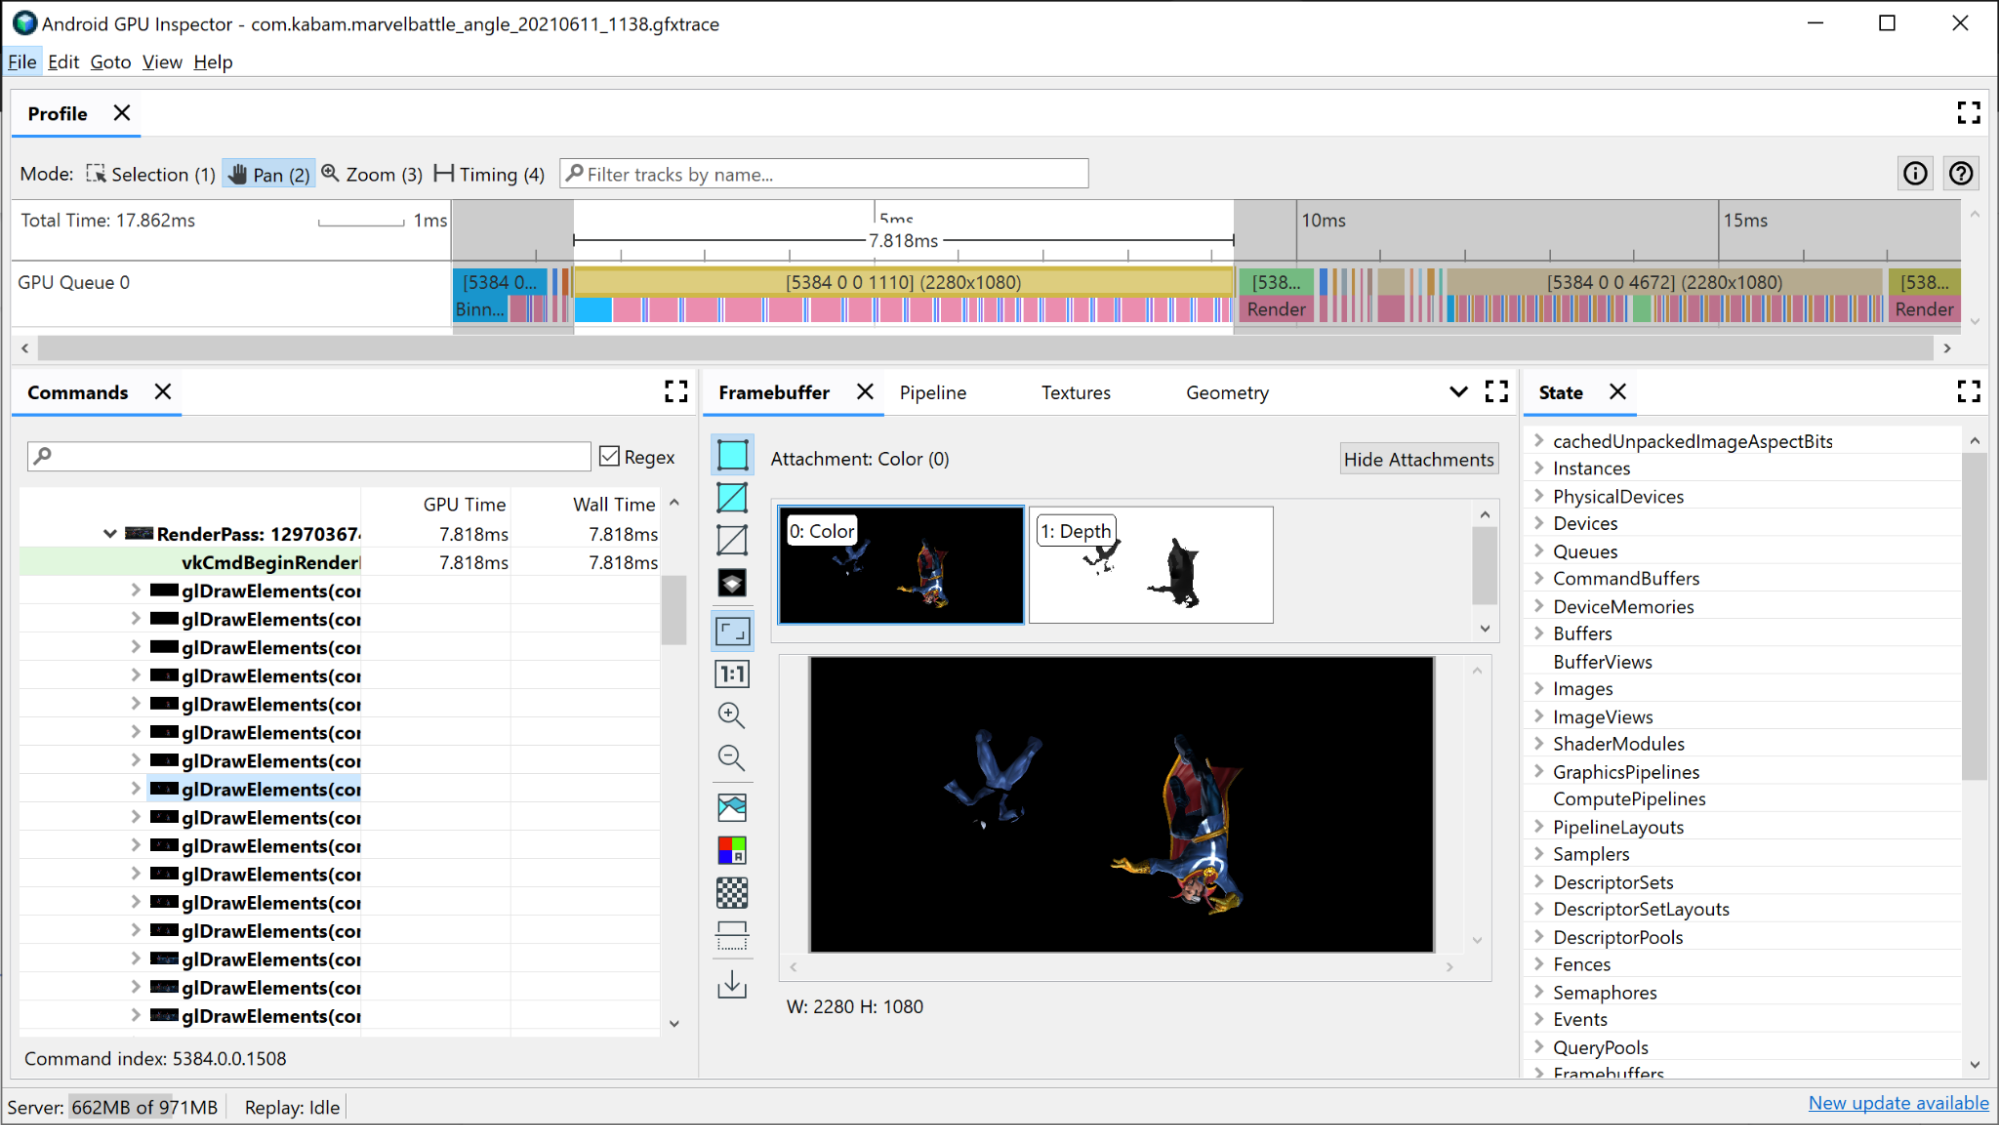
选择其中一个绘制调用。此时将打开 Framebuffer 窗格,其中会显示此次绘制期间绑定的所有帧缓冲区附件,以及在连接的帧缓冲区上绘制的最终结果。在这里,您还可以使用 AGI 打开上一个和下一个绘制调用,并比较两者之间的差异。如果两者在视觉上几乎完全相同,则表示有机会消除对最终图像没有影响的绘制调用。
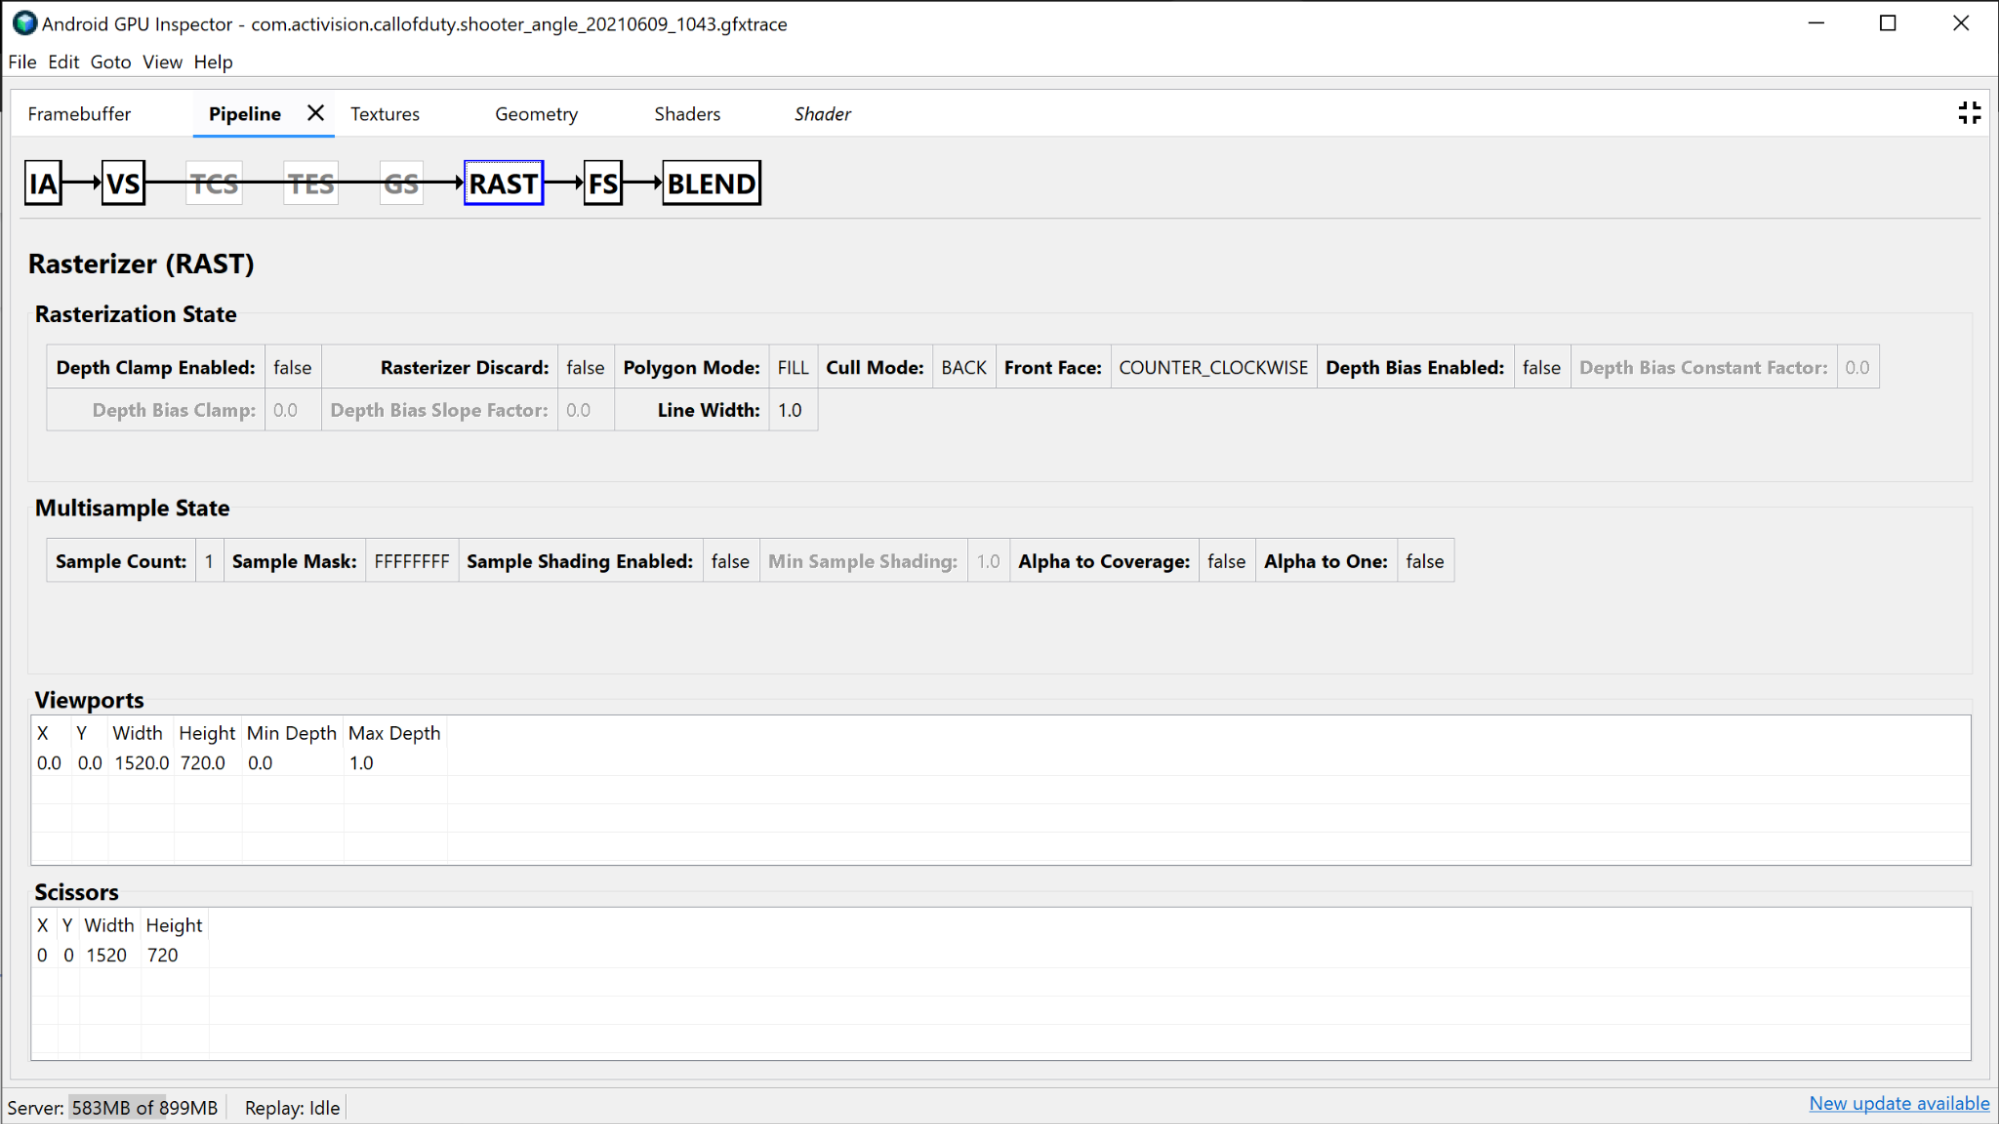
打开此绘制的 Pipeline 窗格会显示图形管道执行此绘制调用所使用的状态。
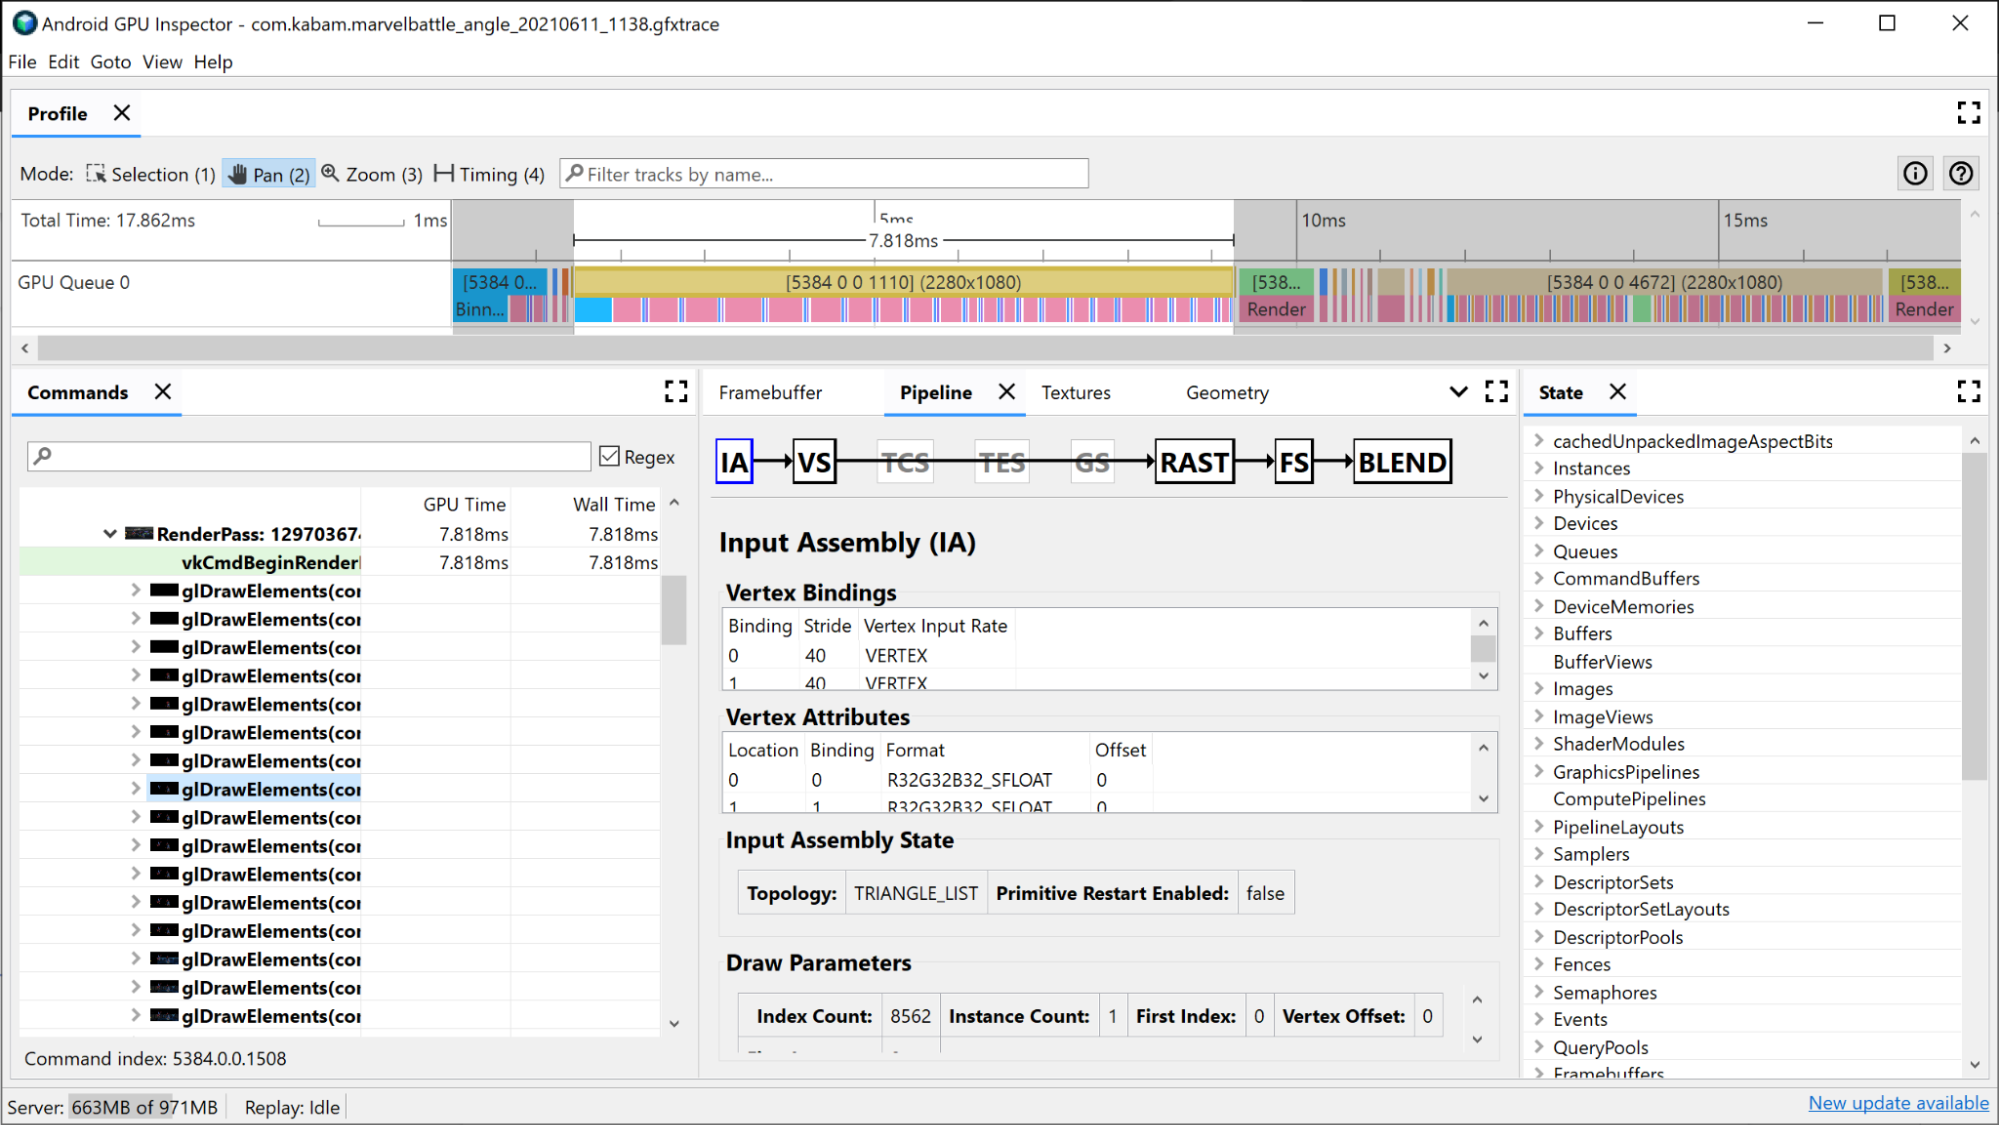
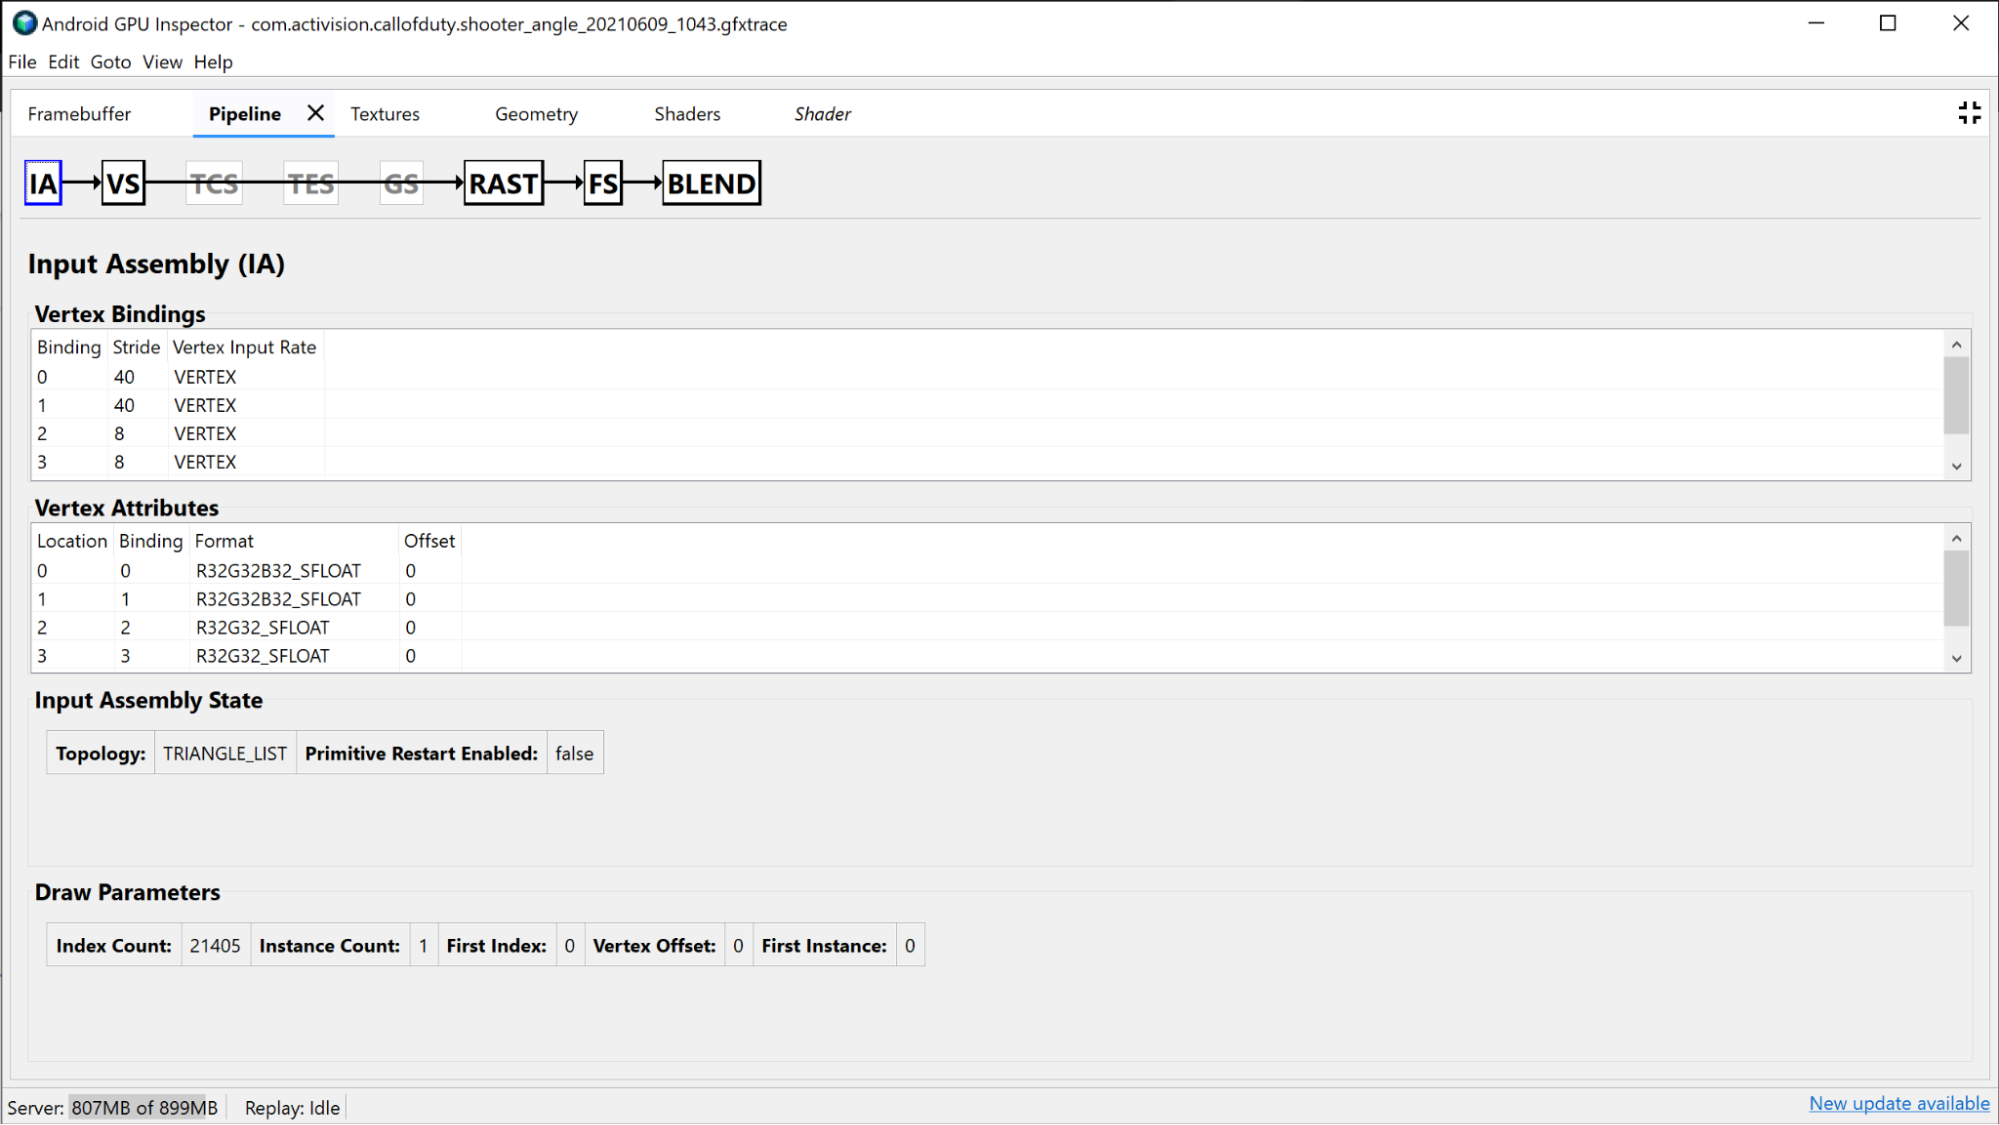
输入汇编器会提供有关顶点数据如何绑定到此绘制的信息。如果您注意到分箱占用了大量渲染时间,那么这个领域很有待研究;在这里,您可以获得有关顶点格式、绘制的顶点数以及顶点在内存中的布局的信息。如需了解详情,请参阅分析顶点格式。
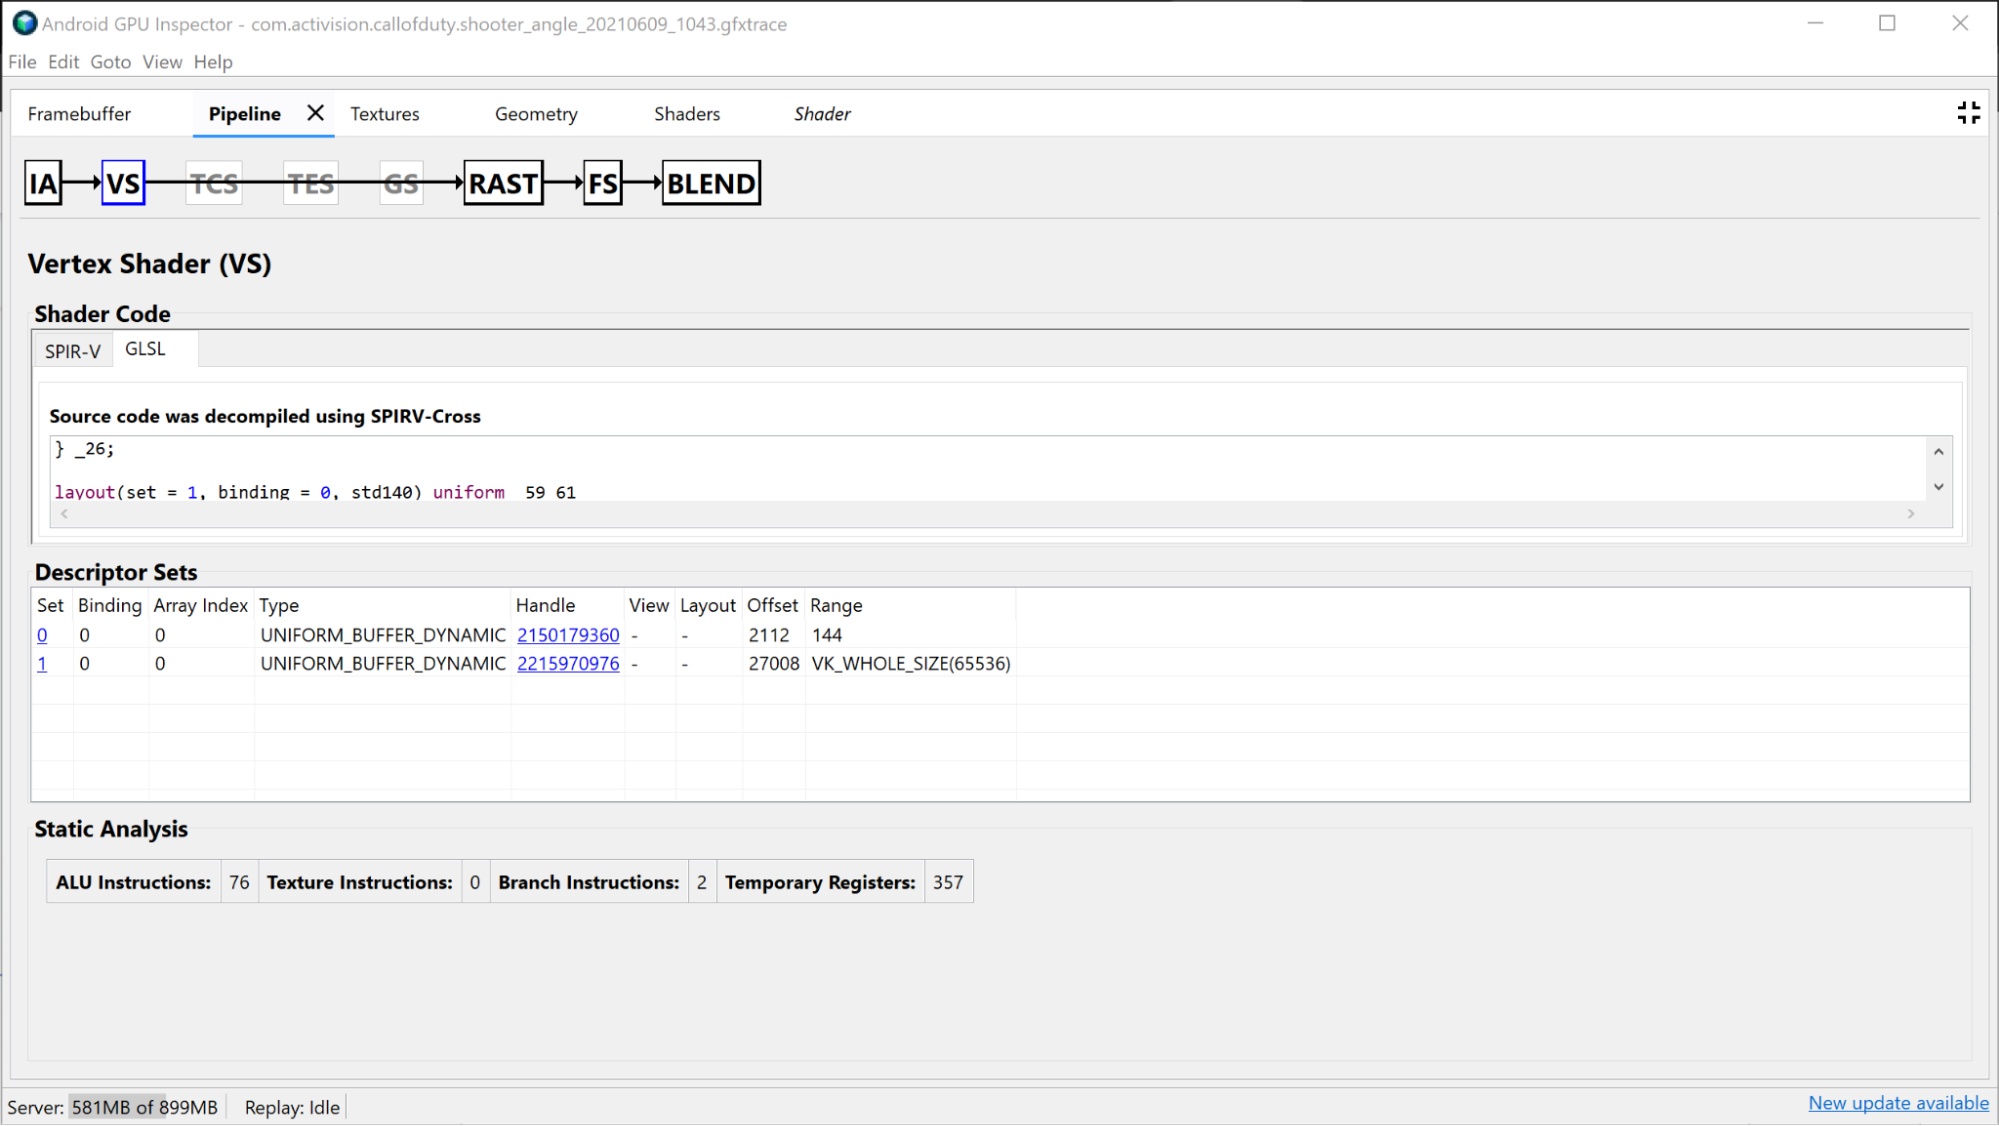
顶点着色器部分提供了您在此绘制期间使用的顶点着色器的相关信息,如果确定分箱是否是一个问题,您也可以查看该部分。您可以看到所用着色器的 SPIR-V 和反编译 GLSL,并调查此调用的绑定统一缓冲区。如需了解详情,请参阅分析着色器性能。
光栅器部分显示了有关流水线更固定函数设置的信息,并可用于调试固定函数状态(例如视口、剪刀、深度状态和多边形模式)。
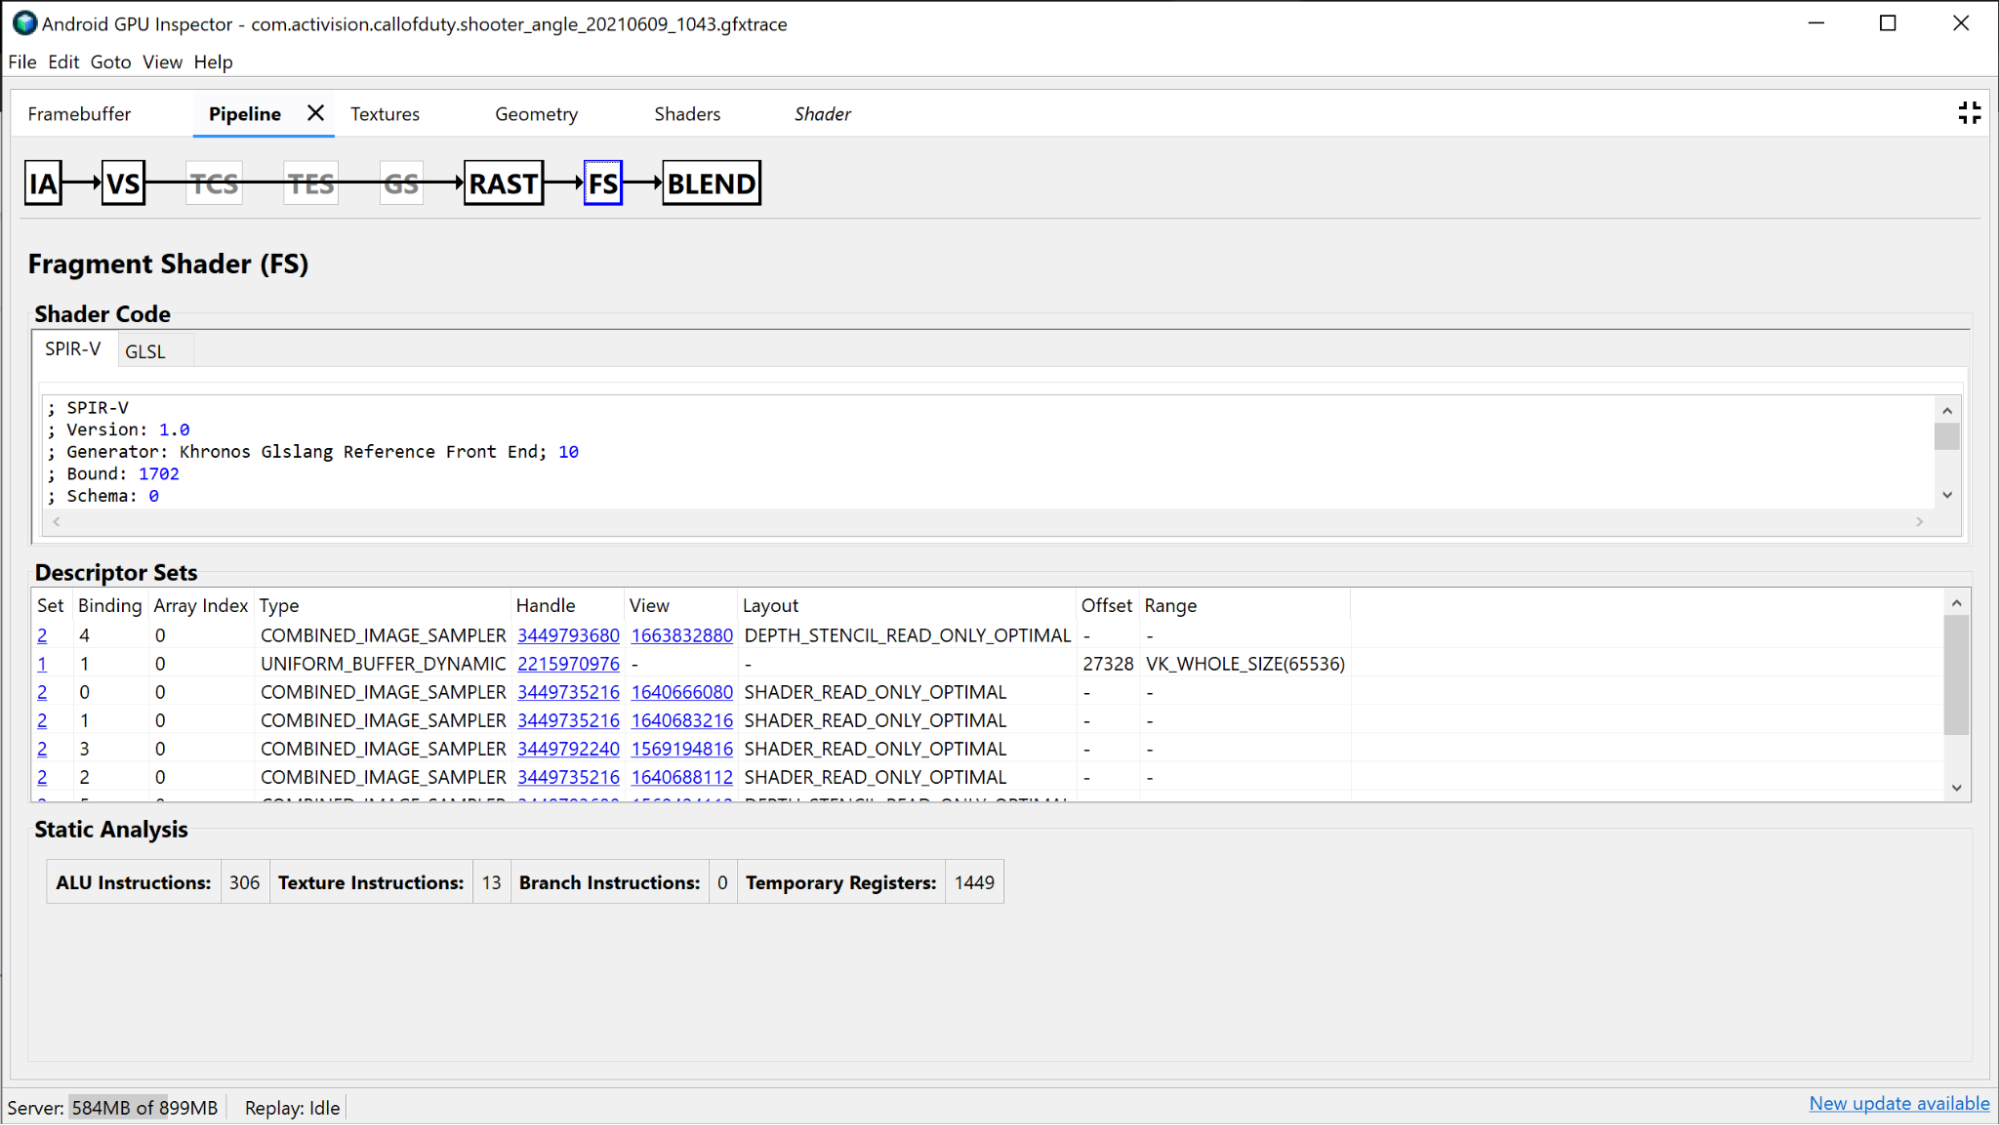
Fragment 着色器部分提供了许多与顶点着色器部分相同的信息,但这些信息是特定于 Fragment 着色器的信息。在本例中,您实际上可以查看正在绑定哪些纹理,只需点击手柄即可对它们进行调查。
缩小渲染通道调查
可用于提高 GPU 性能的另一个标准是查看成组的较小渲染通道。一般而言,您应尽可能减少渲染通道的数量,因为 GPU 需要一些时间才能将状态从一个渲染通道更新到另一个渲染通道。这些较小的渲染通道通常用于执行多种操作,例如生成阴影贴图、应用高斯模糊、估算亮度、进行后期处理效果,或渲染界面。其中一些图像可以合并到单个渲染通道中,甚至完全消除(如果它们对整体图像的影响不足以证明成本的合理性)。