تنظيم صفحاتك في مجموعات
يمكنك حفظ المحتوى وتصنيفه حسب إعداداتك المفضّلة.
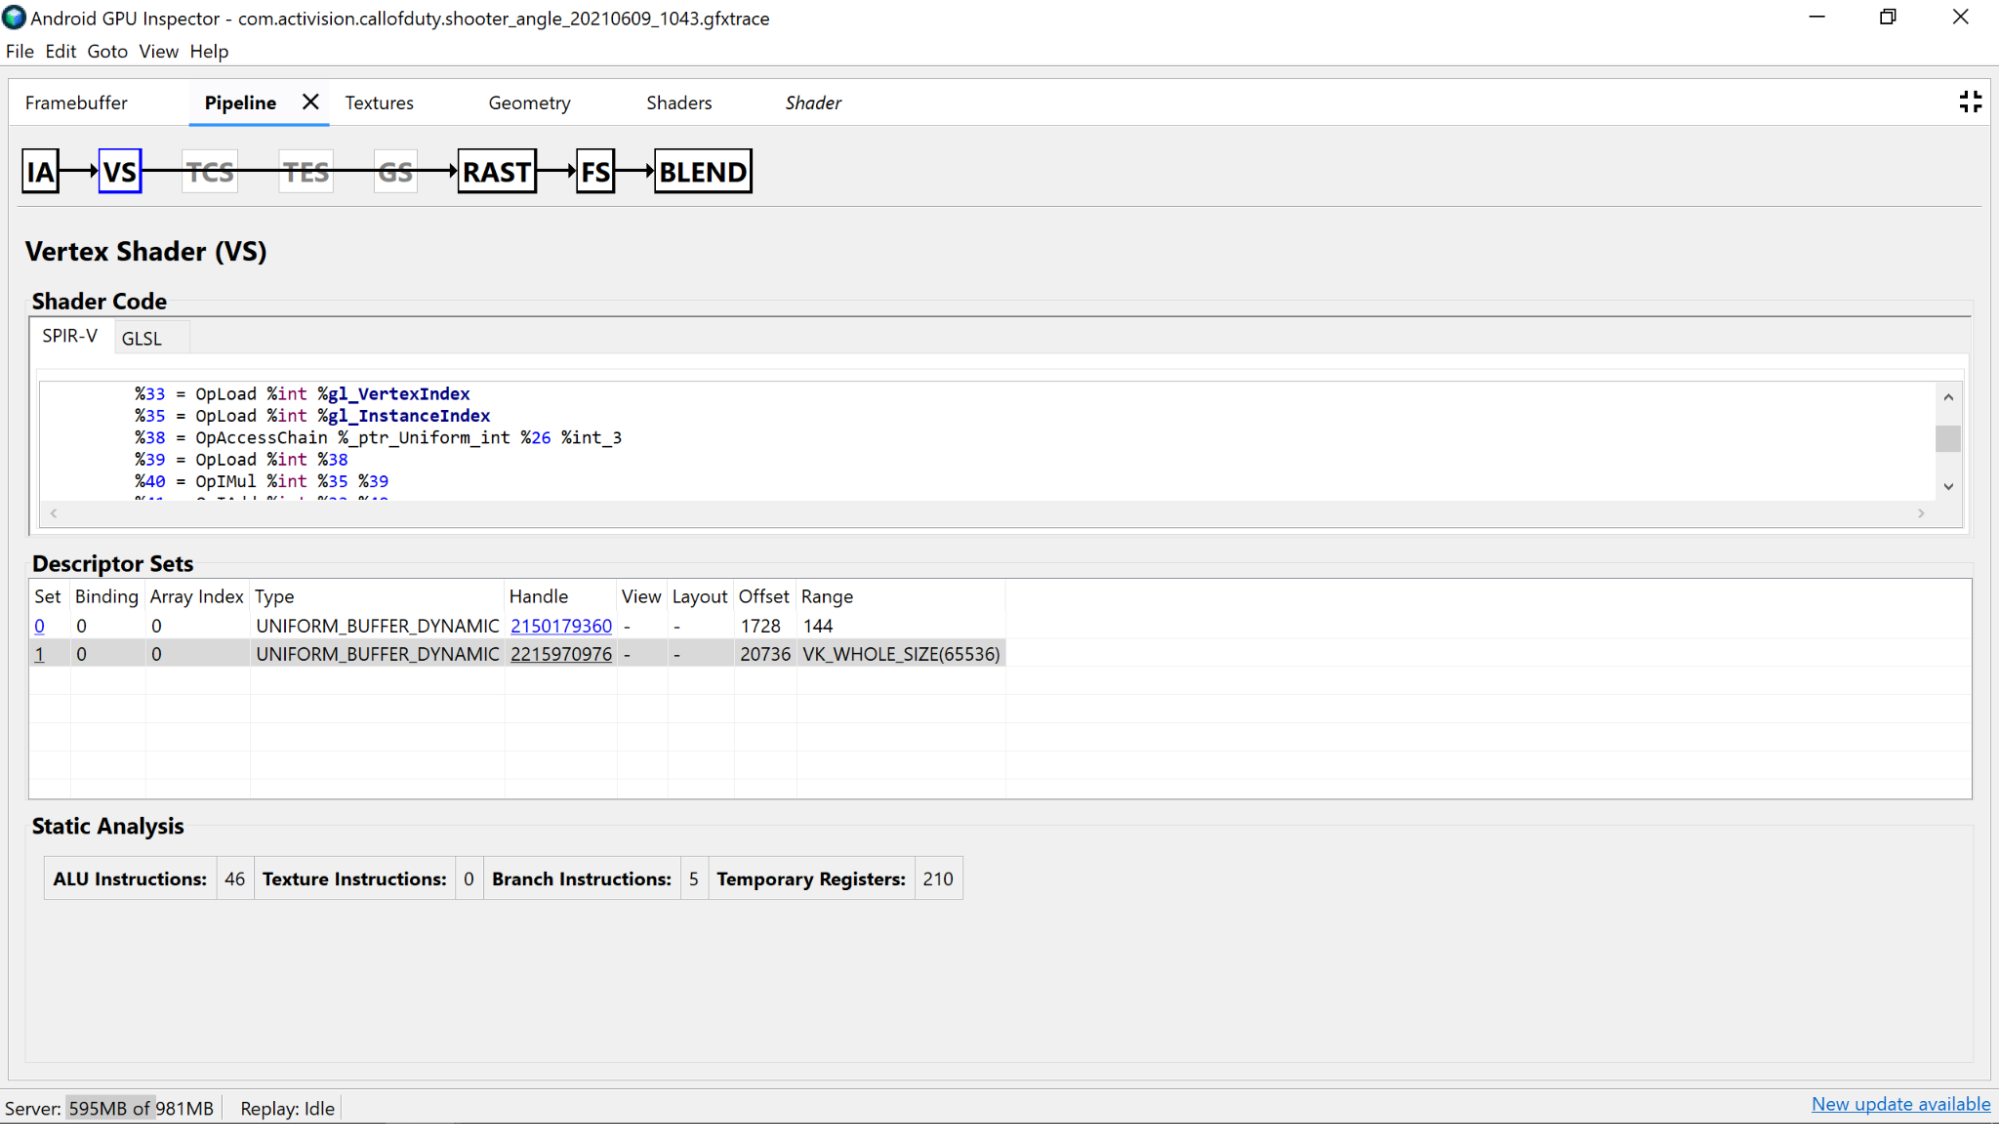
يتيح لك أداة تحليل إطارات AGI إمكانية فحص أدوات التظليل من خلال تحديد استدعاء رسم من إحدى بطاقات العرض التي نقدمها، والانتقال إما إلى قسم Vertex Shader أو قسم Fragment Shader من لوحة Pipeline.
يمكنك الاطّلاع هنا على إحصاءات مفيدة تستند إلى التحليل الثابت لرمز أداة التظليل، بالإضافة إلى مجموعة التمثيل المتوسط المتنقل العادي (SPIR-V) التي تم تجميع GLSL إليها. هناك أيضًا علامة تبويب لعرض تمثيل GLSL الأصلي (مع أسماء تم إنشاؤها بواسطة برنامج التحويل للمتغيرات والدوال وغير ذلك) والتي تم فك تجميعها باستخدام SPIR-V Cross، لتوفير سياق إضافي لـ SPIR-V.
التحليل الثابت
الشكل 1. الترجمة؟
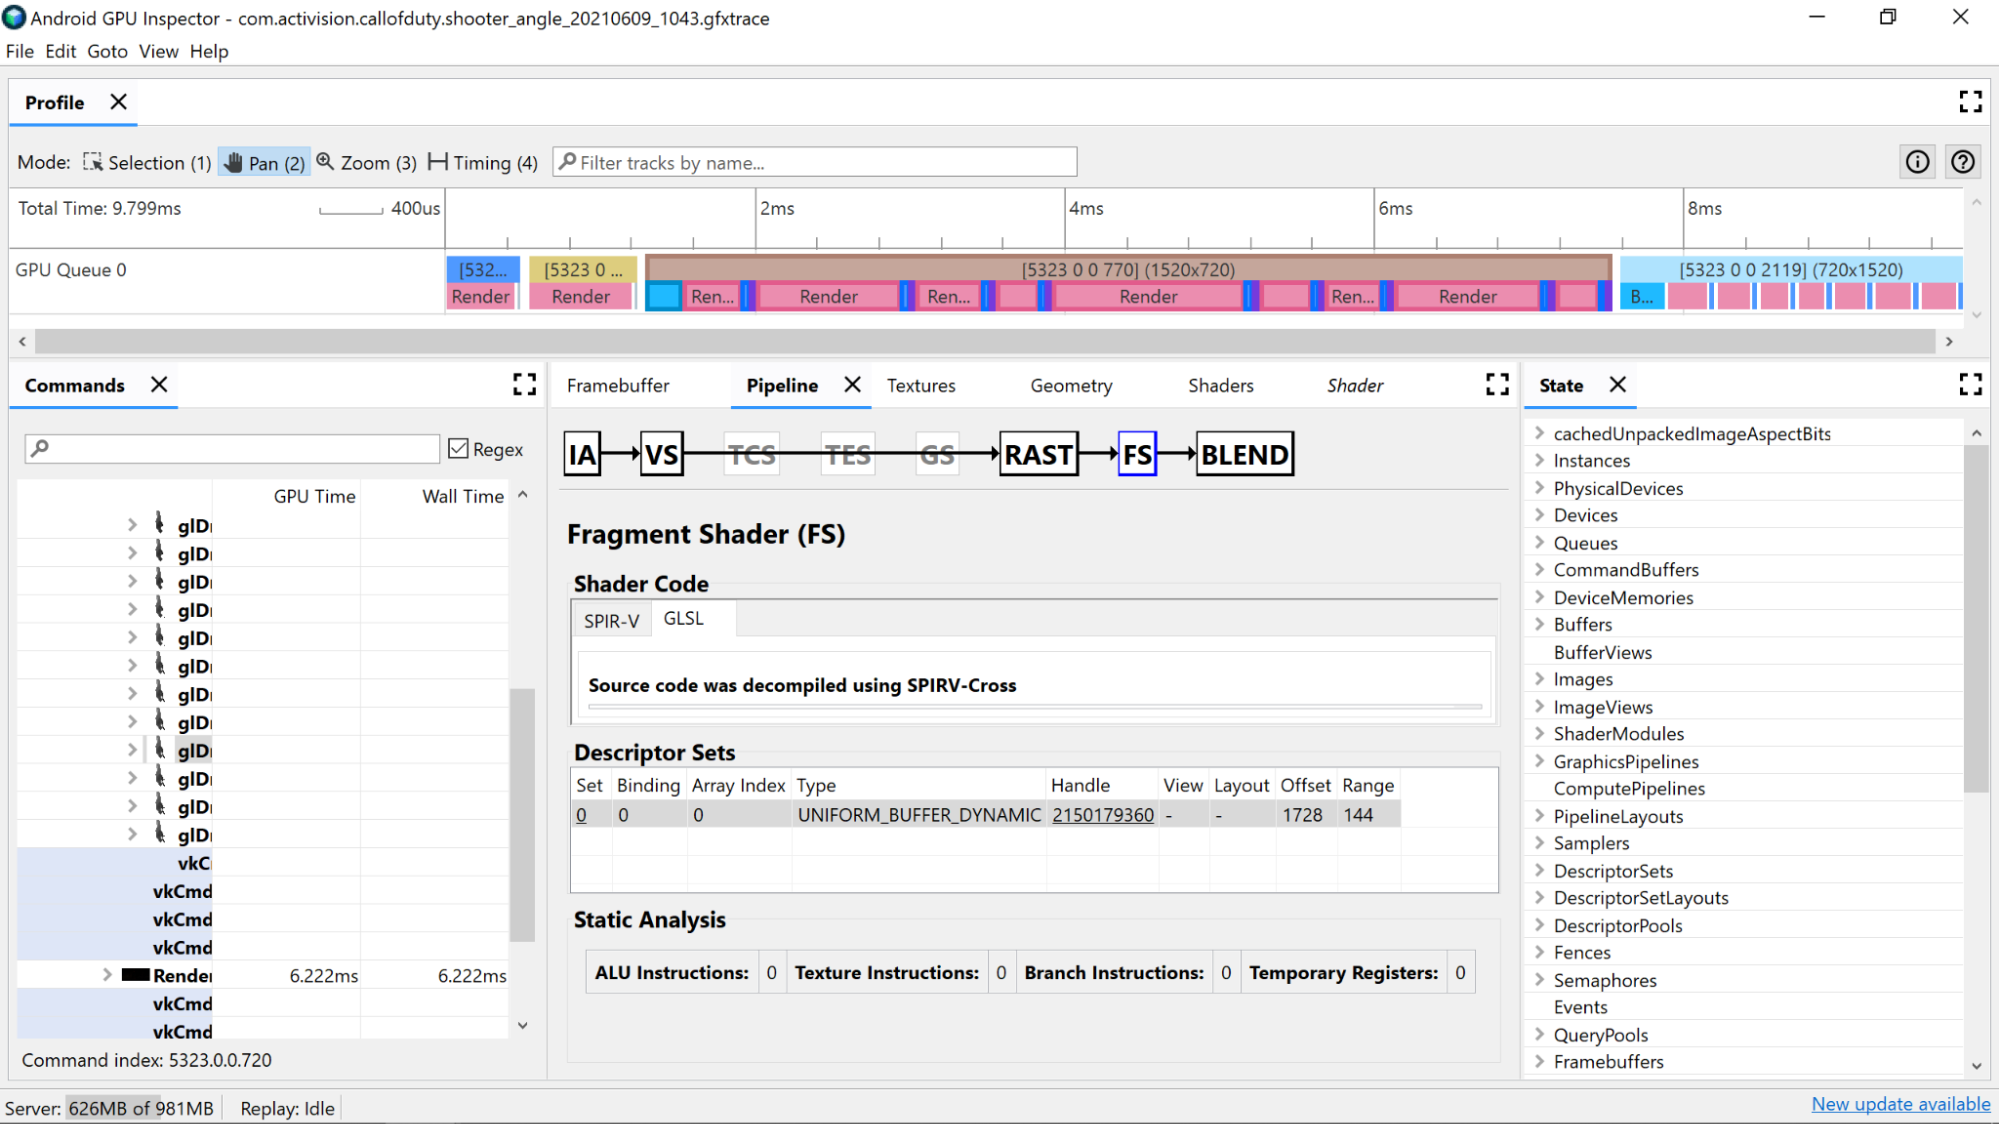
يمكنك استخدام عدّادات التحليل الثابتة لعرض العمليات المنخفضة المستوى في أداة التظليل.
تعليمات ALU: يوضّح هذا العدد عدد عمليات ALU
(عمليات الجمع والضرب والقسمة وغيرها) التي يتم تنفيذها داخل التظليل، وهو يبيّن مدى تعقيد أداة التظليل. حاوِل تقليل هذه القيمة.
يمكن أن تساعد إعادة هيكلة عمليات الحوسبة الشائعة أو تبسيط العمليات الحسابية التي تتم في التظليل في تقليل عدد التعليمات اللازمة.
تعليمات الزخرفة: يعرض هذا العدد عدد مرات ظهور عيّنات من نسيج المستخدم في أداة التظليل.
قد يكون أخذ عيّنات من الزخارف مكلفًا اعتمادًا على نوع الزخارف التي يتم أخذ عينات منها، لذا يمكن أن يوفر المقارنة بين رمز أداة التظليل والزخارف المرتبطة في القسم مجموعات الوصف مزيدًا من المعلومات عن أنواع الزخارف المستخدمة.
تجنب الوصول العشوائي عند أخذ عينات من الزخارف، لأن هذا السلوك ليس
مثاليًا للتخزين المؤقت للزخارف.
تعليمات الفرع: يعرض هذا العدد عدد عمليات الفروع في أداة التظليل. يُعد تقليل التشعّب أمرًا مثاليًا على المعالجات المتوازية مثل
وحدة معالجة الرسومات، كما يمكن أن يساعد المحول البرمجي في العثور على تحسينات إضافية:
استخدِم دوال مثل min وmax وclamp لتجنب الاقتطاع من القيم الرقمية.
اختبار تكلفة الحساب على التشعّب. نظرًا لتنفيذ كلا مساري الفرع في العديد من البنى، هناك العديد من السيناريوهات التي يكون فيها إجراء العمليات الحسابية دائمًا أسرع من تخطي العملية الحسابية ذات الفرع.
السجلات المؤقتة: هي سجلات سريعة وبسيطة تُستخدَم للاحتفاظ بنتائج العمليات الوسيطة التي تتطلبها العمليات الحسابية على وحدة معالجة الرسومات. هناك حد أقصى لعدد السجلات المتاحة للعمليات الحسابية قبل أن تنتقل وحدة معالجة الرسومات إلى استخدام ذاكرة أخرى خارج النواة لتخزين القيم الوسيطة، ما يقلل من الأداء العام. (يختلف هذا الحد بناءً على طراز وحدة معالجة الرسومات.)
قد يكون عدد السجلات المؤقتة المستخدمة أكبر من المتوقع في حالة تنفيذ المحول البرمجي لنقطة التظليل لعمليات مثل حل التكرارات الحلقية، لذا من الجيد إجراء تداخل بين هذه القيمة وSPIR-V أو فك تشفير GLSL لتعرف ما تفعله التعليمات البرمجية.
تحليل رموز التظليل
تحقَّق من رمز أداة التظليل الذي تم فك تشفيره لتحديد ما إذا كانت هناك أي تحسينات محتملة.
الشكل 2. الترجمة؟
الدقة: يمكن أن تؤثر دقة متغيرات أداة التظليل في أداء وحدة معالجة الرسومات في تطبيقك.
حاوِل استخدام معدِّل الدقة mediump في المتغيرات حيثما أمكن ذلك،
لأن متغيّرات الدقة المتوسطة (mediump) تكون عادةً أسرع وأكثر كفاءة من حيث استهلاك الطاقة من متغيّرات الدقة الكاملة (highp)
32 بت.
إذا لم تظهر لك أي مؤهلات دقة في أداة التظليل في نماذج
التظليل أو لم تظهر في أعلى أداة التظليل مع
precision precision-qualifier type، يتم ضبط الإعدادات التلقائية على الدقة الكاملة
(highp). احرص على الاطّلاع على التعريفات المتغيّرة أيضًا.
ويُفضّل أيضًا استخدام mediump لإخراج أداة تظليل الرأس للأسباب نفسها المذكورة أعلاه، ولتحقيق ذلك فائدة أيضًا في تقليل معدّل نقل البيانات للذاكرة وربما استخدام التسجيل المؤقت اللازم لإتمام الاستيفاء.
الموارد الاحتياطية المنتظمة: حاوِل أن يظل حجم الموارد الاحتياطية المنتظمة صغيرًا قدر الإمكان (مع الحفاظ على قواعد المحاذاة). ويساعد ذلك في جعل العمليات الحسابية
أكثر توافقًا مع التخزين المؤقت وقد يسمح بترقية البيانات الموحّدة إلى
تسجيلات أساسية أسرع.
إزالة مخرجات Vertex Shader غير المستخدمة: في حال كانت مخرجات أداة تظليل الرأس غير مستخدَمة في أداة تظليل الأجزاء، يمكنك إزالتها من أداة التظليل لتوفير معدّل نقل بيانات الذاكرة والسجلات المؤقتة.
نقل العملية الحسابية من Fragment Shader إلى Vertex Shader: إذا كان رمز تظليل الجزء يُجري عمليات حسابية مستقلة عن الحالة المتعلقة بالجزء المظلّل (أو يمكن إدخاله بشكل صحيح)، فإن نقله إلى أداة تظليل الرأس يكون مثاليًا. ويرجع السبب في ذلك إلى أنه في معظم التطبيقات، يتم تشغيل أداة تظليل الأجزاء
بشكل أقل تكرارًا مقارنةً بأداة تظليل الأجزاء.
يخضع كل من المحتوى وعيّنات التعليمات البرمجية في هذه الصفحة للتراخيص الموضحّة في ترخيص استخدام المحتوى. إنّ Java وOpenJDK هما علامتان تجاريتان مسجَّلتان لشركة Oracle و/أو الشركات التابعة لها.
تاريخ التعديل الأخير: 2025-07-27 (حسب التوقيت العالمي المتفَّق عليه)
[null,null,["تاريخ التعديل الأخير: 2025-07-27 (حسب التوقيت العالمي المتفَّق عليه)"],[],[],null,["# Analyze shader performance\n\nAGI Frame Profiler allows you to investigate your shaders by\nselecting a draw call from one of our render passes, and going through either\nthe **Vertex Shader** section or **Fragment Shader** section of the **Pipeline**\npane.\n\nHere you'll find useful statistics coming from static analysis of the shader\ncode, as well as the [Standard Portable Intermediate Representation](https://en.wikipedia.org/wiki/Standard_Portable_Intermediate_Representation)\n(SPIR-V) assembly that our GLSL has been compiled down to. There's also a tab\nfor viewing a representation of the original GLSL (with compiler generated names for variables, functions, and more) that was decompiled with SPIR-V Cross, to provide additional context for the SPIR-V.\n\nStatic analysis\n---------------\n\n**Figure 1.**Caption??\n\nUse static analysis counters to view low-level operations in the shader.\n\n- **ALU Instructions**: This count shows the number of ALU operations\n (adds, multiplies, divisions, and more) are being executed within the\n shader, and is a good proxy for how complex the shader is. Try to minimize\n this value.\n\n Refactoring common computations or simplify computations done in the\n shader can help reduce the number of instructions needed.\n- **Texture Instructions**: This count shows the number of times texture\n sampling occurs in the shader.\n\n - Texture sampling can be expensive depending on the type of textures being sampled from, so cross-referencing the shader code with the bound textures found in the **Descriptor Sets** section can provide more information on the types of textures being used.\n - Avoid random access when sampling textures, because this behavior is not ideal for texture-caching.\n- **Branch Instructions**: This count shows the number of branch operations\n in the shader. Minimizing branching is ideal on parallelized processors such\n as the GPU, and can even help the compiler find additional optimizations:\n\n - Use functions such as `min`, `max`, and `clamp` to avoid needing to branch on numeric values.\n - Test the cost of computation over branching. Because both paths of a branch are executed in many architectures, there are many scenarios where always doing the computation is faster than skipping over the computation with a branch.\n- **Temporary Registers**: These are fast, on-core registers that are used to\n hold the results of intermediate operations required by computations on the\n GPU. There is a limit to the number of registers available for computations\n before the GPU has to spill over into using other off-core memory to store\n intermediate values, reducing overall performance. (This limit varies\n depending on the GPU model.)\n\n The number of temporary registers used may be higher than expected if the\n shader compiler performs operations such as unrolling loops, so it's good\n to cross-reference this value with the SPIR-V or decompiled GLSL to see what\n the code is doing.\n\n### Shader code analysis\n\nInvestigate the decompiled shader code itself to determine if there any\npotential improvements are possible.\n**Figure 2.**Caption??\n\n- **Precision** : The precision of shader variables can impact the GPU performance of your application.\n - Try using the `mediump` precision modifier on variables wherever possible, since medium precision (`mediump`) 16-bit variables are usually faster and more power efficient than full precision (`highp`) 32-bit variables.\n - If you don't see any precision qualifiers in the shader on variable declarations, or at the top of the shader with a `precision precision-qualifier type`, it defaults to full precision (`highp`). Make sure to look at variable declarations as well.\n - Using `mediump` for vertex shader output is also preferred for the same reasons described above, and also has the benefit of reducing memory bandwidth and potentially temporary register usage needed to do interpolation.\n- **Uniform Buffers** : Try to keep the size of **Uniform Buffers** as small as possible (while maintaining alignment rules). This helps make computations more compatible with caching and potentially allow for uniform data to be promoted to faster on-core registers.\n- **Remove unused Vertex Shader Outputs**: If you find vertex shader outputs\n being unused in the fragment shader, remove them from the shader to free up\n memory bandwidth and temporary registers.\n\n- **Move computation from Fragment Shader to Vertex Shader**: If the fragment\n shader code performs computations that are independent of state specific to\n the fragment being shaded (or can be interpolated properly), moving it to\n the vertex shader is ideal. The reason for this is that in most apps, the\n vertex shader is run much less frequently compared to the fragment shader."]]