アプリのパフォーマンスを測定する
コレクションでコンテンツを整理
必要に応じて、コンテンツの保存と分類を行います。
Android Studio Profiler のスタンドアロン バージョンを使用して、アプリのパフォーマンスを測定できます。プロファイラを起動する手順は次のとおりです。
- デバッガを実行します。
- Visual Studio ツールバーのプロファイラ ボタン
をクリックします。
[SESSIONS] の横にある「+」ボタンをクリックし、デバッグ可能なプロセスを選択します。

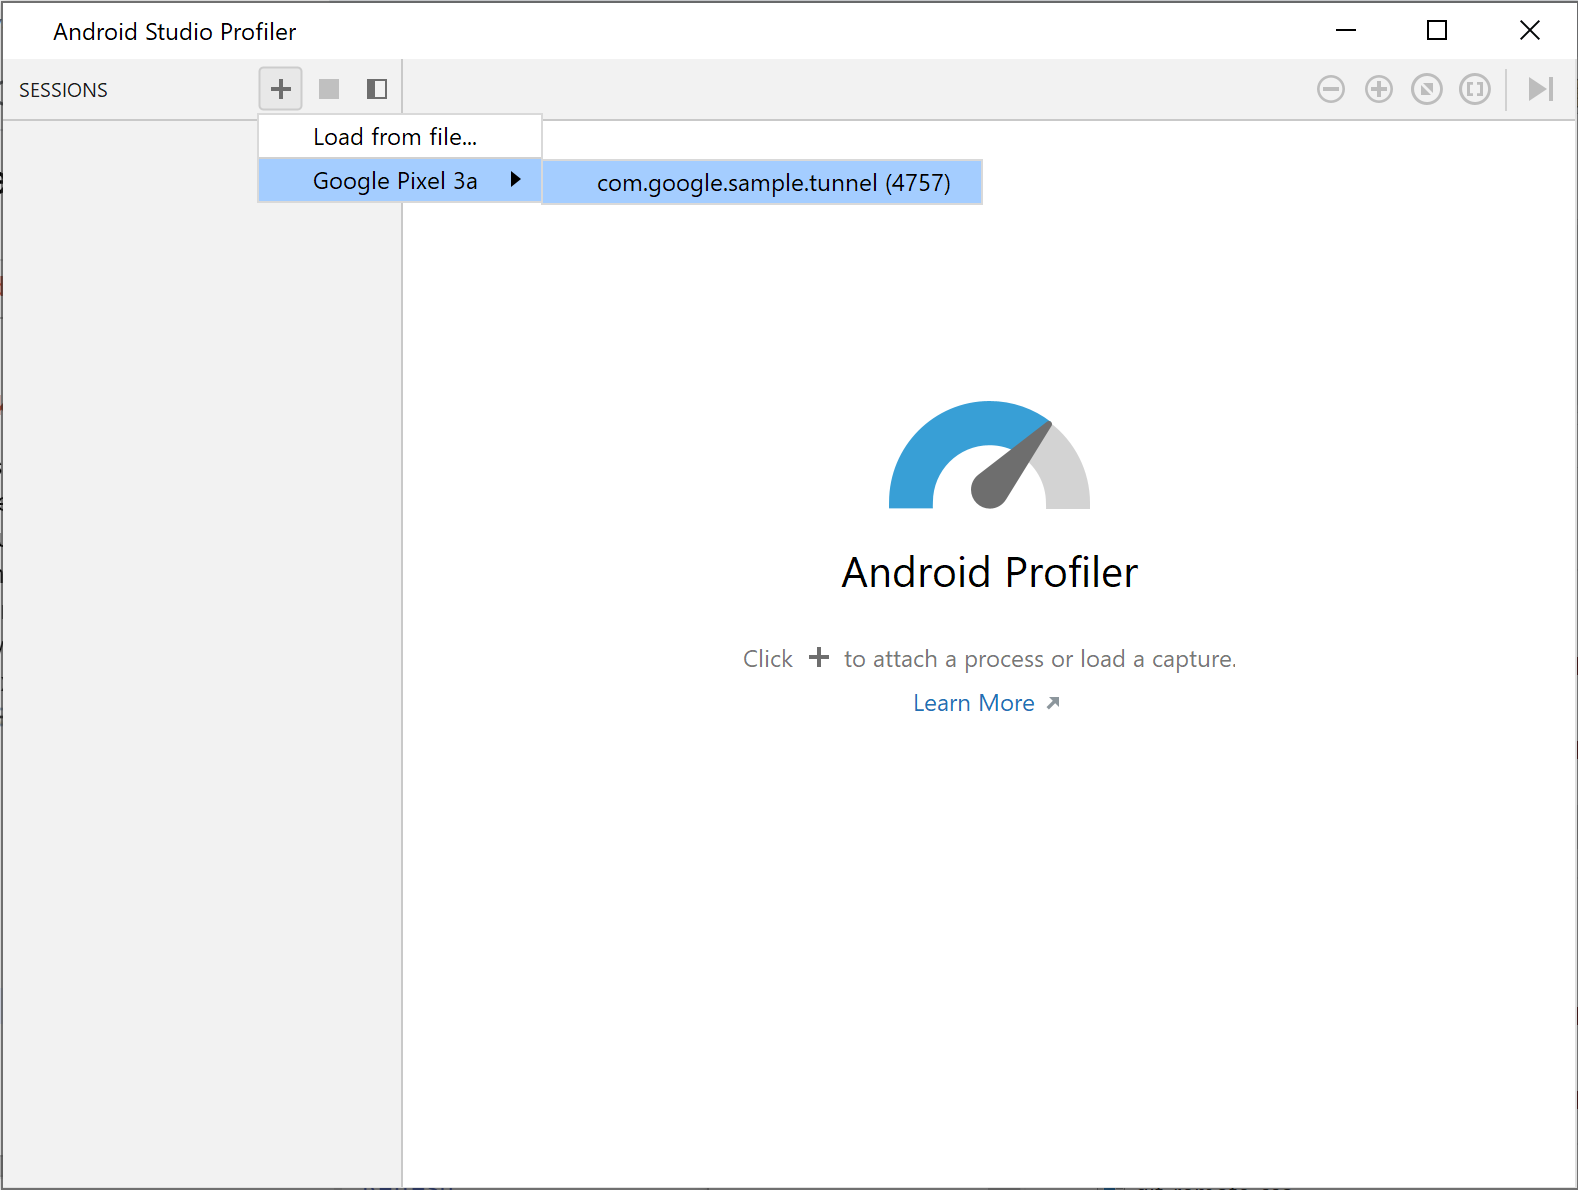
図 1. プロファイラでプロセスを選択する
プロファイラには、CPU、メモリ、ネットワーク、エネルギーのカテゴリに関する使用統計情報がリアルタイムで表示されます。

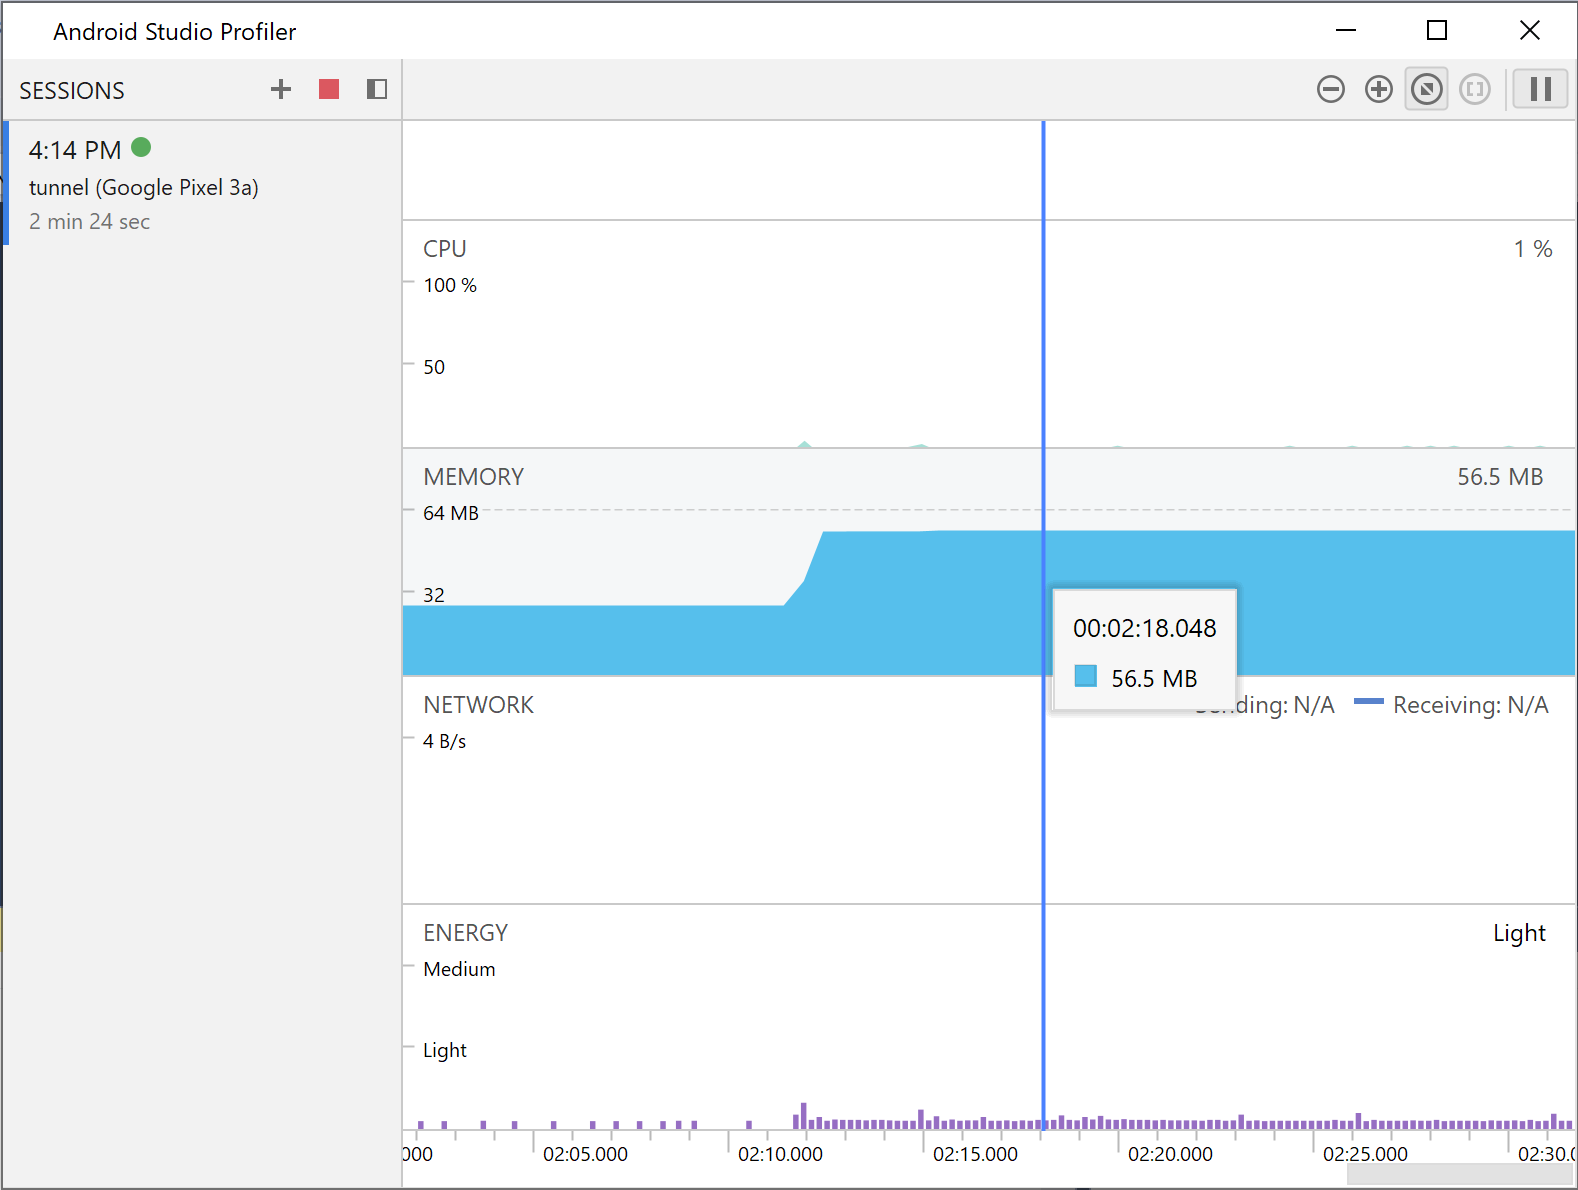
図 2. サンプルのエンドレス トンネル アプリのプロファイラ統計情報
特定のカテゴリの詳細を確認するには、そのカテゴリのグラフをクリックします。
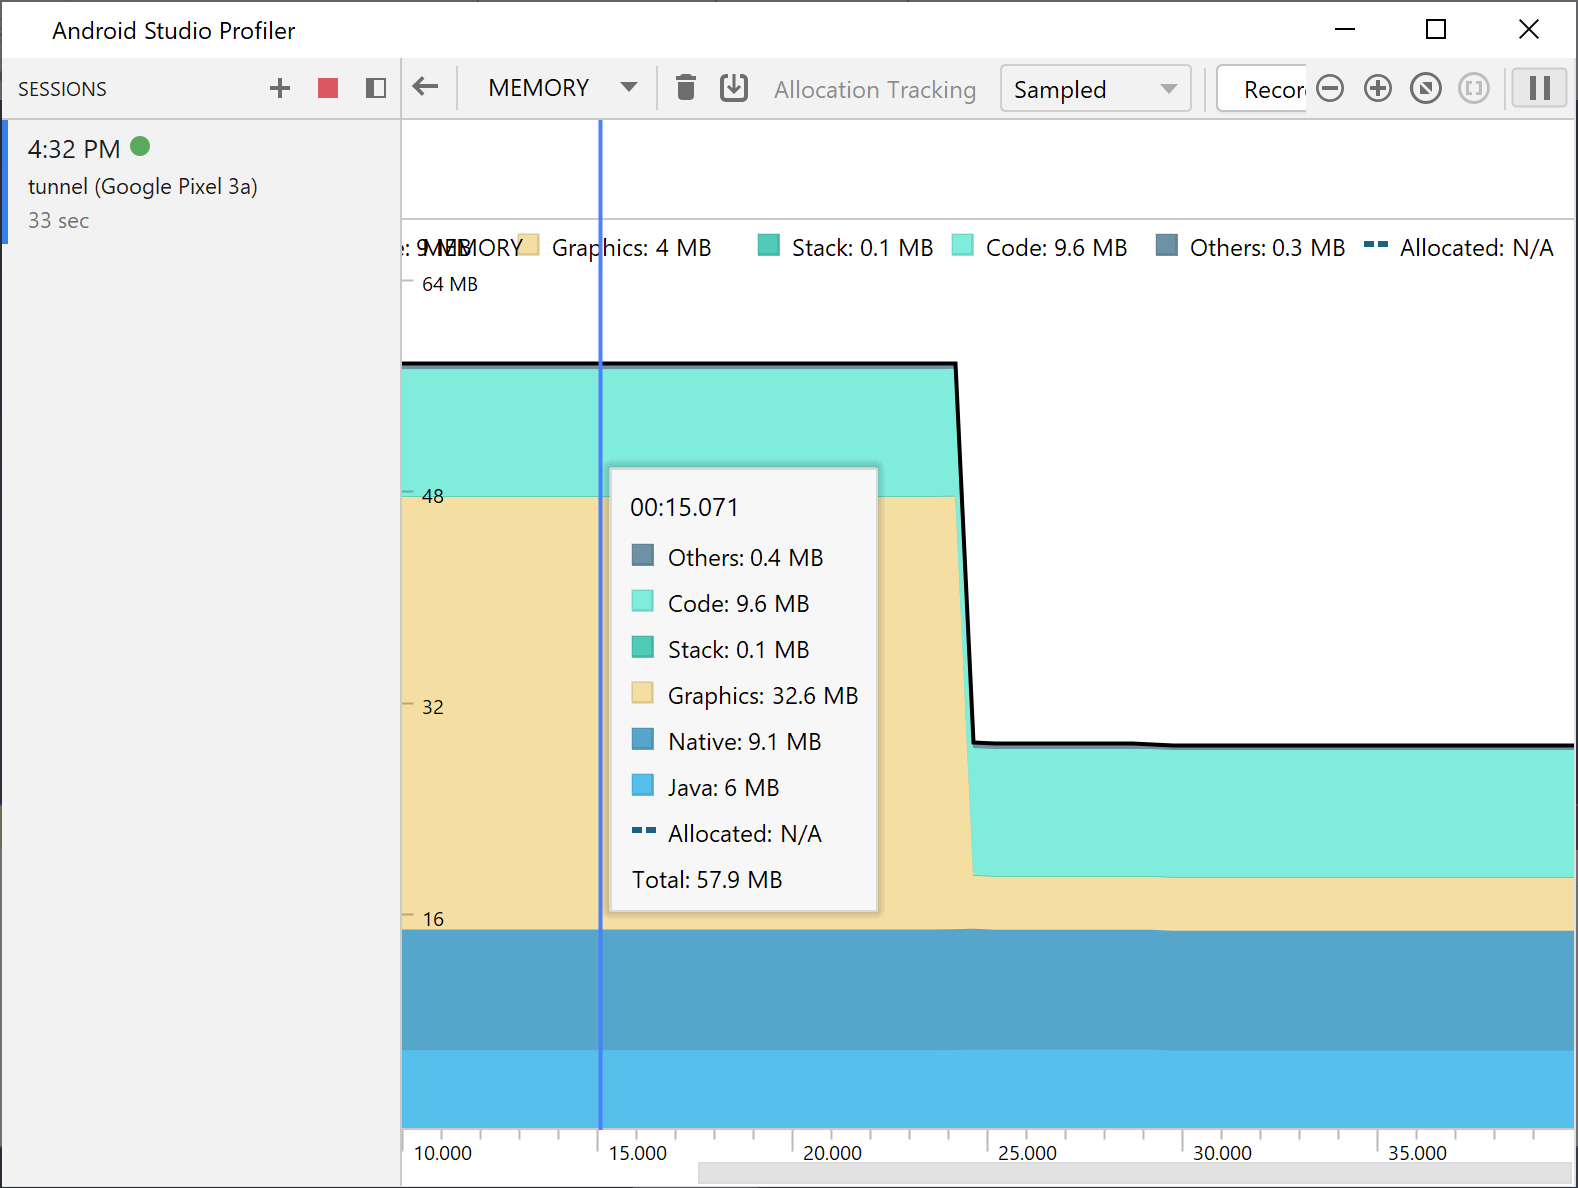
図 3. 詳細なメモリ統計情報
プロファイラの使用方法について詳しくは、Android Studio Profiler のドキュメントをご覧ください。
このページのコンテンツやコードサンプルは、コンテンツ ライセンスに記載のライセンスに従います。Java および OpenJDK は Oracle および関連会社の商標または登録商標です。
最終更新日 2025-07-27 UTC。
[null,null,["最終更新日 2025-07-27 UTC。"],[],[],null,["# Measure app performance\n\nYou can measure the performance of your app using a standalone version of the\nAndroid Studio Profiler. To start the profiler, do the following:\n\n1. Run the debugger.\n2. Click the profiler button in the Visual Studio toolbar.\n3. Next to **SESSIONS**, click the + button and select a debuggable process.\n\n \u003cbr /\u003e\n\n\n **Figure\n 1**. Select a process in the profiler\n\nThe profiler displays real time usage statistics for the following categories:\nCPU, memory, network, and energy.\n\n\u003cbr /\u003e\n\n\n**Figure\n2**. Profiler statistics for the sample endless tunnel app\n\nFor more details on a certain category, click the graph for that category.\n\n\u003cbr /\u003e\n\n\n**Figure\n3**. Detailed memory statistics\n\nFor more information on how to use the profiler, see the [Android Studio\nProfiler documentation](/studio/profile)."]]