앱 성능 측정
컬렉션을 사용해 정리하기
내 환경설정을 기준으로 콘텐츠를 저장하고 분류하세요.
독립 실행형 버전의 Android 스튜디오 프로파일러를 사용하여 앱 성능을 측정할 수 있습니다. 이 프로파일러를 시작하려면 다음 단계를 따르세요.
- 디버거를 실행합니다.
- Visual Studio 툴바에서 프로파일러
 버튼을 클릭합니다.
SESSIONS 옆의 + 버튼을 클릭하고 디버그 가능한 프로세스를 선택합니다.
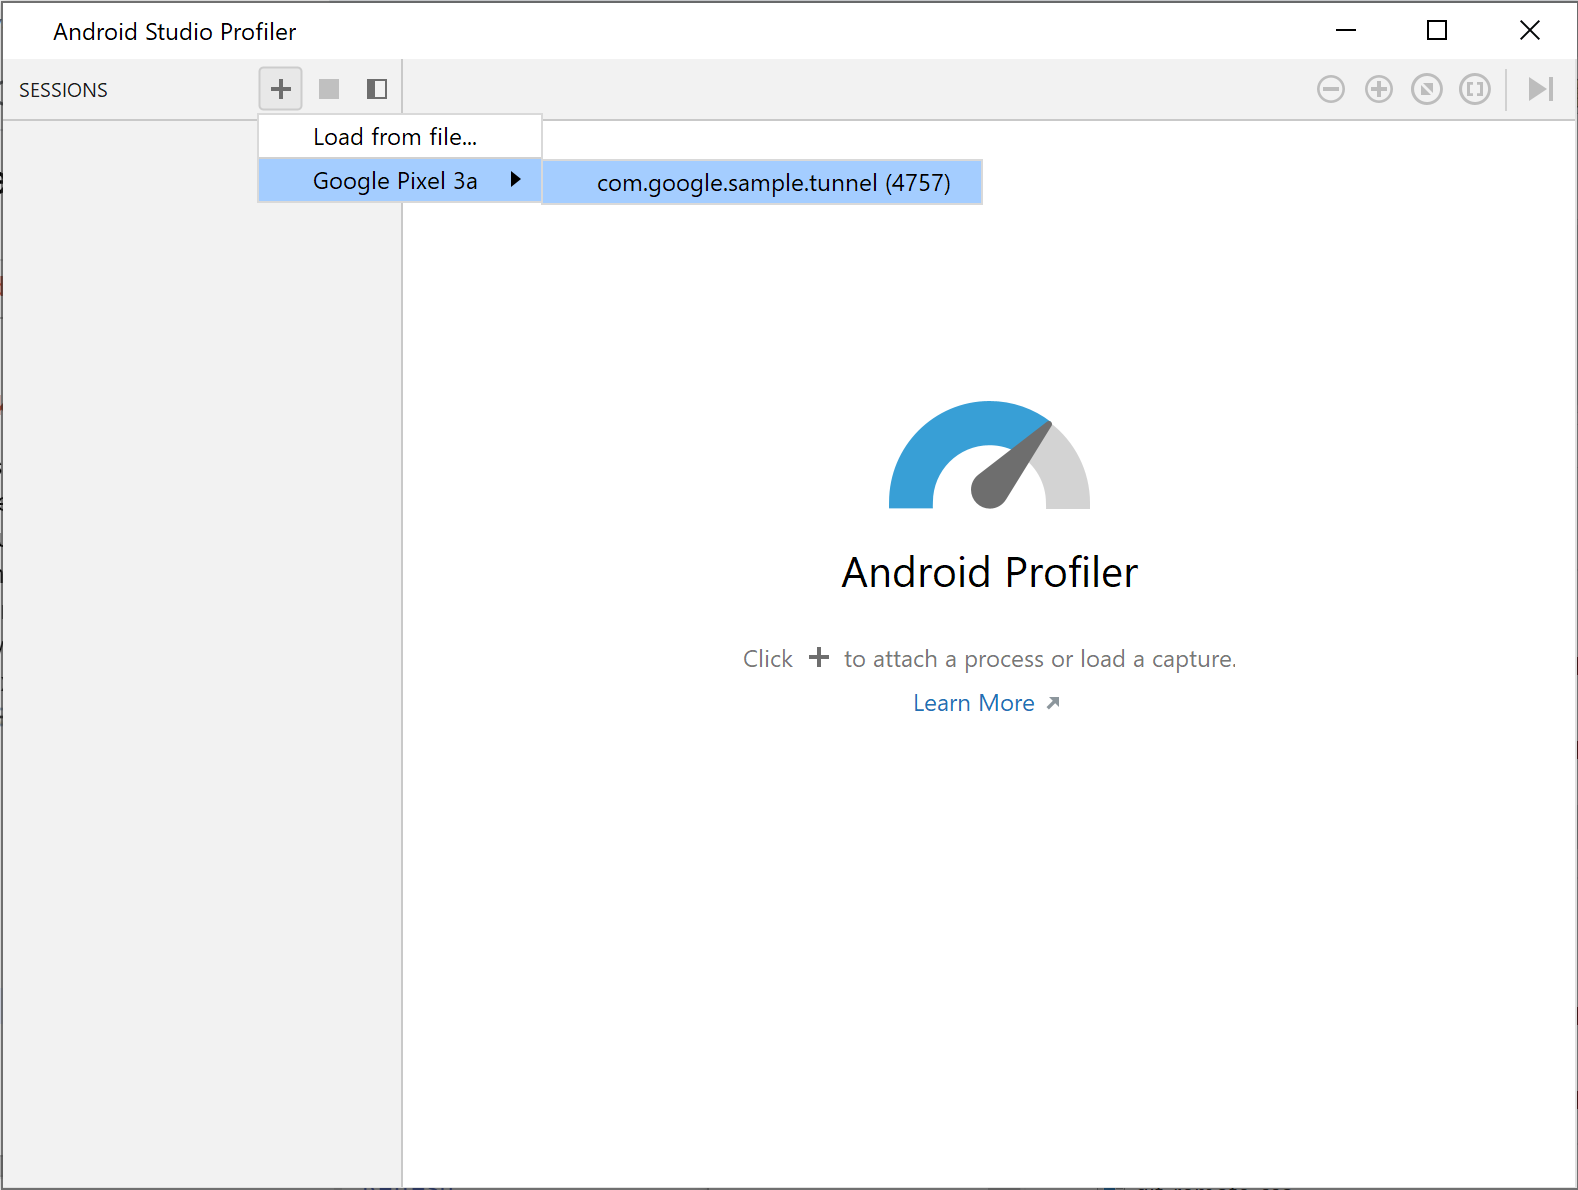
그림 1. 프로파일러에서 프로세스 선택
프로파일러에 CPU, 메모리, 네트워크, 에너지 카테고리의 실시간 사용 통계가 표시됩니다.
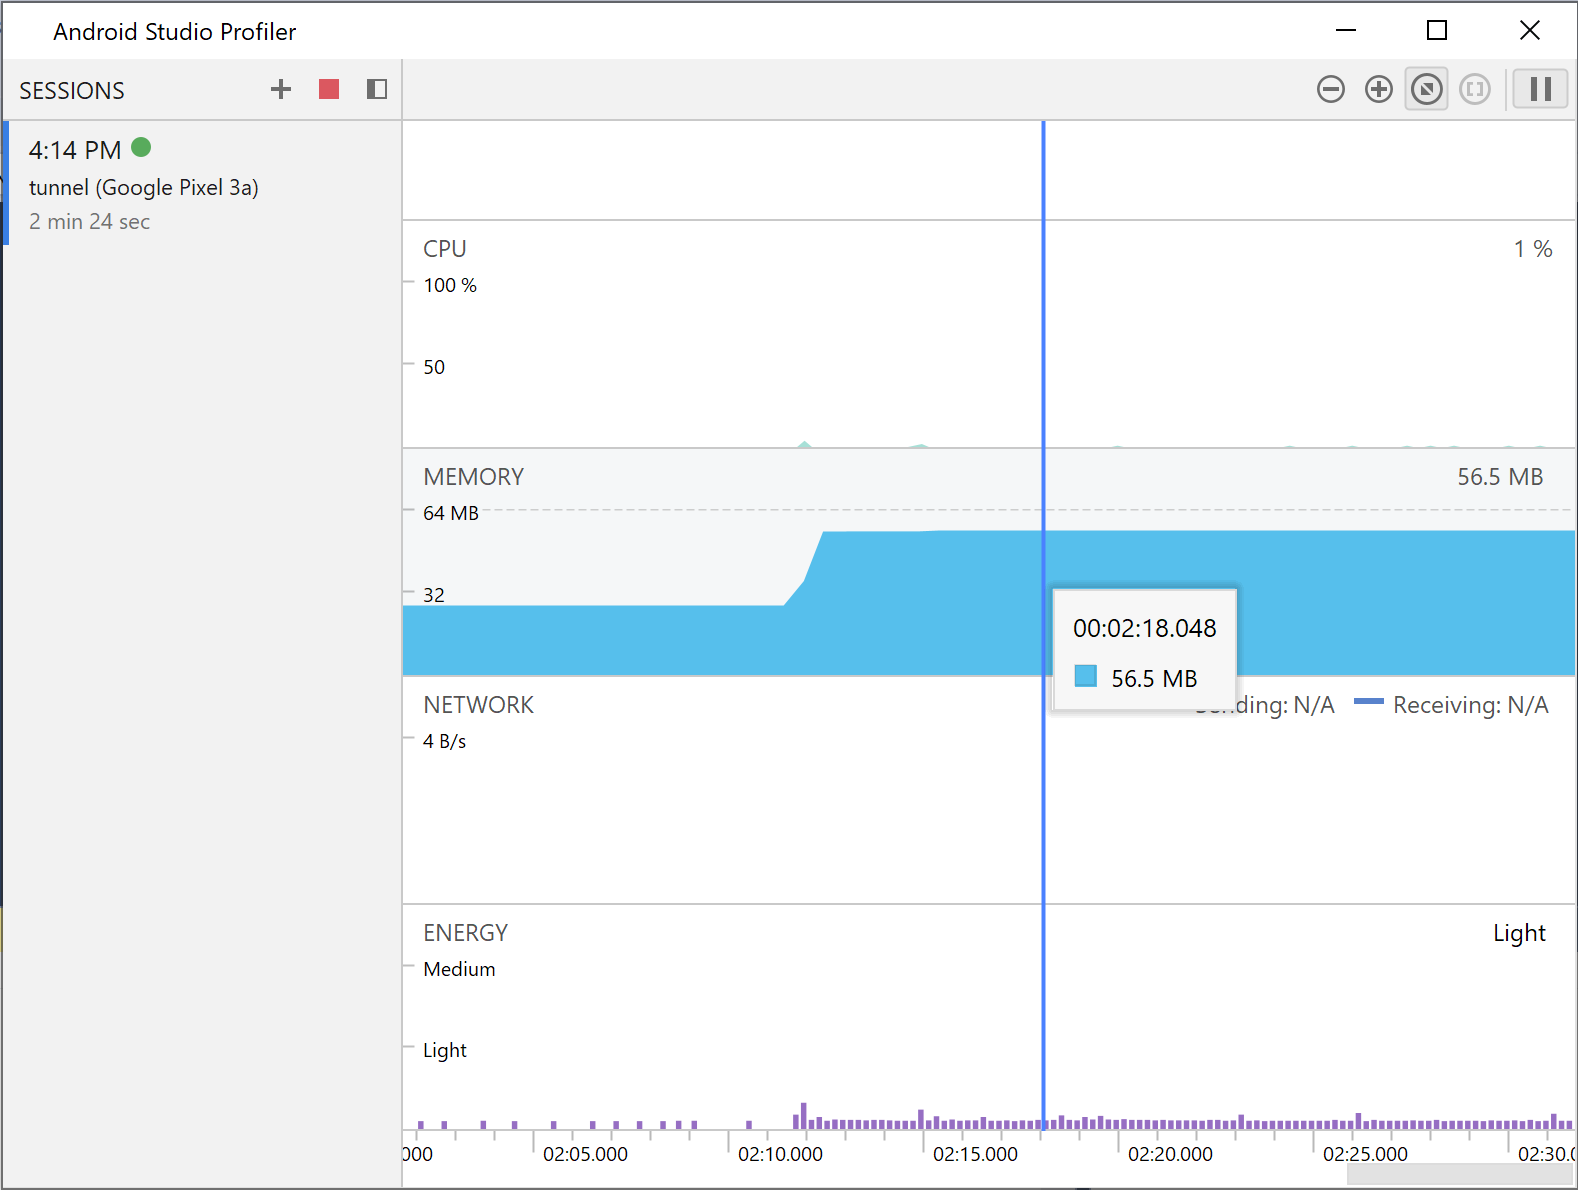
그림 2. 샘플 endless tunnel 앱에 관한 프로파일러 통계
특정 카테고리에 관한 자세한 내용을 보려면 카테고리의 그래프를 클릭하세요.
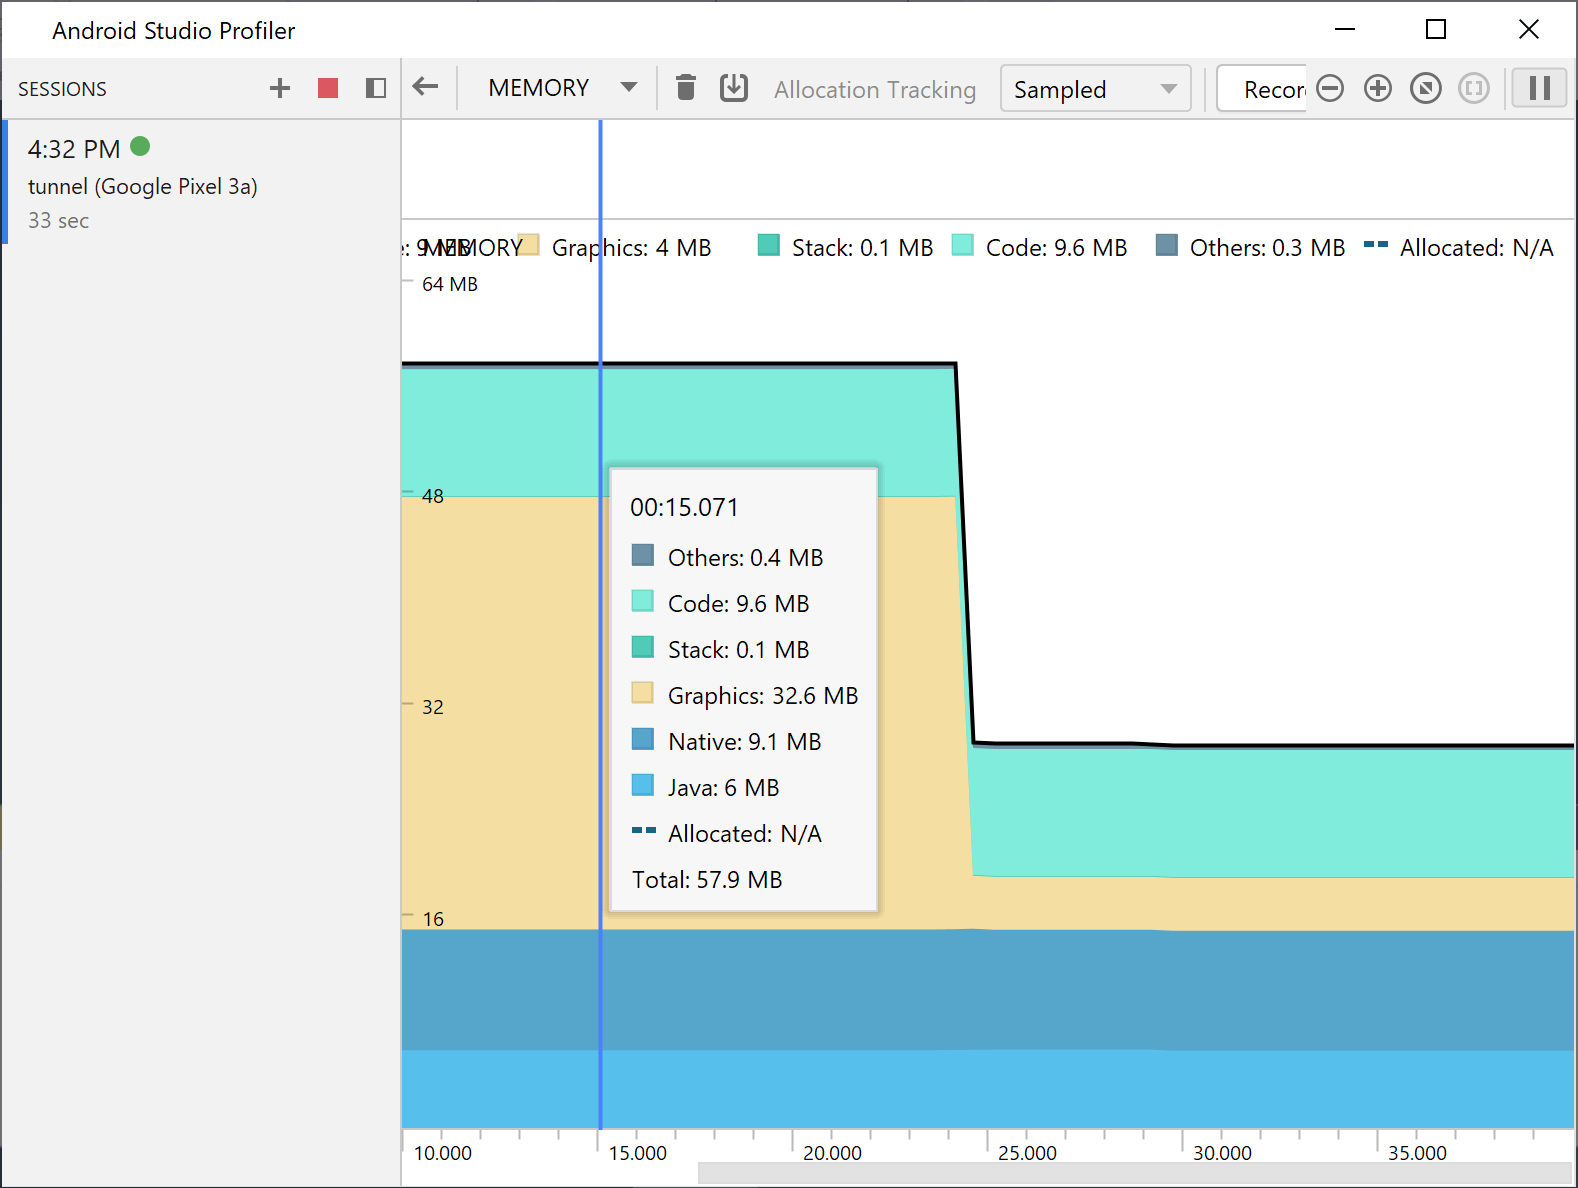
그림 3. 세부 메모리 통계
프로파일러 사용 방법에 관한 자세한 내용은 Android 스튜디오 프로파일러 문서를 참고하세요.
이 페이지에 나와 있는 콘텐츠와 코드 샘플에는 콘텐츠 라이선스에서 설명하는 라이선스가 적용됩니다. 자바 및 OpenJDK는 Oracle 및 Oracle 계열사의 상표 또는 등록 상표입니다.
최종 업데이트: 2025-07-27(UTC)
[null,null,["최종 업데이트: 2025-07-27(UTC)"],[],[],null,["# Measure app performance\n\nYou can measure the performance of your app using a standalone version of the\nAndroid Studio Profiler. To start the profiler, do the following:\n\n1. Run the debugger.\n2. Click the profiler button in the Visual Studio toolbar.\n3. Next to **SESSIONS**, click the + button and select a debuggable process.\n\n \u003cbr /\u003e\n\n\n **Figure\n 1**. Select a process in the profiler\n\nThe profiler displays real time usage statistics for the following categories:\nCPU, memory, network, and energy.\n\n\u003cbr /\u003e\n\n\n**Figure\n2**. Profiler statistics for the sample endless tunnel app\n\nFor more details on a certain category, click the graph for that category.\n\n\u003cbr /\u003e\n\n\n**Figure\n3**. Detailed memory statistics\n\nFor more information on how to use the profiler, see the [Android Studio\nProfiler documentation](/studio/profile)."]]
