Measure app performance
Stay organized with collections
Save and categorize content based on your preferences.
You can measure the performance of your app using a standalone version of the
Android Studio Profiler. To start the profiler, do the following:
- Run the debugger.
- Click the profiler
button in the Visual Studio toolbar.
Next to SESSIONS, click the + button and select a debuggable process.
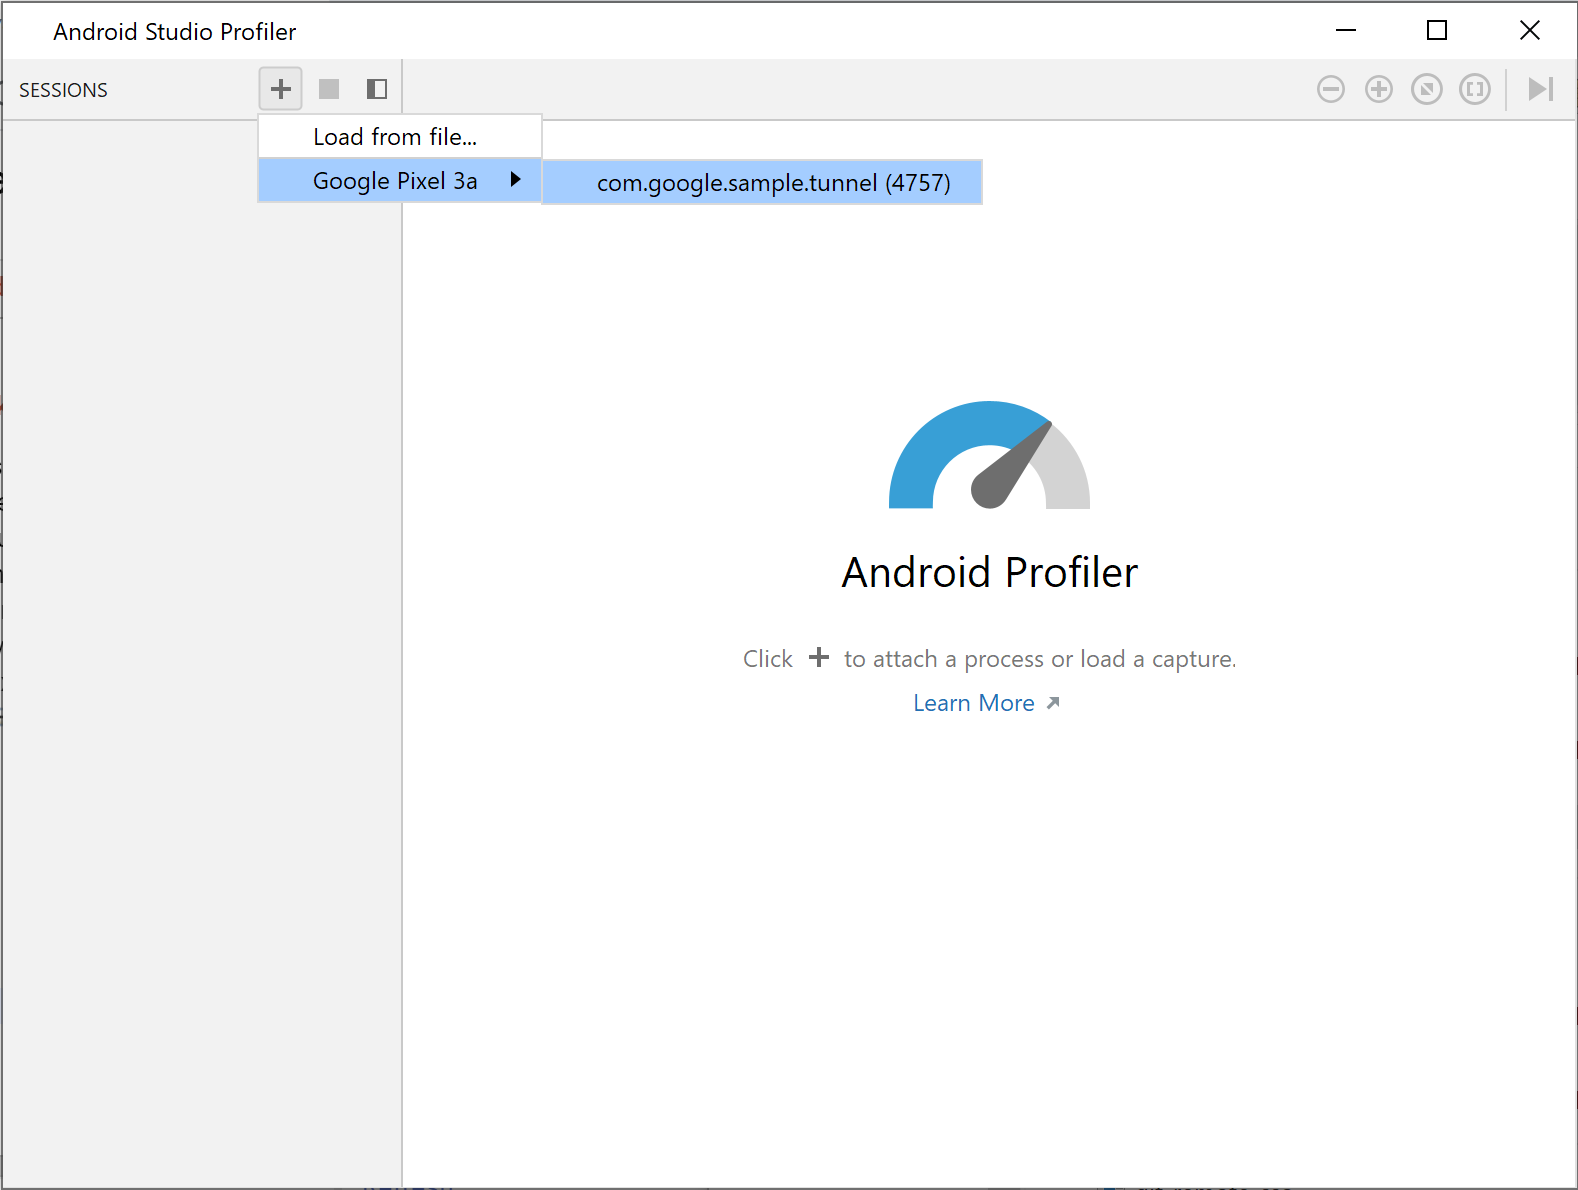
Figure
1. Select a process in the profiler
The profiler displays real time usage statistics for the following categories:
CPU, memory, network, and energy.
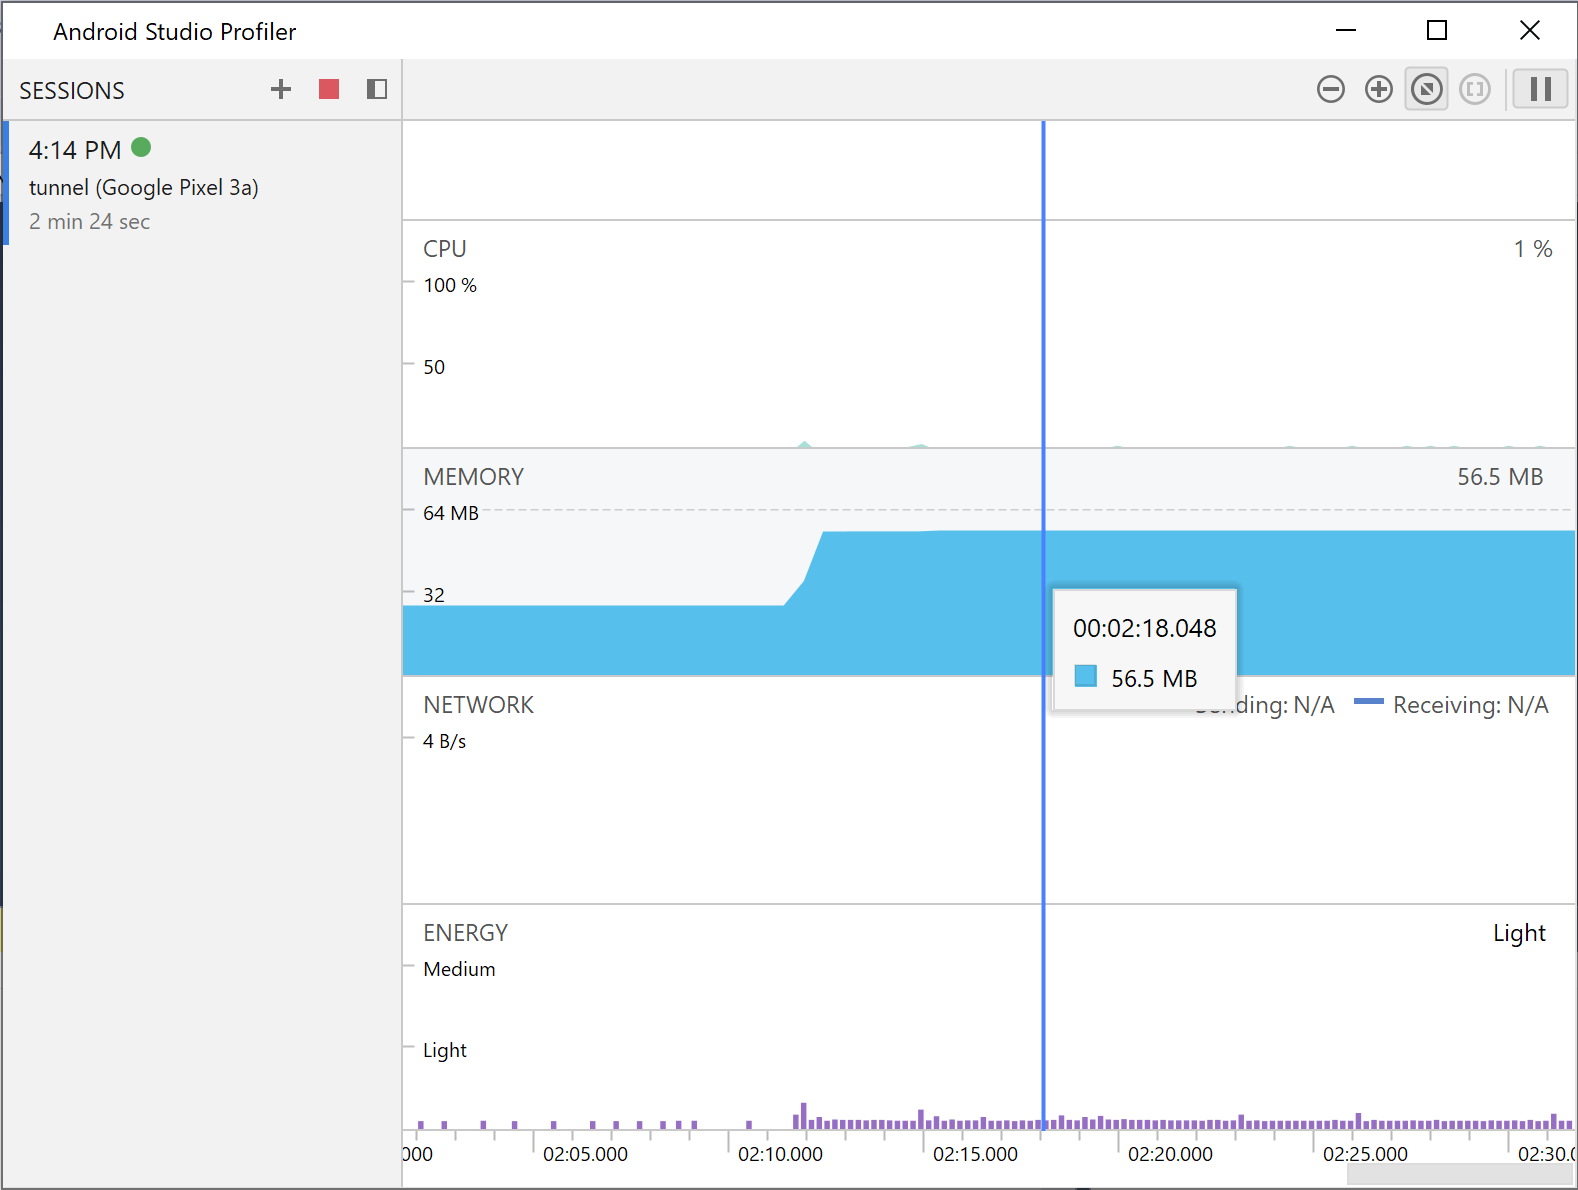
Figure
2. Profiler statistics for the sample endless tunnel app
For more details on a certain category, click the graph for that category.
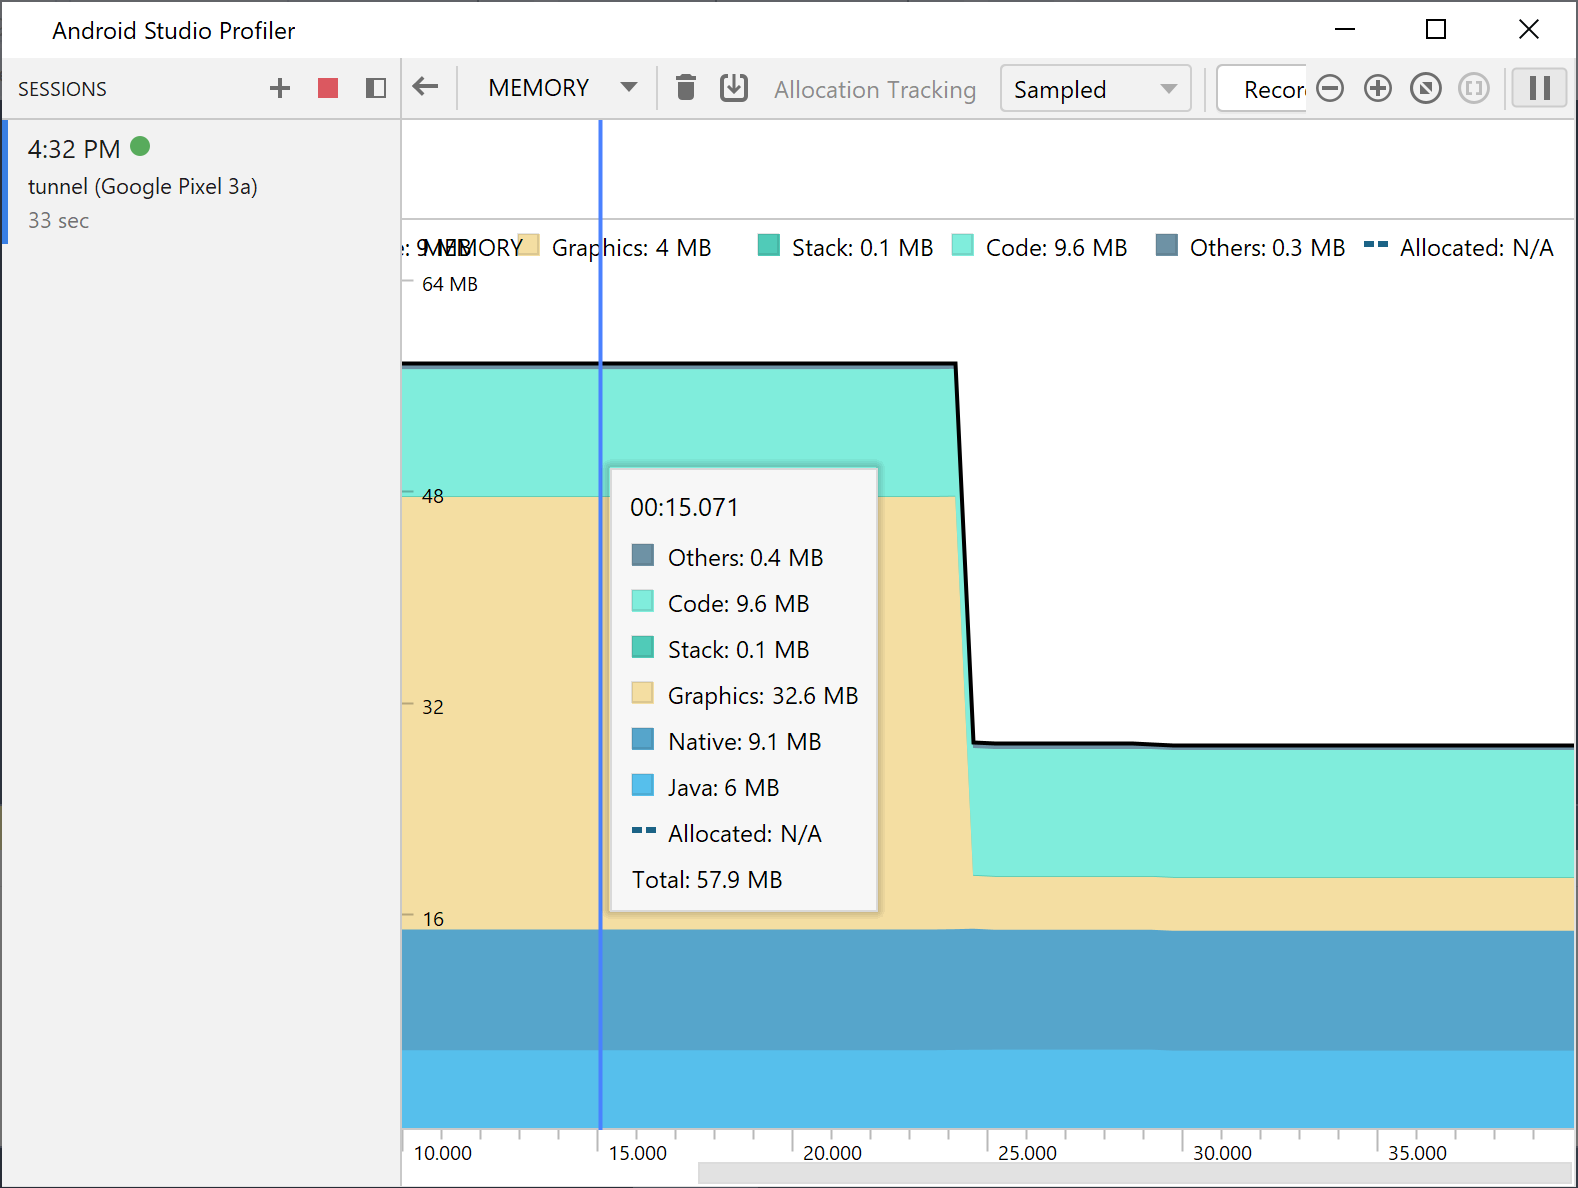
Figure
3. Detailed memory statistics
For more information on how to use the profiler, see the Android Studio
Profiler documentation.
Content and code samples on this page are subject to the licenses described in the Content License. Java and OpenJDK are trademarks or registered trademarks of Oracle and/or its affiliates.
Last updated 2023-08-15 UTC.
[null,null,["Last updated 2023-08-15 UTC."],[],[],null,["# Measure app performance\n\nYou can measure the performance of your app using a standalone version of the\nAndroid Studio Profiler. To start the profiler, do the following:\n\n1. Run the debugger.\n2. Click the profiler button in the Visual Studio toolbar.\n3. Next to **SESSIONS**, click the + button and select a debuggable process.\n\n \u003cbr /\u003e\n\n\n **Figure\n 1**. Select a process in the profiler\n\nThe profiler displays real time usage statistics for the following categories:\nCPU, memory, network, and energy.\n\n\u003cbr /\u003e\n\n\n**Figure\n2**. Profiler statistics for the sample endless tunnel app\n\nFor more details on a certain category, click the graph for that category.\n\n\u003cbr /\u003e\n\n\n**Figure\n3**. Detailed memory statistics\n\nFor more information on how to use the profiler, see the [Android Studio\nProfiler documentation](/studio/profile)."]]